3. ACOE Pulse Release Schedule:4.SFWMD staff’s recommendation to the Corps regarding Lake Okeechobee operations for the period March 2 to March 8, and March 9 to March 15, 2021: Ops_Position_Statement__Mar_02_08_2021
6. HAB update and science data: Todd Thurlow’s website eyeonelakeo
II. DOCUMENTING THE DISCHARGES -all photos taken 3-13-21 by J&E on outgoing tide around 1pm. Friday, March 5, my husband Ed and I , took aerials of the St Lucie River/Indian River Lagoon just one day before the Army Corps of Engineers began discharging to the St Lucie River on March 6, 2021. I can’t say that in all our years of taking photographs since 2013, we have done so just one day before discharges began. Thus, now Ed and my goal is to take photos every week as long as the discharges continue. This will give us a really good opportunity for visual comparison.
We all know a picture speaks a thousand words…
Today, Saturday, March 13, 2021, is exactly one week after discharges began-(this time). You can see last week’s photos here! Do you think they were prettier than todays? I must admit, today, the water coloring looked better than I anticipated and that’s good news. This may not be the case in the coming weeks especially if the ACOE ups the discharge level.
We shall see.
~Jacqui and Ed
-St Lucie Inlet and Sailfish Flats at Sailfish Point-Sailfish Flats with no visible seagrass-St Lucie Inlet -A faint plume is visible going south along Jupiter Island-St Lucie River and Indian River Lagoon-Looking south over Hutchinson Island at St Lucie Inlet-Views north along Indian River Lagoon-At St Lucie Inlet looking over Jupiter Narrows to Port Salerno and Stuart-Water just outside St Lucie Inlet on north side, reefs visible as is sediment exiting inlet -Another view encompassing almost all: St Lucie River, Southern Indian River Lagoon -Looking south towards Palm City where the South Fork connects to the C-44 and Lake Okeechobee when structure S-80 and S-308 are open. -Looking east toward the cross shape and forks of the St Lucie River. IRL in foreground. Sewall’s Point lies between the St Lucie and IRL.
I posted most of these photos on Facebook, but today I will give explanations and document on my blog. From above, our St Lucie/Indian River Lagoon remains beautiful, but we must be sensitive to the losses beneath the waters. These aerials were taken during a “slack tide” between 12 and 2pm on December 9, 2020 by my husband, Ed Lippisch. December 9th was the last of five days the ACOE stopped discharging from Lake Okeechobee; however S-80 was discharging “local runoff.” (Click on chart above.) Unfortunately, due to high lake level and lack of storage reservoirs, since these aerials were taken, the ACOE has begun ramping up Lake discharges once again.
Below Lawrence Glenn of the South Florid Water Management gives a comprehensive ecological report covering low-salinities and loss of oyster spat in the St Lucie and other aspects, positive and negative, for the entire Everglades system.
Below is an explanation of aerials documenting discharges December 9, 2020. All photos by Ed Lippisch.
-S-80 at St Lucie Locks and Dam discharging local basin S-80 runoff on December 9, 2020
S-308 at Port Mayaca, Lake Okeechobee closed on December 9, 2020. No algae visible.
-Plume of along Jupiter Island south of St Lucie Inlet
-Dispersing plume in Atlantic Ocean just past Peck’s Lake in Jupiter Narrows
-St Lucie Inlet -St Lucie Inlet State Park, Sailfish Point, Sewall’s Point, Stuart, Jensen
-Looking north to Sailfish Flats between Sewall’s Point and Hutchinson Island. This area has greatly degraded since 2013 as far as loss of seagrasses and fishing opportunities
-The area below, especially around Sailfish Point, was once considered “the most biodiverse estuary in North America” as documented, first, by Grant Gilmore
-This photo reveals seagrass loss across many areas of the Sailfish Flats
-Another view between Sewall’s and Sailfish Point, a seeming desert…
-Close up, Sailfish Point
-Sewall’s Point, east Indian River Lagoon
-Sewall’s Point is a peninsula surrounded by the St Lucie River on west side, and Indian River Lagoon on east side
Ed Lippisch, selfie. Thank you Ed!
As you can tell, I have lots of people helping me. Whether it is Ed flying or my brother Todd who provides an incredible easy to read website called EyeonLakeO. You can click below to check it out. The more we know, the more we document, the more we can overturn the destruction of our beloved estuary…
Even though the water in yesterday’s photo looked gorgeous, lest we forget, here are some images of the St Lucie River/Indian River Lagoon area during a rainy and cyanobacteria ridden 2018.
Ed and I didn’t start taking pictures until were motivated…
You’ll see that after the rain event, the St Lucie River/Indian River Lagoon looks terrible even with out Lake Okeechobee discharges. This is caused by directed water runoff from C-23, C-24, C-25, C-44 and “local” coastal runoff. Naturally, the river never took all this water. Humans made it this way, and we must fix it.
SFWMD canal and basin map.
Soon after the torrential rain, the Army Corp of Engineers made things even worse and started dumping from Lake Okeechobee through the C-44 Canal into the St Lucie River by opening up the gates at S-308 and S-80.
My husband, Ed, first flew over Lake O on June 1st, just by chance. At this time, he spotted algae on the lake and took a photo. Ironically, the next day, the Army Corp started dumping from Lake Okeechobee on June 2nd!
The algae or cyanobacteria (http://www.ucmp.berkeley.edu/bacteria/cyanointro.html)
that was festering in the Lake began to show up almost immediately thereafter in the St Lucie River that has also become a “nutrient porridge.”
After another long, hot summer, the Army Corp finally stopped discharging in the fall~October 5th… Take a look at the photos and remember to enjoy the blue water when it is here, but NEVER FORGET! Only though looking back, will we have the determination to change the future.
Major rain event in March 2018. Rain filled this vile up many times!
SLR IRL following major rain event in March 2018. This is runoff from C-23, C-24, C-25, C-44, and “locally” from developed areas along the river and uplands made to drain into river. JTL
Following rain event in March 2018. A brown Atlantic.
Following rain event in March 2018, the SLR/IRL ~Scott Kuhns
Following rain event in March 2018 Sailfish Flats between Sewall’s and Sailfish Points ~Scott Kuhns
June 5th. A very dark plume moves south along Jupiter Island, just days after ACOE begins dumping so this is a combination of all pollution/runoff waters…
LAKE OKEECHBEE DISCHARGES ADDED
Ed in the Cub after plume photo
Algae as photographed/spotted by Ed in Lake O on June 1st 2018.
City of Stuart, June 9 2018.
Rio near Central Marine, week of June 12, 2018
Photographing a manatee in the algae along seawall by Mary Radabaugh
Mary Radabaugh manages Central Marine with her husband. JTL
Mary found a dead baby manatee floating in the putrid water shortly after LO discharges. MR
LAKE O: Week of June 16th, June 25th, and July 22nd. Cyanobacteria (blue green algae) blooms and then subsides. ~All the while, this water is dumped into the St Lucie River by the Federal Govt.; the water quality is terrible and this the responsibility not of the Feds but of the State of Florida.
Algae is now very visible in Lake O, June 16, 2018 JTL
June 25, 2018 Lake O, near S-308, Port Mayaca. JTL
C-44 canal leading to SLR from Lake O.
C-44 canal leading from LO to SLR.
Satellite view LO bloom on June 24, 2018. ~At its height.
By July 22, 2018 the bloom in the LO is lessening, JTL
August 29, algae would come and go, throughout the SLR. Here near Overlook Drive JTL
September 4, algae still “coming and going” ~2018 Snug Harbor, Stuart. Photo by my uncle, Dale Hudson
October 5, the ACOE stops dumping from Lake O. The blooms stop almost right away but the damage remains….
December 8, 2018 the river looks “normal” again near Sewall’s Point but it is not. JTL
What should be normal, was a gift on Christmas Day, blue water in the St Lucie River/Indian River Lagoon. The peninsula of Sewall’s Point shone like the gem it is surrounded by aquamarine on both sides: the St Lucie River on its west, and the Indian River Lagoon on its east…
Feeling like the Bahamas, rather than the toxic-sludge we had to endure ~coming mostly from Lake Okeechobee this past summer, 2018, and yes, remember 2016, and 2013….the destruction must stop!
As 2019 edges into the picture, we will once again have to give everything we have to fight for clean water and encourage our state and federal government to support legislation “sending the water south.”
Seeing these beautiful blue waters once again is certainly encouraging. Now to keep the Army Corp and South Florida Water Management District at bay long enough, as projects proceed, and allow our precious seagrass beds to return so baby fish can once again hide, swim, and grow to maturity in these waters; once christened the “most bio-diverse in North America.”
Thank you to my dear husband, Ed, for these photos all taken 12-25-18. And from both of us, “Merry Christmas!”
Sewall’s Point lies between the St Lucie River and Indian River Lagoon
Sailfish Flats between Sewall’s and Sailfish Point. Seagrass remains bleak after years of discharges from Lake O, and other area canals
St Lucie Inlet opening to the Atlantic Ocean between Sailfish Point and the southern end of St Lucie Inlet State Park on Jupiter Island
Another angle of St Lucie Inlet area
Remnants of once lush sea grass beds off Sewall’s Point
Another angle: Evan’s Crary and Ernest Lyons Bridges on far right
A great shot of the now pathetic seagrass beds. This area was once considered “the most bio-diverse in North America,” with approximately 700 acres of healthy seagrasses in this area between Sewall’s and Sailfish Points
Photo below as a comparison ___________________________________________________________________________
NEVER FORGET! Town of Sewall’s Point, Martin County Florida, 9-2013 surrounded by polluted waters released from Lake Okeechobee. Even the ocean brown! Similar years were 2016 and 2018 both with cyanobacteria blooms along shorelines. This awful sediment, and nutrient filled water is dumped on us by our federal and state government and is a health hazard.
My mother gave me a late birthday present: antique post cards and a bottle once filled with “Florida Water,” a popular tonic sold for health and beauty around the world. Believe it or not, “Florida Water” is still selling across the globe, and has been since 1808 ~for 210 years!
It was poignant to receive such a rare and special gift from my mother because if Murray & Landman began marketing Florida water today, the product would not be so romantic; in fact, the branding would more look like war.
“Florida Water,” a thing of the past?
Not if we fight to win.
TCPalm reporter Tyler Treadway holds a container of Florida Water in July 2018, Photo by John Moran
Documenting the discharges, is critical whether by air, on the ground, or from outer space.
The two videos above were taken by me over S-308 at Port Mayaca, the opening from Lake Okeechobee to the St Lucie River, and over S-80 at St Lucie Locks and Dam on Friday, July 20th, 2018. The satellite images below, my brother Todd Thurlow provided, were taken the same day.
It is clear that the blue-green algae/cyanobacteria, covering, at its height, 90% of Lake Okeechobee, has run its course and bloomed. Now, as the “flower falls,” we see what’s left.
As seen in the aerials, and what the satellite images cannot portray, is that the algae is still there just lessened. Flying out over the lake a light green algae film remains over the water, a pastel shadow of its once flourescent self.
7-20-18, light colored algae, Lake O off eastern shoreline, JTL
The seven aerials at the end of this blog post were taken by my husband, Ed, this afternoon, July 22, 2018 around 4pm. The tremendous green shock is gone, but squiggly lines of nutrient bubbles remain, and blue-green algae visibly lines the eastern shoreline to be sucked into the gates…
Will another gigantic bloom arise? Another flower to replace the dropped blooms of yesterday? Only time shall tell…
One thing is certain. Nutrient pollution (Phosphorus and Nitrogen) is destroying Florida’s waters, and unless non-point pollution, especially fertilizer runoff from the agriculture community, is addressed, faster than Florida’s Basin Management Action Plan requires- pushed out 30 or more years, we are will be living with reoccurring blooms indefinitely.
Sentinel-2 L1C, True color on 2018-07-20.jpg 1,668×1,668 pixels, courtesy of Todd Thurlow. Visit Todd’s site here: http://www.thurlowpa.com/LakeOImagery/
Ed Lippisch S-308 at Port Mayaca, the opening form Lake O to C-44 Canal and SLR, 7-22-18
Ed Lippisch 7-22-18
Ed Lippisch 7-22-18
Ed Lippisch 7-22-18
Ed Lippisch 7-22-18
Ed Lippisch 7-22-18
Ed Lippisch 7-22-18
Timely quote for thought by the late Mr Nathaniel Reed 1933-2018
“…The fact that the Department of Environmental Protection and the Everglades Foundation have at last identified every polluter in the vast Okeechobee headwaters is an astonishing feat. The sheer number of polluters is mind-boggling.
The failure to enforce the possibly unenforceable standard (best management practices) shines through the research as testament to the carelessness of our state governmental agencies about enforcing strict water quality standards within the watershed.
There is not a lake, river nor estuary in Florida that is not adversely impacted by agricultural pollution.
As one of the authors of the 1973 Clean Water Act, I attempted late in the process to include agricultural pollution in the bill, but the major congressional supporters of the pending bill felt that by adding controls on agricultural pollution the bill would fail.
Now, 54 years later, fertilizer and dairy wastes are the main contributors to the pollution of the waters of our nation. Algal blooms are all too common even on the Great Lakes.”
Last night’s twilight flight was a first for me, but not for my husband Ed. Usually, we fly in daylight chasing algae blooms or black Lake Okeechobee water…
Last night was just for fun, but one still feels the pull to protect this sacred place.
The beauty of the lands lighting up beneath us was almost as inspiring as the sunset. Humanity, such promise.
We do live in a beautiful place. A place to protect and call home…
If the discharge waters of Lake Okeechobee filled up the City of Stuart, Florida. Last Thursday, they would have reached the top of Stuart’s iconic water tower that stands at 134 feet.
Stuart, North of Monterey.
Whereas, if the ACOE’s discharge waters of Lake Okeechobee were “filling up the City of Stuart,” last Thursday, October 26, these polluted waters, would have reached the top of Stuart’s iconic 134 foot water tower…
Whereas, once again, our economy and ecology is completed devastated, and high bacteria levels in the water are exacerbated therefrom….We shall remember this day…
We shall, therefore, designate, Thursday, October 26, as “Water Tower Day” and say together: “Lake O discharges have reached the top; this must STOP!”
Stop the Discharges
Yes, to put the Lake Okeechobee discharges into perspective, last Thursday the cumulative 2017 ACOE/SFWMD discharges from S-80 passed 134 “Stuart Feet”. The Stuart water tower is 134 feet tall. See my brother Todd’s cumulative total page below:
– In the lost summer of 2013, Stuart/Martin County received 284 “Stuart Feet”, 2.1 times the height of the tower.
– In 2017, the gates did not open until September 5. So it took only 52 days to accumulate that same amount of discharges!
– In 2013, the discharges started on May 8 (with the exception of some small pulses earlier in the year). That year, it took 91 days to hit a cumulative “134 Stuart Feet” – on August 7.
In other words, the discharges have been almost twice the rate as they began in 2013. You can see this in the slope of my brother’s graphs in the web page above. This doesn’t really mean a lot though. In 2013 the discharges didn’t really begin to accelerate until mid-July. At that point, the rates of discharge were comparable to what we are getting now.
– At the current average of about 4200 cfs, we would hit the 2013 total of 284 Stuart feet in another 42 days (December 9). If they are saying the discharges could continue for months, this could happen. We could have another record year, even though the disaster didn’t start until September. Maybe they will throttle it back a little or start pulsing again so it won’t be the case. In any event, this is already another lost year…
(This blog post was based on writing and ideas by my brother and contributing blogger, Todd Thurlow, http://www.thurlowpa.com)
* I edited this post from “today” to “last Thursday.” An ever rising story. 🙂 JTL
These aerial photos over the St Lucie Inlet were taken by my husband, Ed Lippisch, Sunday, October 29, 2017, at 1:45pm.
The number one issue here is the polluted waters of Lake Okeechobee being forced into the SLR/IRL because they are blocked by the Everglades Agricultural Area from going south.
The ACOE has been discharging Lake O waters into the St Lucie since mid-September. These over-nutrified and sediment filled waters continue to destroy our economy and ecology on top of all the channelized agricultural and development waters of C-23, C-24 and C-25. Stormwater from our yards and streets also adds to this filthy cocktail.
Near shore reefs, sea grasses, oysters, fish? A human being? Better not have a cut on your hand…Not even a crab has an easy time living in this.
We move forward pushing the SFWMD and ACOE for the EAA Reservoir with these sad photos and the fact that our waters are putrid at the most beautiful time of year as motivation. We will prevail. One foot in front of the other.
Without documentation, there is no record. With no record, there is less chance for improvement.
Yesterday, Ed, Luna, Bo and I continued to document the discharges, right now, coming mostly from Lake Okeechobee.
There are serious signs of stress in the estuary including reports of leisoned fish that I have posted on Facebook. The rest, from above, we can see for ourselves…
“Keep the pressure on” for the reservoir and for replumbing the great state of Florida.
Say No to Lake O
“Say No to Lake O,” this is one of the rallying cries of the River Kidz. If only it were as easy as just saying “no.” According my numbers-man, my brother Todd, the “St Lucie River has taken in more than 86+ billion gallons this year, enough to put Stuart under 111 feet of water. This is only enough to take 6 inches off of the lake.” The west coast is taking most of the lake level reducing water and of course they are screaming “say no to Lake O” too.
Eco-Voice, present west coast advocacy, 10/17.Realistically, with the Army Corp of Engineers reporting the Lake level at 17.07, today, it will be a few more weeks of releases to get near or under 16 feet. A safer number for the dike and for the people who live in fear of it breeching. Not to mention the 525,000 of acres of protected sugarcane… http://w3.saj.usace.army.mil/h2o/reports.htm
Black Gold, the muck soils south of Lake Okeechobee. (Photo JTL, 2014.)I do believe the authorities are getting the message, though…so keep screaming. SAY NO TO LAKE O! For everyone!
I think our water culture is changing, and the government is being forced/inspired so they can get reelected and respected…. to improve our water/rivers situation. Just yesterday, I got an email about a woman whose Bascom Palmer doctor notes she has an eye infection in her cornea very possibly from “walking the bridge,” repeatedly over the St Lucie River.
I am not making this up.
These health issues are real. More and more people are realizing this. Lake O and other canal unfiltered pollution must halt.
So it looks like the Lake Okeechobee is going down, but we are still going to get releases for while. (See the info below on my brother’s site.) Things are still bad, but they are getting better.
~Never stop screaming “Say No to Lake O,” we owe it to ourselves, and to the future.
Hydro. Lake is going down._________________________________________________________________
Great information below!
Jacqui,
It looks link the lake is coming back down. See the graph links on my Firm Favorites Page:
It’s hard believe that we have taken 86+ billion gallons this year, enough to put Stuart under 111 feet of water. But this is only enough to take 6 inches off of the lake. The west coast is taking most of the lake level reducing water.
By the way, I have a new link of my Lake O Satellite imagery page that will actively pull up the last 7 days of low res images from all three satellites: St Lucie River Discharges Latest Lake O Satellite Imagery (http://www.thurlowpa.com/LakeOImagery/) Click on the “Terra/Aqua/Suomi Last 7 days icon”.
Best regards,
Todd
Thomas H. Thurlow III THURLOW & THURLOW, P.A. 17 Martin L. King, Jr. Blvd. Suite 200 P.O. Box 106 Stuart, FL 34995-0106 Phone: (772) 287-0980 Facsimile: (772) 220-0815 Email: todd@thurlowpa.com Web: http://www.thurlowpa.com
Guest blog an photos by Geoff Norris, Indian River Plantation POA Group:
Guest blog an photos by Geoff Norris, Indian River Plantation POA Group:
These photographs of the Indian River Lagoon were taken on 11 October 2017, between the bridge at East Ocean Blvd, Stuart and north to Indian Riverside Park and Jensen Beach, Florida. The lagoon waters have been polluted for several days with run-off from Lake Okeechobee making the lagoon various shades of brown, orange, red and grey, with dirty scummy foam a feature at the shorelines and also as foamy windrows and wave crests in open water. The St Lucie River is in much the same state.
During this time the Army Corps of Engineers has been opening the locks at Port Mayaca to discharge water from Lake Okeechobee down the St Lucie Canal to the St Lucie River/Indian River Lagoon estuarine system. Rates vary from 4500 to 5500 cubic feet per second, equivalent to 2.9 to 3.5 billion gallons per day. It has been calculated that this amount of discharge would cover the Stuart peninsula north of Monterey Road with four feet or more of water in one day.
The Florida Oceanographic Society reports for 10 October 2017 that salinities in the Lagoon have been drastically reduced by this lake discharge to between 1 and 3 parts per thousand sufficient to kill many estuarine fish and other plants and animals (normally the salinity would be between about 20 and 25 parts per thousand in this section of the lagoon). The Society has graded the overall health of the Lagoon on either side of the East Ocean Bridge as “Poor to Destructive”. See this link:
The Army Corps of Engineers is aware that they are killing the St Lucie/Indian River Lagoon estuarine system by their actions, but consider it more important to lower the Lake Okeechobee level from the current level of 17.2 (feet above mean sea level) to a desired level of between 12 ft and 15 ft.
These are the facts. It is also a fact that politicians have not managed to stop this destruction.
Flight over SLR/IRL to view canal C-23, C-24, C-25 and especially present high releases from Lake Okeechobee through C-44 Canal. JTL/EL 10-14-17
Yesterday, I asked Ed to take me up in the plane, once again to document the discharges. In the wake of much rain and an active hurricane season, the St Lucie River/Indian River Lagoon continues to sacrifice its economy, health, and ecosystem for the EAA and South Florida drainage. A standard operating procedure that is outdated and dangerous.
The discharges from Lake O. have been on and off since Hurricane Irma hit on September 20th. Presently they are “on,” and it shows. Right now our river and ocean shores near the inlet should be at available to boaters, fisher-people, and youth, in”full-turquoise-glory.” Instead, the estuary, beaches, and near offshore is a ghost-town along a chocolate ocean and a black river. The edge of the plume can hardly be distinguished as all is dark, sediment filled waters. A disgrace.
ACOE 10-15-17
10-15-17 Lake O is high. This is a threat to those who live south and around the lake.
South Florida’s southern Everglades, 1850 & today. The water that used to flow south now is sent to the ocean and Gulf of Mexico through canals C-44 (SLR) and C-43.(Cal.) (Map courtesy of SFWMD.)
Image showing drainage of S. Florida through St Lucie and Caloosahatchee rivers. These rivers, that God did not connect to Lake Okeechobee, have been channelized by humans to dump Lake O. This drainage system put in place in the 1920s does not serve Florida today. Not economically, health wise, or environmentally. We must continue to push to replumb the system the best we can. (Public image.)
I told Ed it’s best not to smile for this photo. We look forward to seeing the model and timeline from the SFWMD and ACOE for Senator Negron’s reservoir, and the beginning of turning this century old nightmare.
SFWMD basin map for SLR showing canal discharge structures.
One thing’s for sure, if you don’t have small fish, you won’t have big fish. Being a little fish is actually the most important thing in world. A small fish is a “big fish” we could say, part of it anyway… As kids, we learn about the food chain and it makes perfect sense. All life is dependent upon another; everything is connected.
I have to say when Cameron Jaggerd contacted me, I had to look up “menhaden” in Wikipedia. I was not familiar with the name. When I saw this fish has many names such as shad, bunker, shiner, and pogy, I recognized it.
All those names, incredible! It is obviously an important fish to many regions, and to many people. In fact, I found an article in The American Naturalist entitled “A Study of the Popular Names of the Menhaden,” noting there are over 35 names!
Cameron invited me to attend today’s public hearing to support this important and underrated fish. I hope you can attend too. I myself have witnessed the beauty of terns catching the smallest of these fish, silver-sparkling, like metal against the sun. So beautiful! So important! An inspiration! We must protect these filter-feeding little-big guys, who clean our waters, and feed the world.
Below, Cameron gives great insight and teaches about the history and politics of tonight’s public hearing. His contact info is below.
Hi Jacqui,
My name is Cameron Jaggard and I work on public policy, specifically fisheries management, at The Pew Charitable Trusts. I am based in North Palm Beach and grew up on the southern stretch of the IRL. I am contacting you because there is an important public hearing scheduled for October 10 6pm at the Melbourne Beach Community Center that I thought you’d want to attend. This hearing, the only one in the South, will help decide the fate of “the most important fish in the sea,” also known as Atlantic menhaden or pogy.
With strong encouragement, the Commission could decide to leave hundreds of millions more menhaden in the ocean to grow abundance and provide for predators, such as tarpon, king mackerel, and osprey, or, without it, they could stick with the current single-species approach and likely take hundreds of millions more out of the ocean for fish meal, pet food, and other products. Issue 2.6 Reference Points – Option E of draft Amendment 3 is the option that gets us to this 21st century approach as soon as possible and as such, enjoys broad support from conservation groups (e.g. Audubon, Earthjustice, Wild Oceans, FWF), fishing organizations (e.g. IGFA, ASA, CCA, TRCP, Anglers for Conservation), and the best available science. As a matter of fact, Stony Brook is currently championing a PhD sign-on letter in support that currently has over 100 signers. This piece from Ed Killer last week gives a nice local take on what’s at stake http://www.tcpalm.com/story/sports/outdoors/fishing/2017/09/28/most-important-fish-sea-discussed-oct-10/711709001/
This hearing is a rare and important opportunity for you, your family, and friends to affect change that could have widespread, positive impacts for menhaden, their predators, and the people who depend on them. I heard the big commercial menhaden fishery had 150-200 folks turnout at hearings up north last week. This will be the only hearing in the South, vey important.
Also…I was trying to think of how you could best relate the story of menhaden to your readers. Some thought bubbles I came up with during this brainstorm are below. Seems there are some clear parallels between menhaden and the IRL. Specifically, that we want management of water and management of menhaden that benefits all, not just a select few businesses. Maybe these thoughts will provide some useful inspiration for your story or maybe not.
· Menhaden might not be well known outside of the fishing world, but their plight should be familiar to all those who have fought for the health of the Indian River Lagoon. Much as Florida’s water management has been shaped by Big Sugar, menhaden have been at the mercy of the commercial menhaden reduction fishery, which nets and vacuums menhaden out of the sea to be ground up and processed, like sugar cane, into ingredients for everything from cosmetics to pet food.
· This one-sided approach has produced very clear benefits for these special interests, while leaving everyone else who depends on healthy estuaries and plentiful menhaden in the lurch.
· Now, a proposed rulemaking, known as Amendment 3 to the…, could flip the tables and see to it that an important public trust resource is managed to the benefit of all.
o With your support, Amendment 3 could put much needed restraints on the commercial menhaden fishery to ensure we leave enough menhaden in the ocean to provide for the predators and people that depend on them from Florida to Maine.
· If you support this equitable approach to managing our precious natural resources, I encourage to attend the menhaden hearing today, October 10 6pm at the Town of Melbourne Beach Community Center and make sure to speak in favor of “Reference Points Option E.” Please also submit a written comment in support of “Reference Points Option E” to comments@asmfc.org with the subject “Draft Amd. 3” by October 24, 2017. For more information on Amendment 3 please visit http://www.pewtrusts.org/en/research-and-analysis/blogs/compass-points/2017/08/31/fate-of-most-important-fish-in-the-sea-hangs-on-commission-decision
FAQ:
(1) What’s happening?
The state officials that set rules for menhaden commercial fishing along the East Coast, the Atlantic States Marine Fisheries Commission, will decide at a November 13 meeting in Baltimore how to move forward a new management model for this important fish. While fisheries managers throughout the country are starting to set catch limits for forage fish like menhaden in a way that leaves enough in the ocean for predators to eat, it will make history if menhaden are managed this way. That’s because menhaden is the biggest fishery by volume on the East Coast, and third in the country, after Alaska pollock and Gulf menhaden.
(2) What’s the timing?
Now is the chance for the public from Maine to Florida to influence the outcome. Until October 24, the Commission is inviting comment on menhaden management from the public in every state through in-person hearings, and emailed or written comments. This hearing is the only one in Florida. ASMFC has asked comments be submitted to comments@asmfc.org with the subject line Draft Amd. 3 . Pew has an action alert for people to submit a comment http://advocacy.pewtrusts.org/page/13431/-/1?_ga=2.234760734.140280769.1505740197-721074420.1504012946 .
(3) Why do people here care?
Menhaden (also called bunker and pogy) are prey for many species that people care about. Recreational fishermen want to see plentiful menhaden in the water for tarpon, king mackerel, billfish and more to eat; same goes for birders looking for eagles and ospreys and whale-watching tourists and residents looking for humpbacks close to shore.
(4) Who can I talk to?
I can arrange a time for you to speak with Pew’s Joseph Gordon, who leads the Mid-Atlantic ocean conservation team and can give you the national context for this issue; here’s his latest Pew blog on menhaden. A member of Joseph’s team will be at each hearing and can help you find people to talk to there, so let me know if you’d like to be in touch with him.
(5) Are there any visuals?
Great visuals are out there on menhaden and their predators. In the last few summers, videos showing these species feasting on menhaden (see this shark video and this humpback video as examples) are popular.
(6) What’s interesting about menhaden?
Many people may not have heard of menhaden, because they don’t end up as seafood in this country. Commercial fishing for menhaden is mostly a “reduction” fishery that grinds them into pet food, fertilizer and fish oil; about a quarter of menhaden caught end up as bait for other fishermen to use. Despite menhaden being one of the country’s biggest fishery by volume, there were no catch limits at all until 2013. While the menhaden population seems to be growing, it is still at near-historic lows. It was much larger in the 1960s, 70s and 80s, before hitting lows in the 1990s and 2000s.
Best Wishes,
Cam
Cameron Jaggard
Principal Associate, U.S. Oceans, Southeast |
The Pew Charitable Trusts | c: 202-590-8954 |
e: cjaggard@pewtrusts.org | pewtrusts.org
Twitter: @Coastal_Cam
Menhaden
Shad, bunker, shiner, pogey, and no telling how many other names, are all describing the menhaden (Brevoortia patronus). They grow to approximately one foot and are very similar in appearance to the freshwater shad, but are not the same fish. Menhaden are extremely oily, which is why they have been commercially netted for so many years for the oil and meal that can be produced from them. They are many people’s “secret” bait for almost all species, using them alive, dead, or cut. They should be hooked just like all the other baits that I have written about so far — For trolling, hook them through the nose; for bottom fishing, through the nose or over the anal fin; and as cut bait, they should be cut diagonally and hooked over the top of the cut surface.
Menhaden are plankton filter feeders and can only be caught with a cast net since they won’t bite a hook. Sometimes when you see bait “striking” or rolling on the surface, it is a school of menhaden making surface slurps of minute surface food items. We used to be able to spot menhaden inside Tampa Bay in the summer time by the oil slick that will form over a large school. They also have a very distinctive smell if you are downwind of them. They are a very fast moving fish, and usually by the time you see them on your fish finder, they have moved far enough away from the boat so that you cannot net them. We try blind throws of the cast net in the area where we can see them flipping on the surface; this usually will produce bait. Menhaden are also very intolerant of low dissolved oxygen and will die quickly in a poorly aerated live well. Still, they are five star on my list of baits.
Just as a note, if you have never seen live menhaden, many of them have a small critter that comes crawling out of their mouths when they die. This is quite a surprise the first time you see it. It appears to be some sort of shrimp or crab that looks like a mantis shrimp and must live inside the mouth or gill area without hurting the menhaden. I don’t remember seeing this written about in any of the fish books, but surely some biologist somewhere has seen this.
The following is a texting conversation between my brother, Todd, and me, just over an hour ago. As you can see, Todd keeps me in real-time. Now, I wish to share with you.
Todd: Hi Jacqui, looks like it’s “balls to the wall” —like the old jet fighter saying.
Lake O is at 17 feet and rising…
Jacqui: Holy —! Didn’t Gary Goforth say the max for S-80 is 12,000 CFS? How much is this?
Todd: This is normal high-end. ~4000 cfs. In 2004-2005 it looks like they maxed at 5-6000cfs. I’ll graph against the lake stage.
Jacqui: How do u know it’s 4000? I see nothing posted 4 today on ACOE site.
Todd: S-80 hit 6,727 cfs on 10/06/2004. The lake was at 17.86 and rising it peaked at 18.02 on 10/13/04.
Hurricane Jeanne had hit days earlier on Sept. 25
Jacqui: I remember that. Bad.
Todd: Also. The 4000+ right now is instantaneous. The stats you always see are a mean for the day. Right now that are piling between 1000cfs and the high 5000s. It looks like they did almost hit 6000 earlier today.
Pulsing not piling.
Jacqui: Awful. I think it stinks that unless you know how to access all the technology, you don’t know the river is getting slaughtered until the following days. A nightmare. Thanks Todd. Goodnight.
Today is October 7th, 2017 and I am sharing photos taken October 6th, 2017 in the area of the St Lucie Inlet displaying the recent discharges from Lake Okeechobee and area canals. The plume was measured four miles out, this is very far, and can be seen both north and south of the inlet. The edges are churned up and blurred, and there are many layers fanning out.
I share to document. I share in hope of eventual change, and I share to inspire the so many people who are causing change, change, that one day we will see in a better water future.
Thank you to my husband Ed for piloting, and to passenger, and photographer, Matt Coppeletta.
Sincerely,
Jacqui
All photos taken of the St Lucie Inlet area on 10-6-17 by Ed Lippisch and Matt Coppeletta. Discoloration of water is caused primarily by discharges from Lake Okeechobee but also from canals C-23, C-24, C-25 and area runoff.
“Right now billions of gallons of fertilizer, sewage, and legacy pollution from Lake Okeechobee are spewing into the St. Lucie River, carrying a new threat of toxic algae. Water managers may say Irma left them no choice, but of course that’s a half-truth…”
All photos/videos taken off St Luice Inlet September 30, 2017 JTL/EL
Documentation of primary and secondary plumes at St Lucie Inlet caused predominantly from human directed ACOE/SFWMD discharges post Irma and other from Lake Okeechobee & canals C-44, C-23, C-24, C-25. 10am, September 30, 2017. Primary plume out 3 miles; secondary 3 1/2 and not quite south to Peck’s Lake. We must continue to #ReplumbFlorida #forthefuture #forthewildlife #forthekidz #fortheeconomy for our #indianriverlagoon JTL/EL
Hurricane Irma may be gone, but her waters are not. Our now black river and the giant plume off the St Lucie Inlet attest to this. Clean rain that fell in our region during the hurricane is now filthy “stormwater” discharging, unfiltered, through manmade canals C-23, C-24, C-25, and C-44. Nature did not design the river to directly take this much water; this much water kills.
Every plume looks different, and this one is multilayered with no clear border. Sediment soup, black-brown in color, yesterday it extended out about 2/3 of a mile into a stirred up Atlantic and flowed south, in the rough waves not quite having made it to Peck’s Lake.
Since Hurricane Irma’s rains, area canals dug with no environmental foresight in the 1920s and 50s for flood control, and to facilitate agriculture and development, have been flowing straight into the river. On top of this, in anticipation of the hurricane, three days prior to IRMA the Army Corp of Engineers began discharging from Lake Okeechobee. During the hurricane they halted, and then started up again at high discharge levels reaching over (4000 cfs +/-) this past Friday, September 15th. As Lake Okeechobee rises and inflow water pours in from the north, and is blocked by the Everglades Agricultural Area in the south, we can expect more Lake O discharge on top of the canal releases themselves.
As advocates for the St Lucie River we continue the fight to expedite the building of the EAA reservoir and to create a culture to “send more water south.” In the meantime, we, and the fish and wildlife, and the once “most bio diverse estuary in North America,” suffer…
My brother Todd, has complied many other links on his website’s favorites under St Lucie River and ACOE/SFWMD: http://www.thurlowpa.com/news.htm
Post Irma flight over St Lucie River/IRL 9-17-17
SFWMD canal and basin map. C-44 canal is the canal most southerly in the image. All canals shown here discharge into the SLR/IRL.
The confluence of the St Lucie River and Indian River Lagoon at Sewall’s Point, an area once full of seagrasses and fisheries and formerly considered the heart of “the most bio diverse estuary in North America.”
Waves in plume breaking over offshore reefs; looking north to Hurchinson Island.
Southern edge of plume along Jupiter Island and Jupiter Narrows south of St Lucie Inlet.
Looking south off St Lucie Inlet.
South edge of plume looking south towards Jupiter Island.
As the possibility of a direct hit from Hurricane Irma approaches, I can’t help but reflect.
Looking back, we see that it was the severe flooding and the hurricane season of 1947 that led Florida and the U.S. Government down the track to where we are today through the creation of the Florida Central and South Florida Flood Project, (CSFP).
In 1947, during the United States’ post World War II boom, Florida had a very active and destructive hurricane season. This slightly edited excerpt from the ACOE’s book River of Interest does a good job giving a short overview of that year:
“…Rain began falling on the Everglades in large amounts. On 1 March, a storm dropped six inches of rain, while April and May also saw above average totals. The situation became severe in the summer…
As September approached and the rains continued, the ground in the Everglades became waterlogged and lake levels reached dangerous heights. Then, on 17 September, a hurricane hit Florida on the southwest coast, passing Lake Okeechobee on the west and dumping large amounts of rain on the upper Everglades, flooding most of the agricultural land south of Lake Okeechobee.
George Wedgworth, who would later become president of the Sugar Cane Growers Cooperative of Florida and whose parents were vegetable growers in the Everglades, related that his mother called him during the storm and told him, “ this is the last call I’ll make from this telephone because I’m leaving. . . . “We’ve got an inch or two of water over our oak floors and they’re taking me out on a row boat.”
Such conditions were prevalent throughout the region. Before the area had a chance to recover from the devastation, another hurricane developed, moving into South Florida and the Atlantic Ocean by way of Fort Lauderdale. Coastal cities received rain in large quantities, including six inches in two hours at Hialeah and nearly 15 inches at Fort Lauderdale in less than 24 hours.
The Everglades Drainage District kept its drainage canals open to discharge to the ocean as much of the floodwater in the agricultural area as it could, exacerbating coastal flooding. East coast residents charged the District with endangering their lives in order to please ag- ricultural interests, but this was vehemently denied…
Whoever was to blame, the hurricanes had devastating effects. Although the levee around Lake Okeechobee held, preventing the large numbers of deaths that occurred in 1926 and 1928, over 2,000 square miles of land south of the lake was covered by, in the words of U.S. Senator Spessard Holland, “an endless sheet of water anywhere from 6 to 7 feet deep down to a lesser depth.” The Corps estimated that the storms caused $59 million in property damage throughout southern Florida, but Holland believed that the agency had “under- stated the actual figures.” The destruction shocked citizens of South Florida, both in the upper Everglades and in the coastal cities, and they demanded that something be done.”
Cover of the “Weeping Cow” book. (South Florida Water Management District)
Well, what was done was the Central and South Florida Flood Project.
Key Florida politicians, and the public demanded the Federal Government assist, and as both the resources and will were present, the project was authorized in 1948 with massive additional components making way not only for flood protection, but for even more agriculture and development. In Martin County and St Lucie County this happened by the controversial building of canals C-23, C-24, C-25 and “improving” the infamous C-44 canal that connects to Lake Okeechobee. This construction was basically the nail in the coffin for the St Lucie River and Southern Indian River Lagoon.
Map showing the Jacksonville District’s initial comprehensive proposal, 1947. (Claude Pepper Collection, Claude Pepper Library, Florida State University, Tallahassee, Florida)
But before the death of the environment was clear, the Corps developed a plan that would include 1,000 miles of levees, 720 miles of canals, and almost 200 water control structures. Flooding in coastal cities and in the agricultural lands south of Lake Okeechobee would be minimized and more controllable.
Yes, a goal of the program was to provide conservation areas for water storage, protecting fish and wildlife habitat. Although water conservation areas were constructed, conservation of wildlife did not work out so well, and has caused extreme habitat degradation of the Everglades system, Lake Okeechobee, the southern and northern estuaries, the Kissimmee chain of lakes, and Florida Bay. Nonetheless, this project made possible for over five million people to now live and work in the 18,000 square mile area that extends from south of Orlando to Florida Bay “protected from flooding” but in 2017 living with serious water quality issues.
With problems apparent, in 1992 the Central and South Florida Project was “re-studied” and we continue to work on that today both for people and for wildlife…
Irma many be the system’s greatest test yet…
Yesterday’s Army Corp of Engineer Periodic Scientist Call was focused on saving people’s lives and safety. After the built-system was discussed, Mr Tyler Beck of the Florida Wildlife Commission, and Mr Steve Schubert of the U.S. Fish and Wildlife Service reported on the endangered Everglades Snail Kites and their nests at Lake Okeechobee. Like most birds, pairs mate for life. There are presently fifty-five active nests, thirty-three in incubation, and twenty-three with baby chicks…
In the coming days, as the waters rise on Lake Okeechobee, and the winds scream through an empty void that was once a cathedral of colossal cypress trees, Mother Nature will again change the lives of Florida’s wildlife and its people, just as she did in 1947. Perhaps this time, she will give us vision for a future where nature and humankind can live in greater harmony…
Hurricane Irma as a category 5, 2017
Everglades Snail Kite, Florida Audubon
SFWMD basin map for SLR showing S-308 and S-80 along with other structures.
Photo, Robert M. Pitchford, as seen on page 45 of “Stuart on the St Lucie” by Sandra Henderson Thurlow.
(Bonnie Gross)
Today I share an incredible historic piece about commercial fishing, written by a leading citizen of Stuart’s earliest days, Mr Curt Schroeder. My mother, historian, Sandra Henderson Thurlow, transcribed his writings. They are typed from a handwritten, unpublished, manuscript. The first time she shared the piece with me I was spellbound and even speechless during parts.
As an animal lover, the story of capturing the manatee, eating loggerhead turtles, or having to tie a line around a cabbage palm tree to hold off a net full of thousands of pounds of fighting mullet was unsettling to me. Nevertheless, those were the times, people were struggling to make ends meet, and the river fed them. They were trying to get everything they could get! In time, it was realized that they were “killing the goose that laid the golden egg…”
Mr Schroeder’s excerpt about the effects of the St Lucie Canal’s (C-44) connection to the river and the destruction that followed, only reinforces my present opinion. He writes: “all self-respecting fish left the river, the silt covered the large feeding places, and the continued fresh water killed the mussels, clams and oysters, and changed the depth of our river….”
It’s all quite a story!🐟
Thank you to my mother for her work and for sharing. As it’s a long narrative, I have highlighted some of the most astounding parts for easy reading. Hope you enjoy!
Jacqui
Curt Schroeder emigrated from Germany in 1893 joining his brothers Otto, Ernest, and Albert on the St Lucie River. (SHT)
COMMERCIAL FISHING IN AND AROUND THE ST. LUCIE RIVER
THE MEMORIES, THEORIES AND OPINIONS OF STUART PIONEER CURT SCHROEDER
A manuscript, handwritten by Crut Schroedure during the 1940s, was among the papers of his granddaughter Emily Beach. I have tried to type it as it was written with minimal editing and have not changed the spelling he used for local fishes. Though many of Curt Schroeder’s articles have been published in the Stuart News, I do not believe this piece has ever appeared in print. Sandra Thurlow, July 24, 1994
The crews, two gill net and one seine stayed till mid March, at Palm City, our fish camp. At the beginning of March millions of crabs came into the river and damaged our gill nets, chewing long holes along the lead-line, no sale for crab meat then. One bright moonlit night in February, Capt. John Blakeslee, father of C. D., woke the writer and asked him to get his shotgun and load it with buckshot as there was a black bear across from us, near Noah Parks’ palmetto shack. Slipping into my pants and loading the shotgun with buckshot took a moment. Coming out of our door, I could see across the way near the seine crew shack, something that looked like a bear standing motionless watching. No movement could be detected. From the rear came the encouragement, “Shoot, damn you, shoot!”
Near the line of fire were Noah’s and Sam Young’s bunks. Knowing buckshot to scatter, the watching for movement continued. Finally convinced that there was no animal across from us, we advanced and found Capt. MacCloud’s winter overcoat thrown over a small bush. Part of the overcoat was adorned with black sheepskin. It looked like a bear all right, and if this apparition had been clear of the other shack the writer would have turned loose both barrels.
Speaking of shotguns, my partner that year was a Norwegian, Anderson Stolzwig, who had built our skip jack the “Pompano.” Well Andy owned a single barrel shotgun (maybe some old-timers remember the “Zulu Guns” with the 3 inch firing pins.) This was a 12 gauge. Well in his travel overland and sea, (He had walked from Tampa to Malabar) he had lost the firing pin and used a 20-penny spike in its place. Shooting ducks from the boat, he used to warn anyone with him to stand to the left near him, as the recoil of the shot would throw the 20-penny spike back. Of course, he could not aim this gun as the firing pin would have hit him so he simply pointed the gun. He became a good shot and killed many a duck. But he had no takers when he offered his Zulu to others for a trial shot. Of course the had to carry a pound of 20-penny spikes on his hunting trips, as he never found any of the used ones after firing.
We had lots of visitors at Palm City. Our palmetto shacks stood in a fine palmetto and oak hammock. One evening Noah’s father, Uncle Ben Parks, came to see us about dusk. Standing near the writer, he asked ,”Did you hear him?.”
Of course a head shake was the answer. “Well,” he said, “a big gobbler flew up to roost within 300 yards of us.” He went off located his gobbler and next morning at daybreak, armed with his 10 gauge double-barreled shotgun, he went to the roost and killed the big gobbler.
The first seine fished in our section was manned by Brice Loveless and Noah Parks. In those days, seines ordered were hung at the factory in New York. As the crew lived at Waveland, most fishing was done in the Indian River.
In September 1895, R. D. Hoke, Harry Schultz and George Keller entered into a partnership ordered one 800-yard seine, wings of 9-thread near mid 12-thread and ________15 thread net. A very heavy seine. Their end cables were 3/4 inch rope The steamboat “Lillian” furnished the power to lay out the net, and with trip lines and pulleys hauled it ashore.
Keller was an experienced fisherman and also owned the seine boat. Their first remarkable haul was on Rocky Point in early November, they caught over 50 tons of fish, 20 tons salable, balance foul.
In this haul they had over 10,000 pounds of stingrays some weighing up to 200 pounds. As stated earlier one of the crews fishing out of Palm City was a seine crew, Noah Parks, Captain Sam Young, A. C. MacCloud and Sam Martin the crew. Noah had an accident and hurt his knees badly so to fill his crew he asked the writer to take over and captain his rig. Going towards the inlet after clearing Rocky Point, a large school of mullet was spotted, preparations made for the half circle to enclose the school of fish. Two men were set overboard in knee-deep water, at that time our shorelines were about 50 yards, as soon as the crail or end staff dropped off the boat, these men began to pull for shore. Seining the school of mullet near the shore, the writer used only 2/3 of the net, which was a 500 yard seine and got criticized for not using all the net. Seining the thick school of mullet only a crazy man would have tried to use the entire net, when our boat came near shore we pulled net off to reach shore and tied it securely to a tree. As a strong flood was running, we hauled the end first put over, to keep the net in shape, then next to the end put over last, got same in shape, returned to the first put over end, by this time there were about 250 yards of net out, after pulling a few feet, the school of fish decided it was time for their turn, the fish massed, hit the net and pulled us four men into the river, seeing this, the writer went back and tied the cork line around a cabbage palm standing on the river bank, for a few minutes the crew gained, as this was a slack, a new onset by the mullet, we dug in our heels and it seemed were holding our own, then everyone sat down or fell on the other one behind, the terrific strain was over, we hauled the net in fast, formed about 20 feet of number-9-thread webbing gone between cork and let-line. Picking up we had a 40 dollar haul, but lost about 100.000 pounds of mullet. It was the same day the “Lillian” made her big haul.
When the St Lucie Inlet was permanently opened in 1892 saltwater fish could more easily enter the SLR/IRL and commercial fishing became a local industry. Photo by Robert M. Pitchford, courtesy of Sandra Henderson Thurlow.
About February 1897 Noah and his crew caught a bull sea cow, manatee that weighed a ton. There was demand for sea cow in our northern zoos. The boys put an inch cable around the narrow part in front of the broad tail and fastened the other end of the cable to a cabbage palm. Delivering their catch of fish they went to Juno, the county seat, for permission to sell the manatee, same was granted. Noah came to the writer and asked him if he could load this big bulk. Having studied this beforehand, he was assured, “yes.” As the sale was confirmed on a Sunday, Noah with the crew and the writer, with two large boats went to the scene of capture. The water at the end of the cable, where the manatee rested, was 4 1/2 feet. We sank the large bateaux which could carry 3000 pounds, slipped it under the sea cow, till same rested in the center and bailed the boat dry. For some reason the old bull did not like the planking under him, he rolled over to the side and upset the boat, anticipating some trouble the manatee had not been untied. Well, the same procedure had to be gone through again. The writer dispatched one of the crew to the camp to bring an additional boat. When this boat arrived a boat was lashed to each side holding the middle one with the bull safe. The buyer had a tank built at West Palm Beach, loaded on a flatcar and brought to north Stuart where the manatee was loaded over a ramp with help of block and tackle. About two weeks later one of the New York Sunday papers told how the brave buyer had captured the monster of the deep at peril of his life. Of course our manatees are very timid, the only danger lies in coming too close to the broad tail. In deep water, a blow with that tail will knock a man senseless.
In summer 1894, Cousin Henry Stypmann and the writer had rowed down to Sewall’s Point, while there about one hundred yards off shore, the rear of the row boat went up about 2 feet above water, throwing the writer, who handled the oars, backward, all his hair standing on end. Well Henry set in the back seat laughing, asking for an explanation, he told me that the s—— of the rowboat had hit a sleeping sea cow. I had the same pleasure in the summer of 1918, sailing up river in a light skiff the center board hit a sleeping sea cow knocking the boat about a foot out of the water. The old sea cow got scared and made for the deep. Manatee Creek and Manatee Pocket also called Scobee’s Pocket, seemed to be the favored spots for sea cows to come ashore on high tides and take their sun baths. As many as 7 have been seen there at one time, sunbathing.
During the summer they came up the river and were often seen in the North and South Forks. In the early days when game was plentiful, no one though of eating manatee, but around 1916 young manatees were butchered, pickled and smoked, the meat tasting like pork. In April 1897, C. D. Blakeslee and self decided to take up seining. Charles had ordered a 350 yard specified cotton net. When this net arrived, we went up to his homestead to tar and hang this net. Having given lots of thought to this new undertaking — this was the first seine hung in South Florida. — We hung our cork-line reasonably tight, the lead-line was pulled tight by two men and securely tied, making same 20 feet shorter than the cork line. In hanging the net, each cork and lead were tied separately. Captain John kept our hanging needles filed and Robert, better known as “Pete,” by his friends was the chef, conscientiously cooking three pots of Lima beans each day, the fourth day Pete struck as cook. Our first one-man strike in upper Dade. Pete by inclination and training was a horse trainer, also a good man with cattle. Pete trained trotting horses, owned a rig of his own and won many a race in Yankee land. From 1912 till 1918 he was a teamster and always had fine horses. He passed away in 1926, while this writer was North.
Coming to the fish house with our small seine, Uncle Ernest Stypmann, then part owner of the fish house said, “Once already that seine will never glut our marked.” The 350 yards of light twine 4-inch mesh on wings. Three and one half-inch bunt–looked a very small pile. We ran 100 yard end lines which gave us a 550 yard half-circle. After handling it a few days making paying catches, the two of us made 8 hauls a day. Three weeks after our first landing at the fish house we came in with 1200 pounds of large pompano and about 400 pounds of bottom fish. Well, Uncle Ernest scratched his beard. Ogletree said he’d take 600 pounds of pompano at 6 cents and ship 600 pounds or three barrels on commission, bottom fish 1 cent per pound. It seemed the little seine had glutted the market. Each barrel and packing the fish was $2.00. The commission 10 percent. About six days after our catch, Ogletree made the proposition to give us 6 cents per pound for the fish sent out on commission. Our attitude was that we take what the commission sale would bring, win or loose. These pompano had been sent to Washington D. C. and returned eighty bucks for the 3 barrels, $8.00 for commission and $6.00 for the 3 barrels ice and packing, left $64.00 for the fish. About 10 1/2 cents per pound. No wonder Ogletree wanted to take them at 6 cents. The pompano market became glutted that late spring. To keep on making grits we caught 500 pounds of pompano for M. R. Johns, who paid us $10.00 as we caught the fish in two hauls in less than 3 hours, we were making many.
By 1901 seining was in full swing. There were 3 fish house on the river. In February 1901, a big run of sheepshead had come up the river, the writer was fishing gill nets, Gus Griffin, was our helper, that night the gill nets picked up 50,000 pounds of sheepshead, our boat had 5000 pounds. Charles Blakeslee and hid dad caught 48,000 in their seine haul at Rocky Point. Russian Ed got over 90,000 pounds at Sewall’s Point. The sheepshead were so thick and massed, that a man could have walked on them for a long distance. The sheepsheads will fight a net for a short while, but not as savage and massed as mullet. Two days after these catches the market broke. You could not sell sheepshead for anything.
In 1904 we had three fish houses on the River, and 15 seines running, fishing North and South Fork our main bay, Hogg’s Cove, the sandsprit and the Indian River at Bessey’s Cove. Fishing was good. In February, March and April, big schools of blues came up river to spawn and feed. The seines made big catches of blues. Our first Palmer-powered launches turned out for trawling caught big catches with two lines running. One hundred pound per hour trolling catch was common that spring per boat with one man.
Fall 1902 instead of fishing, a garden was started. Beans, tomatoes, squash were planted on about three acres, located from the east side of the Stuart Department Store to the east end of the Pressel Building, including Osceola Avenue, to near the Post Office, also Seminole Street. As the strong northers were hurting the growth of plants we had to put up a 10 foot high wind brake, getting edgings for same from the Dupont and Middleton Sawmill on the north side of the River, location was South of the Wiley Garage, this mill cut 25,000 square feet each day. The first vegetables planting paid expenses and some profit. Our pineapples were making money and carpenter work during winter months helped out. Prospects were grand. Everyone here was making money. One met none but smiling faces. Our banner crop of 1908 promised great returns, till the F. E. C. turned loose their Cuban Fruit Express. The operation of same has been explained in a former article. Christmas Eve 1909 brought a slight freeze and February 1910 brought a white frost. The writer with John Michelis as a partner and Jack Spiers had farmed at Cane Slough fall 1909 till mid June 1910. The Christmas cold killed our beans, four acres between the three February white frosts killed another four acres. In March, Johns and self had 1 1/4 acre of fine Irish potatoes ready to dry when a heavy rainfall flooded same, loss about $500.00. The three of us had 5, more acres of potatoes on the west side of Big Cane Slough, but same so planted later were badly damaged by the flood and brought only a few bushel large enough to sell locally. That season’s farming will never be forgotten. The writer had never handled teams or plows. Jack and John did our plowing, the three of us had bought a good big horse, “Jim.” as they did the plowing. Well they wished a bull and three oxen on me to do the disking. Oh boy, what a life! The two yokes pulling the disks moved about 1 1/2 miles per hour. As a short handled 10-foot whip went along, it took a very short time to learn how to flick a small piece of hide from the oxen. The bull when whipped, would stop, and the three oxen had to haul the disk and the bull. No more whipping the bull, but speed went down to about 1 mile per hour. On a Saturday night coming to town, saw my friend Pete Blakeslee and asked his advise about the bull — how to accelerate his movements. Well Pete laughed, said believe it or not, but try it, takes a small piece of board put it under the bulls tail take a piece of wood about 2 inches wide 4 to 6 inches long, use the edge of same and scrape the bull’s tail, but be sure you are free of whatever the bull is hitched too. Will next Monday while disking with the ox and bull team, when the bull — he belonged to Hans Olsen –got lazy, the board and scraper was tried. I am glad that Pete had advised to stand clear, as after about four scrapes, the bull tried to run away with the disk and oxen. Only one more scrape treatment was given after that, banging the two pieces of wood was enough to convince the bull it was time to work. Well, the best this ox and bull team would do was one-half acre in 10 hours. Rental for the ox and bull team was 40 quarts of sweet feed per day, also the rounding up of same every morning as these cattle were turned loose to graze. Well on the 8th day the writer went on a strike. No more oxen or bulls– too pay for work returned. We hired Byron Ball’s “Nellie,” a large black mare and with our “Jim” had a fine span of houses, turned out 1 1/2 acres and better per day of well disked land. Growing that year was jinxed: freeze out, frost out, drown out — after the water had run off, John agreed to go in with two acres of tomatoes. Picking out a piece of good prairie land, the writer did his first plowing and turned up two acres in two days. Luckily, Will Crews, had a very large seed bed of tomatoes, ready to plant. Well, we planted our tomatoes in the damp soil and with plenty of fertilizer they grew rapidly and in early May plenty of fruit had set. There was hope that we might retrieve some of our losses. Well you know, “Hope is eternal,” as May sped into June, hope was lost, as we did not have a drop of rain till near the end of June. Our tomatoes were looking fine and had plenty of fruit, but on account of the drought were too small to ship. We sold plenty of tomatoes locally at 10 cents per basket, shipped about 10 crates North.
Our pineapple crop that year was very small, no prospects of any work. Well, when we went out to Cane Slough in early November 1909, we had no debts, some cash money. Coming back we owed the Trueman Fertilizer Company 457 bucks. The feed fill at Parks’ $100.00, our grocery bill nearly $200.00 and we had done seven months of hard work, hours from daylight to dark. As we sold our team, the feed bill was paid, the pineapple crop helped to pay for some of the groceries. Well, things did not look rosy. Talking things over with the boys here, seine fishing was thought of the sinecure.
Well in 1910 it was against the law to seine as matters were grave, the writer went to West Palm Beach, to ask for help from the County Commissioners while in session. The help asked was to allow seining. As the County Commissioners had not made the law, they could not set same aside. Well, Capt. Baker, our first sheriff of Palm Beach County, was tackled, he was told that matters were really desperate. It was a matter of robbing a bank or breaking the law seining. Old Capt. shook his head, “Curt, if you rob a bank, I will put you in the pen, if you seine, well if I don’t see you, I can’t catch you.” Well this oracle was good enough.
With the exception of about 10 elderly men every male went a-seining. John Michaelis and self got an 800 yard used seine weak in spots, a round bottom seine boat with a 5 horse power Palmer and a large bateaux. Seining method had advanced, using 200 yards of 3/8 end-lines on each end of the net, the net was hauled ashore by one man windlass power and about 200 yards of each side of the half circle was hauled in by windlass, balance of 400 yards was hauled in by hand. Six months of fishing paid up the farming debt my share about $600. In the summer of 1910, the river was full of pompano, one thousand pound per single haul occurred often. One day in August, while laying out, our seine got around a school of pompano over on the sandsprit in front of Rio, as we reeled the net to shore the cork line in about the center broke in two and the web tore half way down. We tied the net back together — when the haul was finished we had 853 pounds of pompano. How many got away? Who knows? In September John and self ordered a new net and new lines, our lead lines now were double lines, to avoid the rolling of the seine when hauled in. We tarred one net and hung it. As part of the net was hauled by hand the lead line in an eight hundred yard seine was at least 60 feet shorter than the cork-line, object to form a slack in the web to kind of pocket the fish when pulled ashore — later regular pockets were knit into the bunt. About October John decided to go to West Palm Beach leaving me to look for a new partner. Well, my good friend Bill Baker wanted to try, we fished for two weeks, made about $15.00 between us in that time, one day in the second week we caught an eight pound loggerhead turtle, Bill said, “There is some fine meat. Let’s kill it, when we get home.” Well we got home, sometime, in 1909, while horse trading, the legislature enacted a law, declaring it illegal to kill loggerheads, or have their meat in possession. Knowing the law and also knowing that Bill Baker was our Justice of Peace, Bill was told if his kids needed meat, he was elected to decapitate said Loggerhead. The writer was willing to do the butchering. Well, we ate turtle meat for supper. Bill quit on Saturday night. Pete Blakeslee who had just returned from the nutmeg state was elected to jump in. In our first haul next Monday night we caught about 3000 pounds of mutton fish, snooks and some pompano at total of $35.00. We had made the bill haul, and after making same steady each day took out over $1000.00 in 6 weeks time. Who was jinxed in Bill’s time?
Through the years all obstructions: logs, brush, tree trunks had been hauled ashore. The river bed was cleared, there were a few places up the North Fork and in Hogg’s Cove where the bottom was muck which would foul the lead-line and pull the seine under. These spots were avoided.
When we started seining in July 1910 we started fishing at night, on account of the “no seine law” which Capt. Baker’s dictum had eased considerably. One night, going up the South Fork to make a haul, we came close to the shore near the junction of the North and Sough Forks, someone was hauling a seine there. The Next day we learned that Capt. Hansen with Jack Spiers and Cleve had been nearly caught fishing, when they saw our boat they had taken to the Palmettos believing the law had come for them. Talk about poetic justice, about three weeks later, the same thing happened, only this time John and the writer who melted soundlessly into the saw palmettos, and Jack, Cleve and Hansen had the laugh. After an hour of hiding we came out finished our haul, most the fish got away, we sold about $3.00 worth that night. The opening of the St. Lucie Canal brought great changes. The roiled water ran out all self respecting fish, the silt covered the large feeding places, and the continued fresh water killed the mussels, clams and oysters. During the years it changed the depth of our river. The North and South had an average depth of about 14 feet, our main bay 16 feet and better — figures set up by the 1895 Geodetic Survey of our Government. All these bodies have shallowed more than 4 feet. Most of the clear sand bottom is gone, now filled over with silt and muck. Fishing methods changed in former years it took two boats, power and bateaux, two good men could make two hauls a day an eight hundred yard seine using elbow grease and hand windlass. Now a different style of net is used, hung in reverse to the old customs, the lead line being about 100 foot longer than the cork line. Each crew has two heaving engines, hauling shorelines and net in by power, a seine crew now used 4 boats. The silt bottom changed the method of hauling. In former years the lead line at all times was ahead of the cork line. Now the lead line, weighted down with about 4 times the amount of lead used in former years, drags many feet behind the cork line. This kind of fishing today seems to be all fun and no work.
Seining laws have been enacted several time in the past 40 years. Many theories have been advanced pro and con. The earliest theory advanced was that seining would catch up all the fish and there would be none left to catch. I twice overheard conversations, when a big seine catch was brought in, a gill-net crew said, “It was no use to set the net that night as the damn seiner had caught all the fish in the river.” Another a few days later where a tourist made nearly the same remark. What a nonsense, what folly!
If our river was a closed body of water without ingress or egress to sea, these remarks would have been well founded, but with an inlet at the mouth of our river and more inlets within 20 miles each way, such remarks are more than foolish. Most of our fish varieties are migrating. Our pompano during a part of the year go as far as Africa, coming in from the sea in small schools on the November quarter moon, followed in December and January. When coming in from the sea, they are lean and silver white in color, within four weeks their bellies show a slight golden hue and in three months the fat set only the rich river-fed pompano shows golden color in two-thirds of their body. Pompano feed on small white-shelled clams. Far back in their mouth they have a “kind of nutcracker” with which they crack the clam shell. By the beginning of June the Pompano show roe. By August they have finished spawning. Blues, mackerel, trout and sheephead go north. Mutton fish and snooks, just as the mullets, go and come, many of them stay the year around. The Jew fish–large kind of bass– seems native, same as flounders. Sailor’s choice used to come in large schools and were regular on the first North Easters in September each year. The Gaff-top sail cat migrates and comes back in January and February. Tarpon come up in June to spawn. The young tarpon stay up river and can be found there in considerable schools. All kinds of fish return from October till March to spawn in our shallows. Seining is bringing in considerable amounts of “new” money from out of State. Seines seem to deplete, but at the same time destroys, thousand of game fish that would have devoured near the amounts caught in years to come.
Before the war, fish was a staple food for the poor. Now it seems only rich people can eat fish. Two years ago a three pound flounder was brought home cost, cleaned and dressed, ninety-five cents. Well, well, we used to get three cents for a three pound flounder. Have not had anymore flounders at my house since.
Seining keeps the river bottom clean and free of snags and stranded trees. It helps to mix the spawn dropped by the different varieties of fish. You may know that when fish spawn they go into shallow waters drop their spawn and roil the sand and water, that the commotion will mix the white milky spawn with the yellow roe–fish eggs. The seines hauling over the spawning grounds again stir water and sand and help to fruition much of the spawn that laid there sterile. Of course the haul has to be made within a few hours after the spawning. Mullet and Jack fish could be heard for miles over the river in calm nights while spawning.
Our first outrage against seining was the custom of the seine crew to ‘bail” the foul fish ashore, in the very early days there were few homes on the river but with the influx of people, more and more homes were built along our shores. Well you have heard of tourists. Have you heard of tourist buzzards? I mean the bird. Well, from 1901, for years, there were thousands of buzzards on our and the Indian River. They came in November and left in April. Tons of foul fish were dumped ashore daily. After the seine law in 1909, the buzzards stopped coming. It was common sight to see 100 to 200 buzzards run along the shore in one flock. In September 1917, Russian Ed caught a school of sailor’s choice on the Indian River, sold 50,000 pounds and let more than 100,000 pounds rot there, creating a stench that stayed there for many weeks.
Some of our masons belonging to the Chapter and Commadery at Fort Pierce, used to make weekly runs via Dixie to For Pierce and were near choked traversing that stench zone on the Indian River. We voted seining out that year. The fault that seining has been voted out time and again lies with the fisherman. In the years long ago, it was the dumping of foul fish that raised opposition, later there was “greediness.” by using smaller and smaller mesh in their bunts and pockets.
When we started seining, we used four-inch mesh on wings and three and one-half inch mesh in center. Two pound blues, trout and large mullet would gill, or rather “jam” and were caught. One and a half-pound fish would easily go through the mesh, occasionally we had a one and one-half pound trout or blue, bundled up with other fish but these were exceptions. Today with the small mesh, trout, blues mackerel, mullet and other fish are caught that weigh less than one pound. A two pound fish spawns and reproduces, a one pound fish is not developed for spawning and when caught cannot reproduce. Continued practice of this will help to lower reproduction. A sensible seine law should be passed allowing 800 yard seines, prescribing four-inch mesh wings and the bunt of 150 yards to be three and one-half inch mesh. The web hung four inches and three and one-half inches to each two meshes. This would give half grown fish a chance to find its way through the mesh. Any net with smaller mesh should be confiscated for good, burned or destroyed by rock line, so later legal tricks could not restore such net to some mysterious owner.
Laws of protection for spawning fish should be set out for each species. Fish are spawning the year around when one species finished another starts, etc. These laws would protect the fishermen and assure him and posterity of plenty of fish. Catching pompano of under one pound (in bygone years they brought one cent per pound) a wise fisherman should return these small pompano to the river as the hauling ashore does little harm to them.
But with the seine law, restrictions should be more stringent about gill nets in the forbidden zone of the inlet. Up to 1901 there were no restrictions about fishing in the or near the Inlet. John Michaelis and self fished partner boats with Captain John Houston and his brother, making our circles just outside the mouth of the inlet. Later when the Houstons returned to Eau Galie we fished with Phil O’Brien, and old Bank fisherman from Glouchester, Massachusetts. We saw after 1901 many a net drift end ways out of the Inlets, forbidden waters, then as today. In the old time we used two sets of ten-foot oars. Now power boats capable of making 20 m. p. h. fish these waters, use their bright spotlights to dazzle the fish and catch them easier than the old-timer ever dreamed of. It is not a common practice to fish the forbidden zone, but believe it is fished. This new power method turns many a fish back into sea, that would have come into the river.
Many of the fish here have different methods to evade capture, mullet and pompano will jump the cork line. A trout, watching the encroachment of the net, will back off, get his underfins busy, fan a hole into the sand, stick his snout into the hole and let the lead-line slip over his head and body. We never made big trout catches in the old days. The good old snook will stick his snout into a mesh open his jaws, get his two razor blades, located in front of the gills, busy and cut himself out. A mullet will jump to a light. In the old days it was easy to catch a mess of mullet at night. A lantern sat on the thwart would do the trick, but you sure had to douse the light quickly, as there were more than enough mullet around to sink the boat.
Neither seine nor gill nets have diminished our food-fish supply. The disregard, legal or illegal, of catching fish during spawning periods will make our returning schools of fish ever smaller.
As stated, the different times, each species of food fish should be protected by stringent Federal laws. We had a state mullet law, trying to protect that fine food fish for about 15 days each year. (Who laughed?) Well, our fine Indian River mullet are few and far between, in the 1890s they came in schools of millions.
Seine and gill net fishermen and their dealers should ask for decent laws, including closed seasons of at least 4 weeks for all salt-water food-fish, to protect this great industry that has brought many millions to our state. Get together, there is no use of the pot calling the kettle black.
It is a journey the state, federal, and local agencies don’t always wish to take–a journey to face the numbers of our watershed…
Today, Dr Gary Goforth (http://garygoforth.net) shares his most recent report, “Water Quality Assessment of the St Lucie River Watershed, For Water Year 2017, DRAFT.”
Mind you, for non-scientist people like myself, a “water year” is reported from May of one year, through April the next year, as opposed to a calendar year.
The full report is linked at the bottom of the post and contains numerous helpful charts. I have just included the key findings below.
Dr Goforth wanted to get the draft assessment out before the Florida Department of Environmental Protection’s Basin Management Action Plan workshop scheduled for this Friday Aug. 25th at 10:00 am at Martin County Building Permits Office, 900 Southeast Ruhnke Street, Stuart, FL 34994, Conference Rooms A & B because this is where the rubber hits the road! FDEP: (http://www.dep.state.fl.us/central/Home/Watershed/BMAP.htm)
Reflections in the St Lucie River, JTL
Water Quality Assessment of the St. Lucie River Watershed –Water Year 2017 – DRAFT Gary Goforth, P.E., Ph.D.
Quis custodiet ipsos custodes? (Who watches the Watchers?)
Key Findings:
1. Over the last water year (May 2016 – April 2017), the surface water entering the St. Lucie River and Estuary (SLRE) in general was of poor water quality. The best water quality entering the SLRE was from the highly urbanized Tidal Basins. The largest source of phosphorus, nitrogen and sediment pollution to the SLRE was Lake Okeechobee discharges. The C-44 Canal Basin contributed poor water quality, and was the only basin demonstrating a worsening in water quality over the last ten years.
2. It was estimated that stormwater runoff from agricultural land use contributed more flow and nutrient pollution than any other land use, even contributing more flow than Lake Okeechobee discharges.
3. The annual Basin Management Action Plan (BMAP) progress reports produced by the Florida Department of Environmental Protection continue to indicate water quality conditions in the tributaries of the SLRE are better than they actually are. Examples of flaws in the BMAP assessment process include the omission of Lake Okeechobee pollution loads, the use of simulated data instead of observed data, the inability to account for hydrologic variability, and the inability to assess individually each of the major basins contributing to the SLRE.
4. An alternative to the assessment approach presented in the BMAP progress reports was developed and used to evaluate water quality conditions of major inflows to the SLRE and to assess progress towards achieving the Total Maximum Daily Load (TMDL) load reduction goals. This alternative approach uses observed data, includes Lake discharges, accounts for hydrologic variability, and is applied to each of the major basins contributing pollution loads to the SLRE. For WY2017, observed nitrogen loads to the SLRE exceeded the Phase 1 BMAP target loads (adjusted for hydrologic variability) by 77 percent. Observed phosphorus loads exceeded the Phase 1 BMAP target loads (adjusted for hydrologic variability) by 53 percent.
5. The largest single source of total nitrogen, total phosphorus and sediment load to the SLRE was Lake Okeechobee discharges. In addition, total phosphorus concentrations in Lake Okeechobee discharges to the SLRE remained almost four times the lake’s TMDL in-lake target concentration of 40 parts per billion (ppb). In 2017, the South Florida Water Management District (SFWMD) reported that phosphorus loading to the lake from surrounding watersheds was almost 5 times the Lake’s TMDL of 105 metric tons, yet staff acknowledged the agency does not enforce permits that set numeric limits on phosphorus discharges to the lake[1] (SFWMD 2016, SFWMD 2017). Unfortunately, despite the continued and well-publicized pollution of the lake, the Florida legislature in 2016 enacted a water bill that pushed back deadlines for achieving the lake’s TMDL by decades (Ch. 2016-1).
6. The best water quality entering the SLRE during WY2017 was observed in the highly urbanized Tidal Basins, with concentrations of 97 ppb and 819 ppb for TP and TN, respectively. Each of the remaining source basins, except the C-44 Canal Basin[2], exhibited a slight improvement in nutrient levels compared to their base periods, however, collectively these WY2017 loads did not achieve the alternative BMAP Phase 1 load target (Figures ES-1 and ES-2). The C-23 and Tidal Basins met the alternative BMAP Phase 1 target for TP, while the C-23, C-24 and Tidal Basins met the alternative BMAP Phase 1 target for TN. The predominantly agricultural C-44 Canal Basin exhibited poor nutrient conditions, and in fact, continued a trend of deteriorating nutrient conditions compared to its 1996-2005 base period. As a whole, the water quality entering the SLRE remains poor, although a slight improvement over the 1996-2005 period was observed.
When I was a kid, I often walked to the Indian River Lagoon and just stood there in amazement watching the hundreds, if not thousands, of baby horseshoe crabs winding their way through the sands. They left circular trails, crossing over and over again…
Where were they going? What were they doing? Why were there so many?
Photo by Anthony J. Martin
Every once in a while, I would pick one up and place it carefully in the palm of my hand. Its sharp tail and prickly feet pushed against me. I watched in wonder at its strength as it bent in half. Once returned to the sand, the little crab went back to work immediately as if nothing had happened at all.
My mother had told me the horseshoe crabs were more ancient than the dinosaurs and had been here “forever.” “They are living fossils” she would say. “And they can live over 20 years and take 10 years just to mature.”
Although I picked them up with such care, today, forty years later, when I try to find them, they’re gone.
What happened to the horseshoe crabs of the Indian River Lagoon? How did a creature so ancient, resilient, and prevalent almost “disappear?”
Although there is quite a bit of literature on the Central Indian River Lagoon, I could not find much on the Southern Lagoon. Some of the best documentation came from Gretchen S. Ehlinger and Richard A. Tankersley. On line, they are cited multiple times for their paper “Reproductive Ecology of the American Horseshoe Crab, Limulus Polyphemus, in the Indian River Lagoon: An Overview.” I was also able to read “Evaluation of the Horseshoe Crab Fishery in the Indian River Lagoon Using Catch Data From Two Power Plants,” and a September 2014 “FPL Cape Canaveral Energy Center Horseshoe Crab Deterrent Fence Specifications” publication.
All of these lead to the following observations: decline of the species has been noted for around three decades. There have been UME’s or “Unexplained Mortality Events” where up to a 100,000 have died in the same area around the same time.
Factors that are related to their overall decline in the lagoon include intense coastal development, shoreline breeding grounds destruction, and unbridled human population growth; expansion of agriculture drainage watersheds into the IRL; deteriorating water quality; power plants sucking up as many as 100,000 a year into their intake canals; and over-fishing. The crabs are used as bait, collected for marine purposes, and more recently captured live and bled for their “blue-blood”that is invaluable to human health.
Unfortunately, for many years, the value and importance of the horseshoe crab was not recognized. For instance, Ehlinger and Tankersley note a one year study in the early 2000s at two Indian River Lagoon power plants that recorded a total of 39,097 crabs trapped on the intake screens at Cape Canaveral, and 53,121 at the Orland Utilities Plant. The scientists also mention a previous study from 1975 that estimated 69,662 at the Canaveral Plant, and 104,000 trapped annually at the Orlando Utilitility’s Indian River plant. “This alone could easily account for a decline in the Indian River population.” (Ehlinger and Tankersley 2007)
The St Lucie Power Plant located here in the southern lagoon did not agree to be part of the study and there is very little research one can now find on the subject.
In any case, the good news is that just recently the Cape Canaveral plant has installed a wall to protect the horseshoe crabs and science’s recognition of the species has people wanting them to come back.
The Florida Wildlife Commission notes:
“Horseshoe crabs are extremely important to the biomedical industry because their unique, copper-based blue blood contains a substance called “Limulus Amebocyte Lysate”, or “LAL”.This compound coagulates in the presence of small amounts of bacterial toxins and is used to test for sterility of medical equipment and virtually all injectable drugs. Anyone who has had an injection, vaccination, or surgery has benefitted from horseshoe crabs!”
…”in March 2000, a series of management measures for horseshoe crabs went into effect in Florida. The regulations required a license to harvest and set a limit on the number of animals each licensee could harvest per day (25 to 100 animals allowed per day per person depending on the permit). In 2002, a biomedical permitting rule created a mechanism to allow for biomedical collection.”
Yikes!
Horseshoe crabs being bled. Image as shared by FWC in 2017, first published in Popular Science.
Personally, looking at these photos of the horseshoe crabs being bled is like a science fiction movie to me. Never as a kid would I have imagined my little friends with needles in their heads being milked for their blood.
….But if this is what is going to save them… I must say, if they could talk, I bet now is the strangest part of their 450 million year journey. In my mind, they will always be free and drawing circles in the sand.
“Here is the basin right now. It may not be the blue-green algae but I am willing to bet it has some of the same properties that created the algae bloom.” —Mary Radabaugh, Central Marine
Central Marine…the epicenter for the St Lucie River’s “Algae Crisis of 2016.” More photographed than a movie star, the marina became home-base for reporters, politicians, as well as state and federal agencies. All witnessed something beyond human imagination. It is something we will never forget…
Mary and Dutch Radabaugh, who manage Central Marine, bravely and eloquently handled the situation, and kept working….
Mary became the spokesperson for Martin County on local, state, national, and international media. Her confident and calm southern manner gave stability when it was difficult to breathe.
Mary Radabaugh
This year, in 2017, Mary has remained low-key. Although the ACOE is not discharging Lake Okeechobee waters in to the St Lucie River, the marina definitely has been showing signs of a possible coming bloom…
The “circus” too fresh in Mary’s memory, she has not spoken, until now.
The photos below are Mary’s; they are dated. As one can see, although there is no blue-green algae visible, there are the signs. The signs we learned to recognize in 2016. The bubbles, the foam, the nutrient swirls of seeming organization…
So, with no dumping where are the nutrient bubbles coming from? These nutrients (phosphorus and nitrogen) are known side effects from years of careless agriculture and development—- that feed the “algae…”
Is it there from last year, or before? Is is rising from the putrid muck of the river where the blooms sunk and died only to rise again?
Most important. Is it now endemic to the system? Will it affect our health?
~Just to look and see if we could follow the bubble/foam for Mary, Ed and I flew on Sunday, July 30th, from the St Lucie Locks to the St Lucie Inlet. It was early morning, and the light was not great, but one could see the intermittent bubble swirls like a gigantic serpent to the Inlet. In the video they are most visible rounding the peninsula of Sewall’s Point.
Sewall’s Point is the peninsula and Sailfish Point is the ball like formation at the south end of Hutchinson Island (R) Atlantic on far R. (Google Maps 2013, another Lake O discharge year…)
Mary just happened to be at the Sandbar and St Lucie Inlet on Sunday, just off Sewall’s Point. She texted a photo and wrote:
“I really have a hard time watching people swim in the water when it is that gross brown color. I truly believe if they were dumping the lake right now we would be way worse than last year. This that we are seeing I believe is remnants of algae settled in our river bottom being churned up in combination with natural runoffs. Keep up the documentation so when they do decide they need to open them we can show it will be a catastrophe to human health.”
Mary’s photos of dark river water flowing out towards the St Lucie Inlet, July 30th, 2017:
June 19, Central Marine, Mary Radabaugh–list signs of water changes
Central Marine, June 19, 2017, Mary Radabaugh
Central Marine, June 29, 2017, Mary Radabaugh
Central Marine, June 30, 2017, Mary Radabaugh
Central Marine, June 30, 2017, Mary Radabaugh
Central Marine, July 10, 2017, Mary Radabaugh
Central Marine, July 10, 2017, Mary Radabaugh
Central Marine, July 10, 2017, Mary Radabaugh
Central Marine, July 17, 2017, Mary Radabaugh
Central Marine, July 17, 2017, Mary Radabaugh
Central Marine, July 17, 2017, Mary Radabaugh
Central Marine, July 25, 2017, Mary Radabaugh
Central Marine, July 27, 2017, Mary Radabaugh
Central Marine, July 10, 2017, Mary Radabaugh
Central Marine, July 10, 2017, Mary Radabaugh
Central Marine, July 28, 2017, Mary Radabaugh
Central Marine, July 28, 2017, Mary Radabaugh
Central Marine, July 28, 2017, Mary Radabaugh
Central Marine, July 28, 2017, Mary Radabaugh
Central Marine, July 28, 2017, Mary Radabaugh
Central Marine, July 28, 2017, Mary Radabaugh
Central Marine, JTL
Ed & Jacqui’s Flight from the St Lucie Locks and Dam to the St Lucie Inlet, July 30, 2017. “Chasing nutrient bubble/foam swirls….precursors to blooms?”
Ed, my husband, and Todd my brother, algae hunters! The Cub.
The Baron, Todd and Ed. All of Todd’s photos are linked at the bottom of this post.
On Saturday, my husband, Ed, took my brother, Todd, up in both the Cub and the Baron to look for a the large algae bloom Ed and I had seen last Wednesday in Lake Okeechobee. I went along for the Baron ride, but the Cub only holds two.
Maybe you, like me, after listening to the news the past few days, realized there were other blooms reported, even a “small one” in Pahokee on May 20th by famed biologist Barry Rosen, of USGA. I wondered if Todd and Ed would see more blooms, other blooms…
Saturday, July 22, 2017, was much more overcast than the previous Wednesday, so the lake photos Todd took are not as bright in color, but the “southwest of Port Mayaca” bloom is definitely still there. Todd did not report any others during the trip and the GPS track shows that he and Ed went quite far north and west. (Channel 12 reported on two blooms on Lake O’s western shore…)
Before the flight, Todd also shared the most recent Landsat 8 satellite image that shows where the large “southwest of Port Mayaca” bloom is located although here too, there are a lot of clouds blocking the image…
Approaching Lake O with widespread cloud cover.
After Wednesday’ s post, many were asking me if there were visible blooms in the St Lucie River or C-44 Canal.
The answer: “No.” From 1000 feet up, there are none visible. But there are the “bubble like nutrient swirls” that seem to proceed the blooms in some areas. (You’ll notice these in Todd’s photos and all 350+ photos are linked at end of post.)
I did notice that on Facebook a small bloom was reported at Rivers’ Landing in Palm City, and another one on rocks in the North Fork. The Caloosahatchee has indeed reported a pretty significant bloom…blooms are in the estuaries but the motherload is Lake O.
Have you seen any blooms? If so, here is the link to report algae blooms to the Department of Environmental Protection, “DEP.”
I happened to notice when I visited the DEP website that DEP states: “Blooms are naturally occurring.”
…Yes this is true; so is cancer.
However, nutrient pollution that feeds these algae blooms and is killing our estuaries, and possibly us, is entirely man-made. We know what causes it.
We must be more diligent and creative in stopping the nutrient run of from agriculture and development. “Taking measures”as noted in the DEP quote as the game plan just isn’t enough. After all, this is a war to save our Florida.
Florida’s five water managements districts map DEP.
“There are no short term solutions to rectifying the situation; this is a naturally occurring phenomenon that the State monitors closely. However, the state is taking measures that in the long-term will reduce nutrient loading and improve water quality.” DEP, 2017 website
South Fork that connects to C-44 and then Lake O at Port Mayaca, near Palm City; following photos just going west towards Lake Okeechobee. Notice the bubble trails.
Rowers near Palm City
American Yachts and 195 overpass is near where C-44 connects to South Fork of St Lucie River
S-80 where area basin water is allowed into South Fork of St Lucie as well as water from Lake O if S-308 is open at Port Mayaca
Part of C-44 Reservoir project, the biggest in the state, to hold area basin water, clean and return to C-44.
Water and sediment leaving ag canals entering C-44 canal
Indiantown area and C-44.
FPL cooling pond. This area was once a cypress tree forest
Port Mayaca’s S-308 at Lake Okeechobee
C-44 is “running backwards” into Lake O right now, dark color is visible
Algae is present south west of Port Mayaca but not as bright on this cloudy day…
S-308
Lake O southwest of Port Mayaca
S-308 looking east from LakeO
the northwestern shoreline
S-308 with C-44 area basin waters going into lake. Usually these waters flow into C-44 and the SLR
Northwestern shoreline
Water in northwest
Photo in 2nd plane, the Baron. I went along for this one as you can get a more overall view…
Again algae present in Lake O southwest waters but not as intense as seen in blog photos I published four days prior as this day was cloudy and there was little sunlight.
My brother noted the algae around the Okeechobee Waterway canal cut into the lake. Interesting!
The water flowing backwards from C-44 area basin is certainly one of the things fouling Lake Okeechobee.
2. This 1995-2005 map shows phosphorus loads to lake and SRL for that time. (SFWMD)
My husband and I have decided we are algae hunters…
Hello Readers. Hope you are having a good summer!
Even though I am supposed to be on a “blogcation,” my husband, Ed, and I decided to fly over Lake Okeechobee this morning as yesterday Dr Susan Gray of the South Florida Water Management District reported on the Army Corp of Engineer Periodic Scientist Call that recent Landsat Satellite images had revealed significant algae in the middle of the lake- – – an area known as “LZ40.”
Sure enough, once Ed and I got up in the air, just a few miles west of Port Mayaca, the strings of bright green algae were visible from about 1000 feet —-looking down— up to as far as eye could see…
Very strange to be surrounded by water and bright-colored lines of algae; it resembled miles of suspended fluorescent paint. I have heard the scientists talking about how the algae comes up in the morning for sunlight and then goes back down into the water column later in the day. It is intelligent, like an animal, and knows how to hide. You have to track it….
The living bloom was quite extensive, going on for many miles. My photos do not do the color or amount justice, but do document. This is important.
Thank God the ACOE is not dumping into the St Lucie River/Indian River Lagoon this summer. Poor lake O, on the other hand, has been getting “backwards flowing” C-44 water and back-pumped water from the EAA, STAs, and WCAs. No wonder its a mess!
Thank you to the SFWMD for the heads up! We do appreciate your work. We have inherited and created “quite an animal.”
*Reader, Professor Geoff Norris recommends we ask NOAA to create a bulletin for Lake O like this one here for Lake Erie since basically we are “in the same boat:” I think this is a great idea. I will have to contact NOAA.
I wanted to personally thank the South Florida Water Management District for their awesome new website “Everglades Agricultural Area Reservoir Project, A Timeline Toward More Water Storage South of Lake Okeechobee” that tracks Senate Bill 10 and the EAA Reservoir’s progress. I saw many people Tweet and post on this wonderful new tool, and wanted to share also and say THANK YOU!
6-28-17 JTL
_____________________________________
Note below from District, what a nice gesture!
Jacqui:
Hello, I’m not sure we have ever been formally introduced. My name is Jerry Eisenband and I’m the Comms Director at the SFWMD.
I was on your website the other day and saw this posting about SFWMD deadlines in relation to the EAA Reservoir.
I wanted to reach out and make sure you saw our latest and greatest webpage dedicated to this exact topic. Our goal is to keep the public informed.
I hope you like this website and encourage your followers to utilize it. If you can give us any help to promote it, we would be extremely grateful.
West Palm Beach, FL – The South Florida Water Management District (SFWMD) today launched a new webpage, featuring an interactive map and milestone tracker to allow the public to follow the progress of the Everglades Agricultural Area Reservoir south of Lake Okeechobee.
“This project was approved by the Florida Legislature and signed into law by Gov. Rick Scott, as part of an effort to reduce harmful Lake Okeechobee discharges to the Caloosahatchee and St. Lucie estuaries,” said SFWMD Governing Board Chairman Dan O’Keefe. “This new web page allows citizens to see how their tax dollars are being spent on this project, as well as track the progress of this reservoir.”
The Water Resources Law of 2017 — Senate Bill 10 — calls for SFWMD to construct a reservoir that can hold 240,000 acre-feet of water on about 18,000 acres of state-owned land in the Everglades Agricultural Area (EAA) south of the lake. This property was originally purchased with the intention of building a shallow Flow Equalization Basin (FEB), which would have been known as the A-2 FEB.
The project was included in the Comprehensive Everglades Restoration Plan, as well as Central Everglades Planning Project to improve the conveyance of water south from the lake to Everglades National Park. Instead, the land will now be used to build the much deeper 240,000-acre foot reservoir. The EAA Reservoir is intended to help reduce damaging estuary discharges from the lake.
The web page displays to the public where the reservoir will be located, what steps required by the Legislature have already been completed and what key points remain. To date, SFWMD has identified the approximately 3,200 acres of land it owns (currently leasing to private entities) that would be used for the project and about 500 acres of privately owned land that would need to be acquired. SFWMD has already contacted the private landowners to express interest in acquiring their property.
By July 1, SFWMD will take the next step by sending a letter to the U.S. Army Corps of Engineers requesting that the Corps develop with SFWMD a “Post Authorization Change Report” to the project for approval by the U.S. Congress. This is necessary since the land was originally slated to be used as part of the Congressionally-approved Central Everglades Planning Project.
In recent years we along the St Lucie River/Indian River Lagoon have been screaming because the ACOE and SFWMD have been discharging water from Lake Okeechobee and the C-44 basin into our waterways causing destructive toxic algae blooms and other issues to our area …
This year some are screaming because C-44 basin runoff water in southern Martin County is being pumped back into Lake Okeechobee. Yes, C-44 is “running backwards.” It’s a crazy world here in South Florida even through the water managers are working hard at “getting the water right…”
So two odd things are going on right now. First, water is being sent into Lake O from the C-44 canal as we were in a long-time drought, and also, now, water is being back-pumped into the lake from the south to help alleviate flooding in the Water Conservation Areas— as it has rained so much recently “down there.” This whole situation is exacerbated because the EAA, in the middle, “is kept dry to protect the property of the agricultural industry and safety of communities south of the dike.”
SLR basins. C-44 and surrounding man-made basin is in pink. This is the area that is being back pumped into Lake O as the lake has been low due to drought. But area rains in southern Water Conservation Areas are so full water “cannot be sent south…” South Florida Conundrum…SFMWD, 2017.The graph and short write-up below are from friend and engineer Dr Gary Goforth. The graph “shows” the C-44 basin runoff (see image above) being sent to Lake Okeechobee in 2017 compared to other years since 1980 (other than ’81) “is at 100%.”
I have also included some articles and images on the other “back into Lake O” subject. Back-pumping was made illegal in the 1990s, but is allowed under certain circumstances such as endangering communities and agriculture in the EAA, and danger to wildlife in the conservation areas due to flooding…All of this is “back-pumping” not good for the health of the lake. In all cases, it is helping one thing while hurting another…
One day we will have to truly get the water right. Images below may help explain things.
ISSUE OF BACK-PUMPING:
This satellite photo shows water on lands in 2005. One can see the lands in the EAA are devoid of water. This water has been pumped off the lands into the Water Conservation Areas, sometimes back pumped into the lake, and also stored in other canals. *This slide is similar to what is going on today in June of 2017. Wildlife is drowning in the Water Conservation Areas (south of EAA) while the Everglades Agricultural Area is pumped dry to protect agriculture. (just south Lake O) Crazy. (Captiva Conservation 2005.)ISSUE OF C-44 CANAL BASIN WATER BEING SENT INTO LAKE O RAHTER THAN TO SLR:
” For the period 1980-2016, about 32% of the C-44 Basin runoff was sent to the Lake, while 68% was sent to the St. Lucie River and Estuary. Historically (i.e., before 1923) virtually none of the C-44 Basin runoff went to the St. Lucie River and Estuary: some went to the Lake, some went to the Loxahatchee River and some went north to the St. John’s River. So far in 2017, virtually all of the basin runoff has been sent to the Lake.”
The following is a handout Mark Perry of Florida Oceanographic passed out yesterday at the Rivers Coalition meeting. It is created by John Ullman of the Florida Sierra Club and gives clear presentation on what is necessary for the EAA Reservoir and SB10’s success. I am reprinting here as a resource and reference. Getting the legislation passed for Senate Bil 10 was just the beginning. As we know, for the reservoir to come to fruition we must be diligent over the coming years.
Notice the July 1st, 2017 deadline for the SFWMD to”request that the US Army Corps jointly develop a post-authorization change report for the Central Everglades Planning Project to revise the A-2 parcel element of the project.”
Relationships with the District continue to be strained; a nice phone call or email to Executive Director Peter Antonacci or board member would prove helpful. We must rebuild relationships for future success. We all do have a common goal, clean water for Florida.
SIERRA CLUB, FLORIDA’S SB10 Blog-by John Ullman
SB10, Important Deadlines:
By July 1, 2017 SFWMD must request that the US Army Corps jointly develop a post-authorization change report for the Central Everglades Planning Project to revise the A-2 parcel element of the project.
By July 31, 2017, SFWMD must contact the lessors and landowners of 3,200 acres of state-owned land and 500 acres of privately-owned land just west of the A-2 parcel. SFWMD must express interest in acquiring this land through purchase, exchange, or terminating leases.
If the US Army Corps agrees to begin developing the post-authorization report, work on the report must begin by August 1, 2017.
SFWMD must report the status of the post-authorization change report to Fla Legislature by January 9, 2018.
SFWMD and Corps must submit the post-authorization change report to Congress by October 1, 2018.*
The House passed the measure with a 99-19 vote; the Senate passed it 33-0.
The Governor signed SB 10 into law on May 9, 2017
Details of SB 10:
• Accelerates the state’s 20-year goal of storing water south of Lake Okeechobee.
• Requires SFWMD to develop a project plan for an Everglades Agricultural Area (EAA) Reservoir that provides at least 240,000 acre-feet (about 78 billion gallons) of water storage by utilizing the A-2 parcel (14,000 acres of state-owned land), land swaps, early termination of leases, and land acquisition.
• Provides for at least two-thirds of the water storage capacity of the Comprehensive Everglades Restoration Plan (CERP) Component G.
• Allows the A-1 parcel to remain a Flow Equalization Basin (FEB) as provided for in the Central Everglades Planning Project (CEPP), or to be utilized for the EAA Reservoir if SFWMD can provide for at least 360,000 acre-feet of water storage.
• Requires SFWMD to include increased canal conveyance improvements, if needed, and features to meet water quality standards in the EAA Reservoir project.
• Provides deadlines for submitting the plan to Congress as a post-authorization change report, which will seek approval of the use of the A-2 parcel in a different manner than was authorized in CEPP.
• If the Corps has not approved the post-authorization change report and submitted it to Congress by October 1, 2018 or the post-authorization change report is not approved by Congress by December 31, 2019, SFWMD must request the Corps to develop a project implementation report for the EAA Reservoir Project located somewhere else.
• Prohibits the use of eminent domain to obtain privately held land.
• Provides for termination of the U.S. Sugar option agreement prior to the October 2020 expiration date if the post-authorization change report receives congressional approval or SFWMD certifies to the Board of Trustees of the Internal Improvement Trust Fund, the President of the Senate, and the Speaker of the House that acquisition of the land necessary for the EAA reservoir project has been completed.
• Authorizes the use of Florida Forever bonds in an amount of up to $800 million for the costs of land acquisition, planning and construction of the EAA reservoir project.
• Appropriates $30 million from the Land Acquisition Trust Fund (LATF) to the Everglades Trust Fund, in the 2017-18 fiscal year, for the purposes of acquiring land or negotiating leases to implement or for planning or construction of the Everglades Agricultural Area reservoir project.
• Appropriates $3 million from the LATF to the Everglades Trust Fund in the 2017-18 fiscal year for the development of the CEPP post-authorization change report.
• Amends the LATF distribution to include $64 million of additional funding for the EAA reservoir project.
• Appropriates $30 million from the General Revenue Trust Fund to the Water Protection and Sustainability Program Trust Fund to provide a loan for implementation of Phase I of the C-51 reservoir project.
• Appropriates $1 million from the LATF to the Everglades Trust Fund in the 2017-18 fiscal year for the purpose of negotiating Phase II of the C-51 reservoir and provides the LATF as a potential funding source for the implementation of Phase II of the C-51 reservoir.
• Creates the water storage facility revolving loan fund and requires the Department of Environmental Protection (DEP) to adopt rules for its implementation.
• Creates the Everglades Restoration Agricultural Community Employment Training Program within the Department of Economic Opportunity (DEO) to provide grants to stimulate and support training and employment programs that seek to re-train and employ displaced agricultural workers.
• Requires SFWMD to give preferential hiring treatment to displaced agricultural workers, consistent with their qualifications and abilities, for construction and operation of the EAA reservoir project.
• Terminates the inmate labor work program on state-owned lands in the EAA.
The post-authorization change report must be approved by Congress by December 1, 2019.*
*If these two deadlines are not met (and no extension is granted), then the SFWMD must request that the Corps initiate the planning for the EAA Reservoir project that will result in a new Project Implementation Report (PIR) and may continue to build CEPP components as planned in the 2014 PIR.
There is incredible footage of the 2016 toxic algae event caused primarily by forced discharges by the ACOE and SFWMD from Lake Okeechobee into the estuaries, St Lucie and Caloosahatchee. South Florida locals such as Mary Radabaugh, Dr Edie Widder, Dr Brian LaPointe, Mark Perry, Phil Norman, Dr Larry Brand, Dr Steve Davis, and Col. Jennifer Reynolds are prominently featured. Edie Widder’s political commentary at the end is priceless.
CHANGING SEAS Toxic Algae: Complex Sources and Solutions. Aired: 06/21/2017
Water releases from Lake Okeechobee periodically create putrid mats of blue-green algae. Scientists think water pollution is to blame, and if something isn’t done about it there could be irreparable damage to the environment, the local economy and people’s health.
You can Like Changing Seas on Facebook and attend their DIVE IN Summer series on this topic June 28th, 2017. See link:
Poppleton Creek and St Lucie River, April 17, 1952, courtesy archives Sandra Henderson Thurlow.
This remarkable 1952 historic aerial photograph shows Poppleton Creek and what were once pioneer Hubert Bessey’s lands near Downtown Stuart. Within the bucolic photograph early stages of C-23’s white sands, as seen piled on the land in the upper right hand corner of the photograph, foreshadow the river’s future. This canal divides Martin and St Lucie County and is considered the “most polluting,” excluding C-44 when open for Lake Okeechobee.
Looking across the beautiful St Lucie River we see in the distance the virgin pinelands and wetlands of parts of today’s Palm City. Interestingly, if one continues west one will stumble upon the proposed lands to be developed by the Kiplinger Family, Pineland Prairie.
Go west young man, go west?
Time shall tell…
If we do, we may have more regard for the land than we did in 1952 and bring relief to the river that brought development and love of our area here in the first place.
You can use Poppleton Creek on the right as a reference point, Google Earth 2017
I am adding additional photos to this blog post for reference to questions posed. The Fairchild photos below are dated 1925 and in them you can see the white sands of the C-44 piled on the land connecting to the South Fork of the St Lucie River. The C-44 canal was built between 1915 and is documented to have opened in 1923. Dates vary by a few years depending on sources and it too was enlarged/deepened in the 40s and thereafter.
“What is that huge white stripe on the horizon??” I said. It’s looks like a giant 20-mile-long spaceship runway.
Well, it’s the spoil from the freshly-dug Okeechobee waterway. See it in the attached comparison from Google Earth.” Todd Thurlow
1925 Fairchild aerial, note white sands from C-44 canal in upper right area of photo. (Courtesy Thurlow Archives)
Another perspective showing white sands more clearly of C-44 canal linking with South Fork of St Lucie River.
My brother Todd’s Google Earth comparison showing C-44 and South Fork today. (Google/Todd Thurlow)
TCPalm’s Elliott Jones reported this morning that Stuart has received a whopping 11.30 inches of rain just so far this month! (The average being 7.14.)
Although due to the recent drought, the ACOE/SFWMD are not dumping Lake Okeechobee through Canal C-44, canals C-23, C-24, C-25, and areas along C-44, as well as our own basin, are draining right into the St Lucie River/Indian River Lagoon. Very little of this water is cleansed before it enters and thus is damaging to the eco system. Next time you see water draining through a grate in a parking lot, think about this. Remember too that before the major canals were constructed the 1900s, the river received less than half the water it gets every time it rains today.
SLR at “Hell’s Gate” looking at Sewall’s Point, Sailfish Point and the St Luice Inlet
Drainage changes to the SLR. Green is the original watershed. Yellow and pink have been added since ca.1920. (St Lucie River Initiative’s Report to Congress 1994.)
The aerials below were taken 6-13-17 by my husband Ed Lippisch and pilot Dave Stone. It is important to monitor the river all of the time so we can view changes.
“Rain stained” we are; please remember not to fertilize during the rainy season. The birds on Bird Island will appreciate it! (http://befloridian.org)
TC Palm, Elliott Jones, 6-19-17
Bird Island, IRL east of Sewall’s Point
Bird Island
IRL St Lucie Inlet and Sailfish Point
Sailfish Flats, IRL
Crossroads, confluence SLR/IRL off Sewall’s Point
Spoil Island off Sailfish, bird also roosting here!
Sick looking seagrass beds in IRL looking south towards Jupiter Narrows
“
“
SL Inlet near Sailfish Point, no black plume but darker colored waters
Jupiter Island’s state park at St Lucie Inlet
Sailfish Point
St Lucie Inlet looking south
inlet again
Clear ocean water at jetty, St Lucie Inlet
Looking back to St Lucie Inlet mixed colored waters but not black as with Lake O water releases
St Lucie Inlet between Jupiter Island’s state park and Sailfish Point
inlet again
Looking north to SL Inlet
Jetty
Hutchinson Island and Sailfish Flats in IRL. Sewall’s Point in distance.
Parts of the Savannas near Jensen , IRL and Hutchinson Island in distance
Savannas State Preserve Park
Canals draining water into SLR/IRL after rain events:
My brother, Todd, wrote to me on June 8th noting that the C-44 canal was flowing westwards into Lake Okeechobee rather than dumping eastwards into the St Lucie as is standard operating procedure after a big rain…
Yes this canal, as most of the others, can “flow” in either direction, seemly “backwards.”
So how can this happen? This backwards flow?
Dr Gary Goforth says the following:
“Yes this is normal operations; generally when the Lake level is below 14 ft the Corps leaves the locks at S-308 wide open which allows any local runoff to flow into the lake.”
Another way Lake Okeechobee can receive water in an unusual way is if the water is pumped into it–back pumped. This has recently been done from the EAA. Back pumping into Lake O has been outlawed, but it is allowed if communities or farmland would flood.
According to an exchange yesterday on Facebook, with Audubon’s Dr Paul Grey:
“St Lucie (C-44) backflows are just one of many southern inflows now, S-2 is backpumping, three other southern outlets are flowing backward into the low lake (L-8, S354, S-352) the Caloosahatchee was backflowing but appears equalized today. More water is flowing into the lake from downstream areas than upstream right now. Not the end of the world but not desirable either, it is very polluted water. http://w3.saj.usace.army.mil/h2o/reports/r-oke.html “
When I asked Dr Grey if this was being done to gather water in the lake as we’ve recently been in a drought, or to keep the farmlands in the EAA and surrounding areas dry, this was his response:
“Both, they want to fill the lake this summer, and so do I, in concept, but much of this backpumping and flowing is because the farmers have been pumping water so rapdily off their own lands they have made the canals too deep, and risk fooding the communities. And rather than tell the farmers the canal its too deep and they have to modererate their pumping, the SFWMD backpumps/flow it to the lake.”
In any case, when I visited yesterday during my trip to Belle Glade, S-308 was closed at Port Mayaca and no more water was entering Lake O from C-44. I’m not sure about S-2.
The water looks dark and full of sediment. The once beautiful beach is full of gritty rocks. Maybe the lake is healthy in the shallows south, near the islands, but by Port Mayaca it looks terrible. Algae has been reported by S-308 a few weeks ago according to a report from Martin County at the River’s Coalition meeting. But thankfully there is not algae reported in C-44 right now.
We have really made a mess of it. For our rivers and for Lake Okeechobee, the reservoir must be built and we must continue to advocate for sending cleaned water south and re -plumb this outdated system. Forward flow or backwards flow, just say NO.
6-13-17 JTL
____________________________________
Todd Thurlow notes 6-8-17
Jacqui,
Interesting note: if this data is correct, C-44 has poured 10.7 billion gallons (aka 13.82 Stuart Feet) of water into Lake Okeechobee in the last three days. With all the recent “local” runoff into the canal, they have opened S-308, sending the water west to the Lake to help get the low lake level up.
48.5 million gallons passed through S-80 to the St. Lucie on June 5th…
“Eden,” the name says it all. Wouldn’t it be cool to say you lived in Eden?
Today there is a historic sign, but there is no longer a town. In 1879 “Eden” was named by Captain Thomas E. Richards who decided this spot along the high ridge of the Indian River would be a good place to grow pineapples. According to historian, Sandra Henderson Thurlow, “Richards felt he had arrived in a tropical paradise, and named his new home Eden.”
In Sandra’s book, “Historic Jensen and Eden on Florida’s Indian River,” she talks about how today’s Jensen Beach evolved from both the historic communities of Eden and Jensen, but over time, while Jensen had room to grow, Eden faded, as it was hemmed in by the wet, fragile ecosystem of the savannas. This marshy savannas system once stretched along the lagoon for over a hundred miles, but today, the only remnant lies right behind the lost town of Eden, and to the north and south of close-by extending lands.
This very special photo was given to my mother, historical Sandra Henderson Thurlow, by Capt. Thomas Richards’s great-granddaughter, Mary Simon.
The town of Eden was located between the IRL and the wet savannas, Ruhnke/Thurlow Collection. “Historic Eden and Jensen on Florida’s Indian River,” by Sandra Henderson Thurlow.
These rare lands known today as Savannas Preserve State Park, “encompass more than 5,400 acres and stretch more the ten miles from Jensen Beach to Ft Pierce containing the largest, most ecologically intact stretch of freshwater marsh in southeast Florida.” Remarkable!
If you haven’t ever seen it, I can promise, “Eden awaits you…”
This past weekend, my husband Ed and I put on our wet weather gear, and walked from Jensen Beach Blvd to “west of Eden. ” It is amazing to have this treasure right in our own backyards, a study in plant and animal life that “used to be.” ~A study in what we can bring back, if we want to…
Historic postcard, St Lucie River looking from “Dudley’s,” today’s Palm City, near Sandhill Cove, across the river to Stuart, undated. Courtesy, Sandra Henderson Thurlow.
In this historic postcard we see many things that today we often do not see: a well dressed man in a hat; women also with lavish hats and donning long dresses; tall grasses along the shoreline; and an extensive pine forest across the St Lucie River…
Martin County, like most of Florida was once a giant forest. Logging companies harvested much of the area starting in the mid 1800s. We can only really guess what it looked like, and only imagine what the world was like for the animals and native peoples that lived under its cover.
Harshberger vegetation map 1913.
The famous Harshberger vegetation map of 1913 gives us an idea of what Martin County would have looked like, noting mostly pine forests of Caribbean and Sand Pine, but other plant communities near the St Lucie River would have included: beach; strand; tropical hammock; mangroves; low hammock; scrub; dry prairie; wet prairie; pine flat woods; swamp and marsh. The United States woodland density map of 1873 shows Florida to be one of the greenest areas of the continent having had the most trees. Wouldn’t that have been something to see!
Woodland density map 1873, William H. Brewer.
We cannot return the forests, but we can choose what plants and trees to put in our yards. The business of landscaping has us in a cycle of turf, fertilizing, pesticides, and often bushes and trees that don’t really “go” here.
One way to help the St Lucie River is to take into our own hands what we plant in our yards. This can take time and that’s part of the fun of it. Creating a Florida Friendly yard using a mixture of native and Florida tolerant plants, less turf, requiring fewer chemicals and maintenance really does help. What if everyone did it?
When you drive across the bridge, or look across the river, or look at your yard, just for fun, ask yourself: “What would have been here, what would have been naturally beautiful, what would have attracted wildlife one hundred years ago?”….and then if you feel like it–recreate!
A photo from DEP showing a yard along the North Fork of the SLR. In instances like this it is easy to see the negative effects of fertilizer runoff in river from a yard that is mostly turf grass. A better choice would be like the image below.
Cover to ACLU report, “Tainted Waters,” by John Lantigua, released 6-7-17.
Civil Lib·er·ty/(definition) noun “the state of being subject only to laws established for the good of the community, especially with regard to freedom of action and speech. individual rights protected by law from unjust governmental or other interference.”
Today I am sharing a report that came out only yesterday and is spreading through social media and news channels like ~ toxic algae…
“Tainted Waters, Threats to Public Health, and People’s Right to Know” is written by award-winning journalist and ACLU investigative reporter, John Lantigua.
After being contacted, Mr Lantigua approached me and many others months ago, traveling and interviewing numerous stakeholders from various backgrounds. He was a consummate professional with an air that only an experienced, savvy, and hard-hitting journalist can attain. I will never forget being interviewed by him at a diner in Belle Glade and saying to myself: “Holy cow, this is the real deal…”
In today’s TCPalm article by Tyler Treadway, Mr Lantigua states: “We don’t typically focus on environmental concerns but getting timely and trustworthy information about a public health issue is a civil right…”
Thank you Mr Lantigua for recognizing the “lack of urgency and transparency” on the part of the state of Florida in reporting information about the 2016 Toxic Algae Crisis caused by the Army Corp of Engineers and South Florida Water Management Districts’ releases of tainted waters from Lake Okeechobee into our St Lucie River/Indian River Lagoon.
Reporter, John Lantigua, 2017.
ACCESS REPORT “Tainted Waters, Threats to Public Health, and the People’s Right to Know,”HERE:
IRL in Jensen, ca. 1948 Seymour Gideon property, courtesy Sandra Henderson Thurlow Archives. (Note clear water and abundant seagrasses.)
This photo is on page 23 of my mother’s book Historic Jensen and Eden on Florida’s Indian River. The insert reads:
“This photograph of the Seymour Gideon property was made after 1948 when Arthur Ruhnke started taking photographs locally, and before the August 26th 1949 hurricane that destroyed the fish houses. A trail leads to the ridge called “Mt. Washington” (Killer Hill, Skyline Drive today) by the pioneers. The watery expanses of the Jensen Savannas are in the distance. Notice the clear water and the abundance of river grass.” (Thurlow/Ruhnke Collection)
It is a beautiful photograph….isn’t it? Certainly after the Hurricane of ’49 hit the seagrasses of Jensen in the Indian River Lagoon were impacted too!
~Wind gusts reached 160 mph (260 km/h) at Stuart.
~Stuart (Jensen) experienced the most severe damage from the storm in south Florida; hundreds of homes, apartment buildings, stores, and warehouse buildings lost roofs and windows. Interior furnishings were blown through broken glass into the streets.
When hurricanes Frances and Jeanne hit within three weeks apart in 2004, entering both times at my hometown of Sewall’s Point, there was reported loss not only of property, but also of seagrasses in the Indian River Lagoon. Seagrass is very slow to recover…
Photo by Lauren Hall, SJRWMD, showing healthy seagrasses in the IRL. (From Save the Manatee Website)
As some locations of the grasses were experiencing recovery, they died back again due to the extreme discharges and toxic algae blooms in 2013 and 2016 ~linked to Lake Okeechobee, and canals C-44, as well as C-23, C-24 and C-25.
Canal and basin map SLR/IRL. (Public)
The South Florida Water Management District reports periodically on not overall numbers but rather “patch dynamics” at certain locations of the lagoon. (For Martin County: Boy Scout Island and Willoughby Creek.) I feel this is limited. The best way to see seagrass bed coverage is from the air. I am hoping in the future there will be money in the budget or the District could coordinate with local pilot for aerial seagrass surveys. Another way to approach this is though Google Earth mapping/aerials, and my brother Todd Thurlow and Mark Perry of Florida Oceanographic are working on this now.
Hurricanes, discharges, fertilizer from our yards…Seagrasses are as important as property as they are the nurseries of the oceans and keep the lagoon “living.” Look at the aerials below to see the losses, so that we may be inspired to work for and better document a recovery.
Jacqui
Frances, September 4, and 5th 2004. NOAA image.
Aerial of seagrasses in 1977 in and between Sailfish and Sewall’s Point, courtesy FOS, Chris Perry.
Murky greenish water could be seen in the area of the Sandbar, between Sailfish and Sewall’s Point, and some remaining sickly looking seagrass beds were visible, 3-15. (Photo JTL.)
5-25-16 remaining seagrasses with algae on top SLR/IRL between Sewall’s and Sailfish Point, JTL
5-7-17 blue water but no visible seagrasses between Sailfish and Sewall’s Point, JTL SLR/IRL
Waters off of Sewall’s Point in August 2013 during high levels of discharges from Lake Okeechobee. Seagrass beds between Sewall’s and Sailfish Point used to be the lushest in the southern lagoon…(photo, JTL)
Ariel 1925, SLR/IRL courtesy Archives of Sandra Thurlow as shared by Higgins Engineering WPB.
I have shared this 1925 aerial previously, but it is worth sharing again. What a wonderful photograph of a healthy confluence of the St Lucie River/Indian River Lagoon!
Every time I see it, I see something new.
I see the white sands of the newly dug St Lucie Canal, today’s C-44 connected to Lake Okeechobee, in the far middle distance; I see dark, prevalent natural vegetation; I see an undeveloped Sailfish Point, Rocky Point, Manatee Pocket, Sewall’s Point, and Stuart; there are a few roads, but no airport; no spoil islands along Sewall’s Point; there are no “bridges to the sea; ” I see shoaling, as the St Lucie Inlet had been opened/widened not too long before ~located just around the left hand corner of the photograph; I see beaches at Hutchinson Island with beautiful coquina sands that had not been “re-nourished;” I see lush seagrass beds, the nurseries of life, cradled against the shoreline; I see Paradise…
What would we do as far as development in this paradise, if we had it to do all over again?Or would we do just the same?
How we develop lands, of course, affects the health of surrounding waters. Today, what can we do to reinvigorate our rivers, our paradise? How can we help bring back the seagrasses especially? Well, we can do a lot.
Think of all the lawns that would be in this photo today! All the development, and how when it rains everything on our streets, parking lots, and lawns runs into our drainage systems and into our river.
Yesterday was June 1st, the beginning of rainy season. The beginning of fertilizer restrictions that were especially inspired for the entire Indian River Lagoon by the work of Sewall’s Point, the first to have a strong fertilizer ordinance, in 2010. I am proud of this and thank my fellow commissioners of that era.
Do what you can by not fertilizing your yard this rainy season, and if you haven’t considered changing out your yard to a more natural, Florida Friendly landscape, perhaps begin the process.
Every little thing we do, counts. And the more we do, the pressure we can put on the “big polluters” to do the same.
Public image, human waste to biosolids-fertilizer, 2017
Today is June 1st, the beginning of the fertilizer ban in Martin County, especially Sewall’s Point that goes through November.
It was Mr Gary Roderick who worked for Martin County that first taught me about Biosolids, or “fertilizer” made from all of our human waste. It was Gary who taught me about the business of spreading this on the lands, the state basically paying farmers to do so, and how no matter how hard we all worked, no matter a reservoir and water sent south or not, the truth of the matter is that we just keep over-nutrifying and polluting the land and thus our waters just as fast as we can try to fix them.
On Sunday , May 27th, 2017 TCPalm ran an article by Lucas Daprile, part of an outstanding series they are doing on this issues. The article begins: “The state plans to allow a massive farm (Sunbreak Farms) on the St Lucie/Indian River County line to annually fertilize its cornfields with 80,000 tons of compost comprised of one-fourth treated human waste.”
Chances are the Department of Environmental Protection will approve this because “it’s safe”…as they have for decades.
This waste-made-fertilizer should be shipped and sold to areas outside of the state that do not have the nutrient issues we do in here Florida –not spread in watersheds that drain into Lake Okeechobee and the Indian River Lagoon.
Drowning in our human excrement? You’ve got to be kidding me.
_____________________________________________
St Lucie County Commission Meeting on this issue “Sunbreak Farm’s Permit”
6pm, June 6th, 2017, 23000 Virginia Ave, 3rd Floor, Ft Pierce, Florida
Useful links/and some articles where Gary Roderick is quoted:
“Wastewater treatment plants (WWTPs) in the United States generate approximately
7 million dry tons of biosolids each year. Since biosolids are rich in plant nutrients, farmers, landscapers, and homeowners use about 50 percent of the annual production of biosolids as fertilizer for plants. Biosolids must meet standards for nutrient, metal, and pathogen content before it can be used to fertilize plants and to improve the quality of soil. Because a variety of pharmaceuticals and other household chemicals have been found in the wastewater discharged from WWTPs, questions have been raised about the presence of these chemicals in biosolids. To help answer the questions the scientists purchased or obtained nine different commercially or publicly available biosolids and analyzed them for 87 organic chemicals found in cleaners, personal care products, pharmaceuticals, and other products.” USGS
Toxic Algae bloom washes up along the shoreline, St Lucie River, Riverside Drive, Stuart, Florida. (Photo Jenny Flaugh, 7-13)
Sandbar, St Lucie River/Indian River Lagoon, Memorial Day Weekend, 5-29-17, Todd Thurlow.
Today I am comparing and contrasting photos of the St Lucie River/Indian River Lagoon in May of 2016 to photos in 2017. A Lake O dump year to a non-Lake O dump year. “A picture speaks a thousand words”…maybe more.
Jacqui
________________________
Photos of the Sandbar at the confluence of the St Lucie River and Indian River Lagoon this Memorial Day weekend, 2017. Clear, clean water, although meadows of seagrass in Sailfish Flats has not yet returned.
Chase with a tarpon he recently caught and released, St Lucie River/Indian River Lagoon region. Photos courtesy of Chase’s iPhone, 5-24-17.
Happy 17th Birthday to Chase! If you don’t already know him, Chase is one of Stuart’s leading sports fishermen, in any age category. This photo is of a recent catch of my favorite fish, the beautiful and unforgettable, “Silver King Tarpon.”
Since Chase was thirteen years old, when we ran into each other, he would share photos of his fishing expeditions. I always stood there, mouth wide open…”Are you kidding me?” I would ask. He would just smile with his wide, blue eyes saying it all:” THIS IS NO FISH STORY…
In 2015, Chase and I, together with many others tried to save a pigmy whale that had beached at Stuart. Chase loves the outdoors and has respect for all of the water’s creatures.
Yesterday, in Jensen, I ran into Chase celebrating his 17th birthday with family and friends.
Perhaps it is his mother’s wonderful name, “Cobia,” that inspires her son! 🙂
If you are a reader of my blog you know, the ancient, acrobatic, and historic tarpon is my favorite fish as it was the original sports fish of the St Lucie River/Indian River Lagoon, until its numbers were destroyed by canals, C-44, C-23, C-25 and C-25. Had these canals not been allowed to decimate our river, Tarpon would still be King, not the famous off-shore Sailfish….
Thank you Chase for sharing and inspiring us all! We know you have a great future ahead of you!!!! I can’t wait ’til you have your own show!!!!!!
Chase w/Tarpon . What a beautiful fish!
Chase w/Tarpon!
Tarpon Fishing in the St Lucie River/S. Indian River Lagoon ~ by famed artist or the time, Kent Hagerman, 1893-1978. Image courtesy, Sandra Henderson Thurlow archives.
Canals in Martin and St Lucie Co.: C-23, C-24, C-25 constructed in the 50s and 60s. C-44 connected to Lake Okeechobee, the worst, constructed in the 1920s. These canals, assisting agriculture and development, destroyed the “fishing grounds of presidents” from the early 1900s, the famed St Lucie River. In the 30s and 40s the offshore Sailfish was marketed and Stuart became known as the “Sailfish Capital of the World” as so many of the tarpon and other fish of the river had declined. The tarpon was forgotten as the original main game fish of the St Lucie River. May he rise again! JTL

 4.SFWMD staff’s recommendation to the Corps regarding Lake Okeechobee operations for the period March 2 to March 8, and March 9 to March 15, 2021: Ops_Position_Statement__Mar_02_08_2021
  Friday, March 5, my husband Ed and I , took aerials of the St Lucie River/Indian River Lagoon just one day before the Army Corps of Engineers began discharging to the St Lucie River on March 6, 2021. I can’t say that in all our years of taking photographs since 2013, we have done so just one day before discharges began. Thus, now Ed and my goal is to take photos every week as long as the discharges continue. This will give us a really good opportunity for visual comparison.
 -St Lucie Inlet and Sailfish Flats at Sailfish Point
 -Sailfish Flats with no visible seagrass
 -St Lucie Inlet
  -A faint plume is visible going south along Jupiter Island
 -St Lucie River and Indian River Lagoon
 -Looking south over Hutchinson Island at St Lucie Inlet
 -Views north along Indian River Lagoon

 -At St Lucie Inlet looking over Jupiter Narrows to Port Salerno and Stuart
 -Water just outside St Lucie Inlet on north side, reefs visible as is sediment exiting inlet
 -Another view encompassing almost all: St Lucie River, Southern Indian River Lagoon
  -Looking south towards Palm City where the South Fork connects to the C-44 and Lake Okeechobee when structure S-80 and S-308 are open.
  -Looking east toward the cross shape and forks of the St Lucie River. IRL in foreground. Sewall’s Point lies between the St Lucie and IRL.


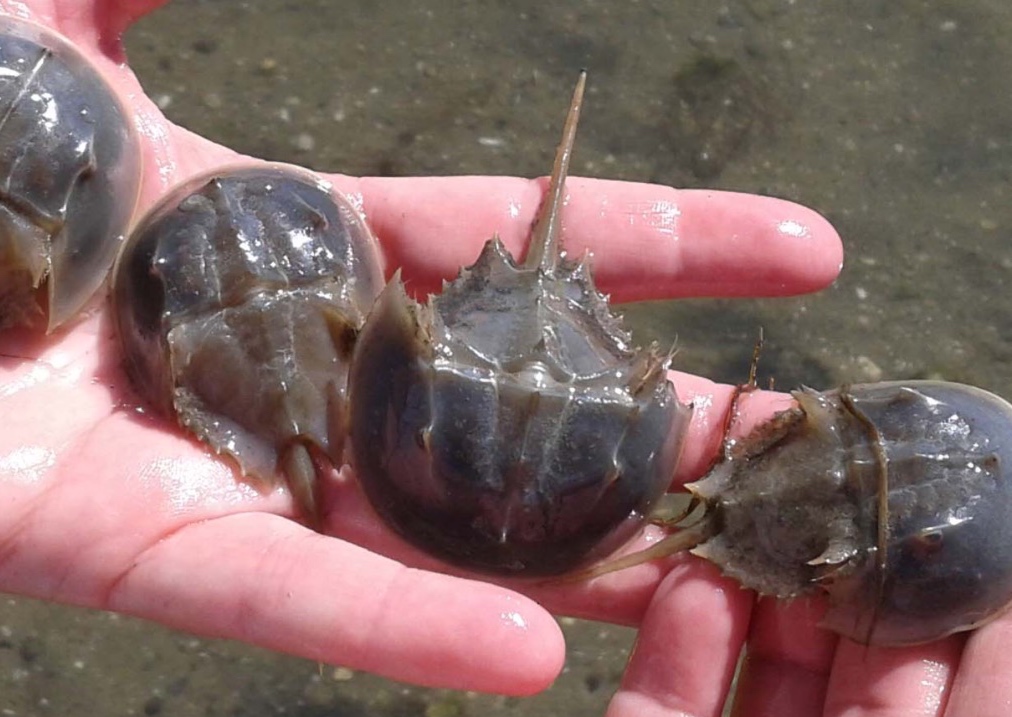


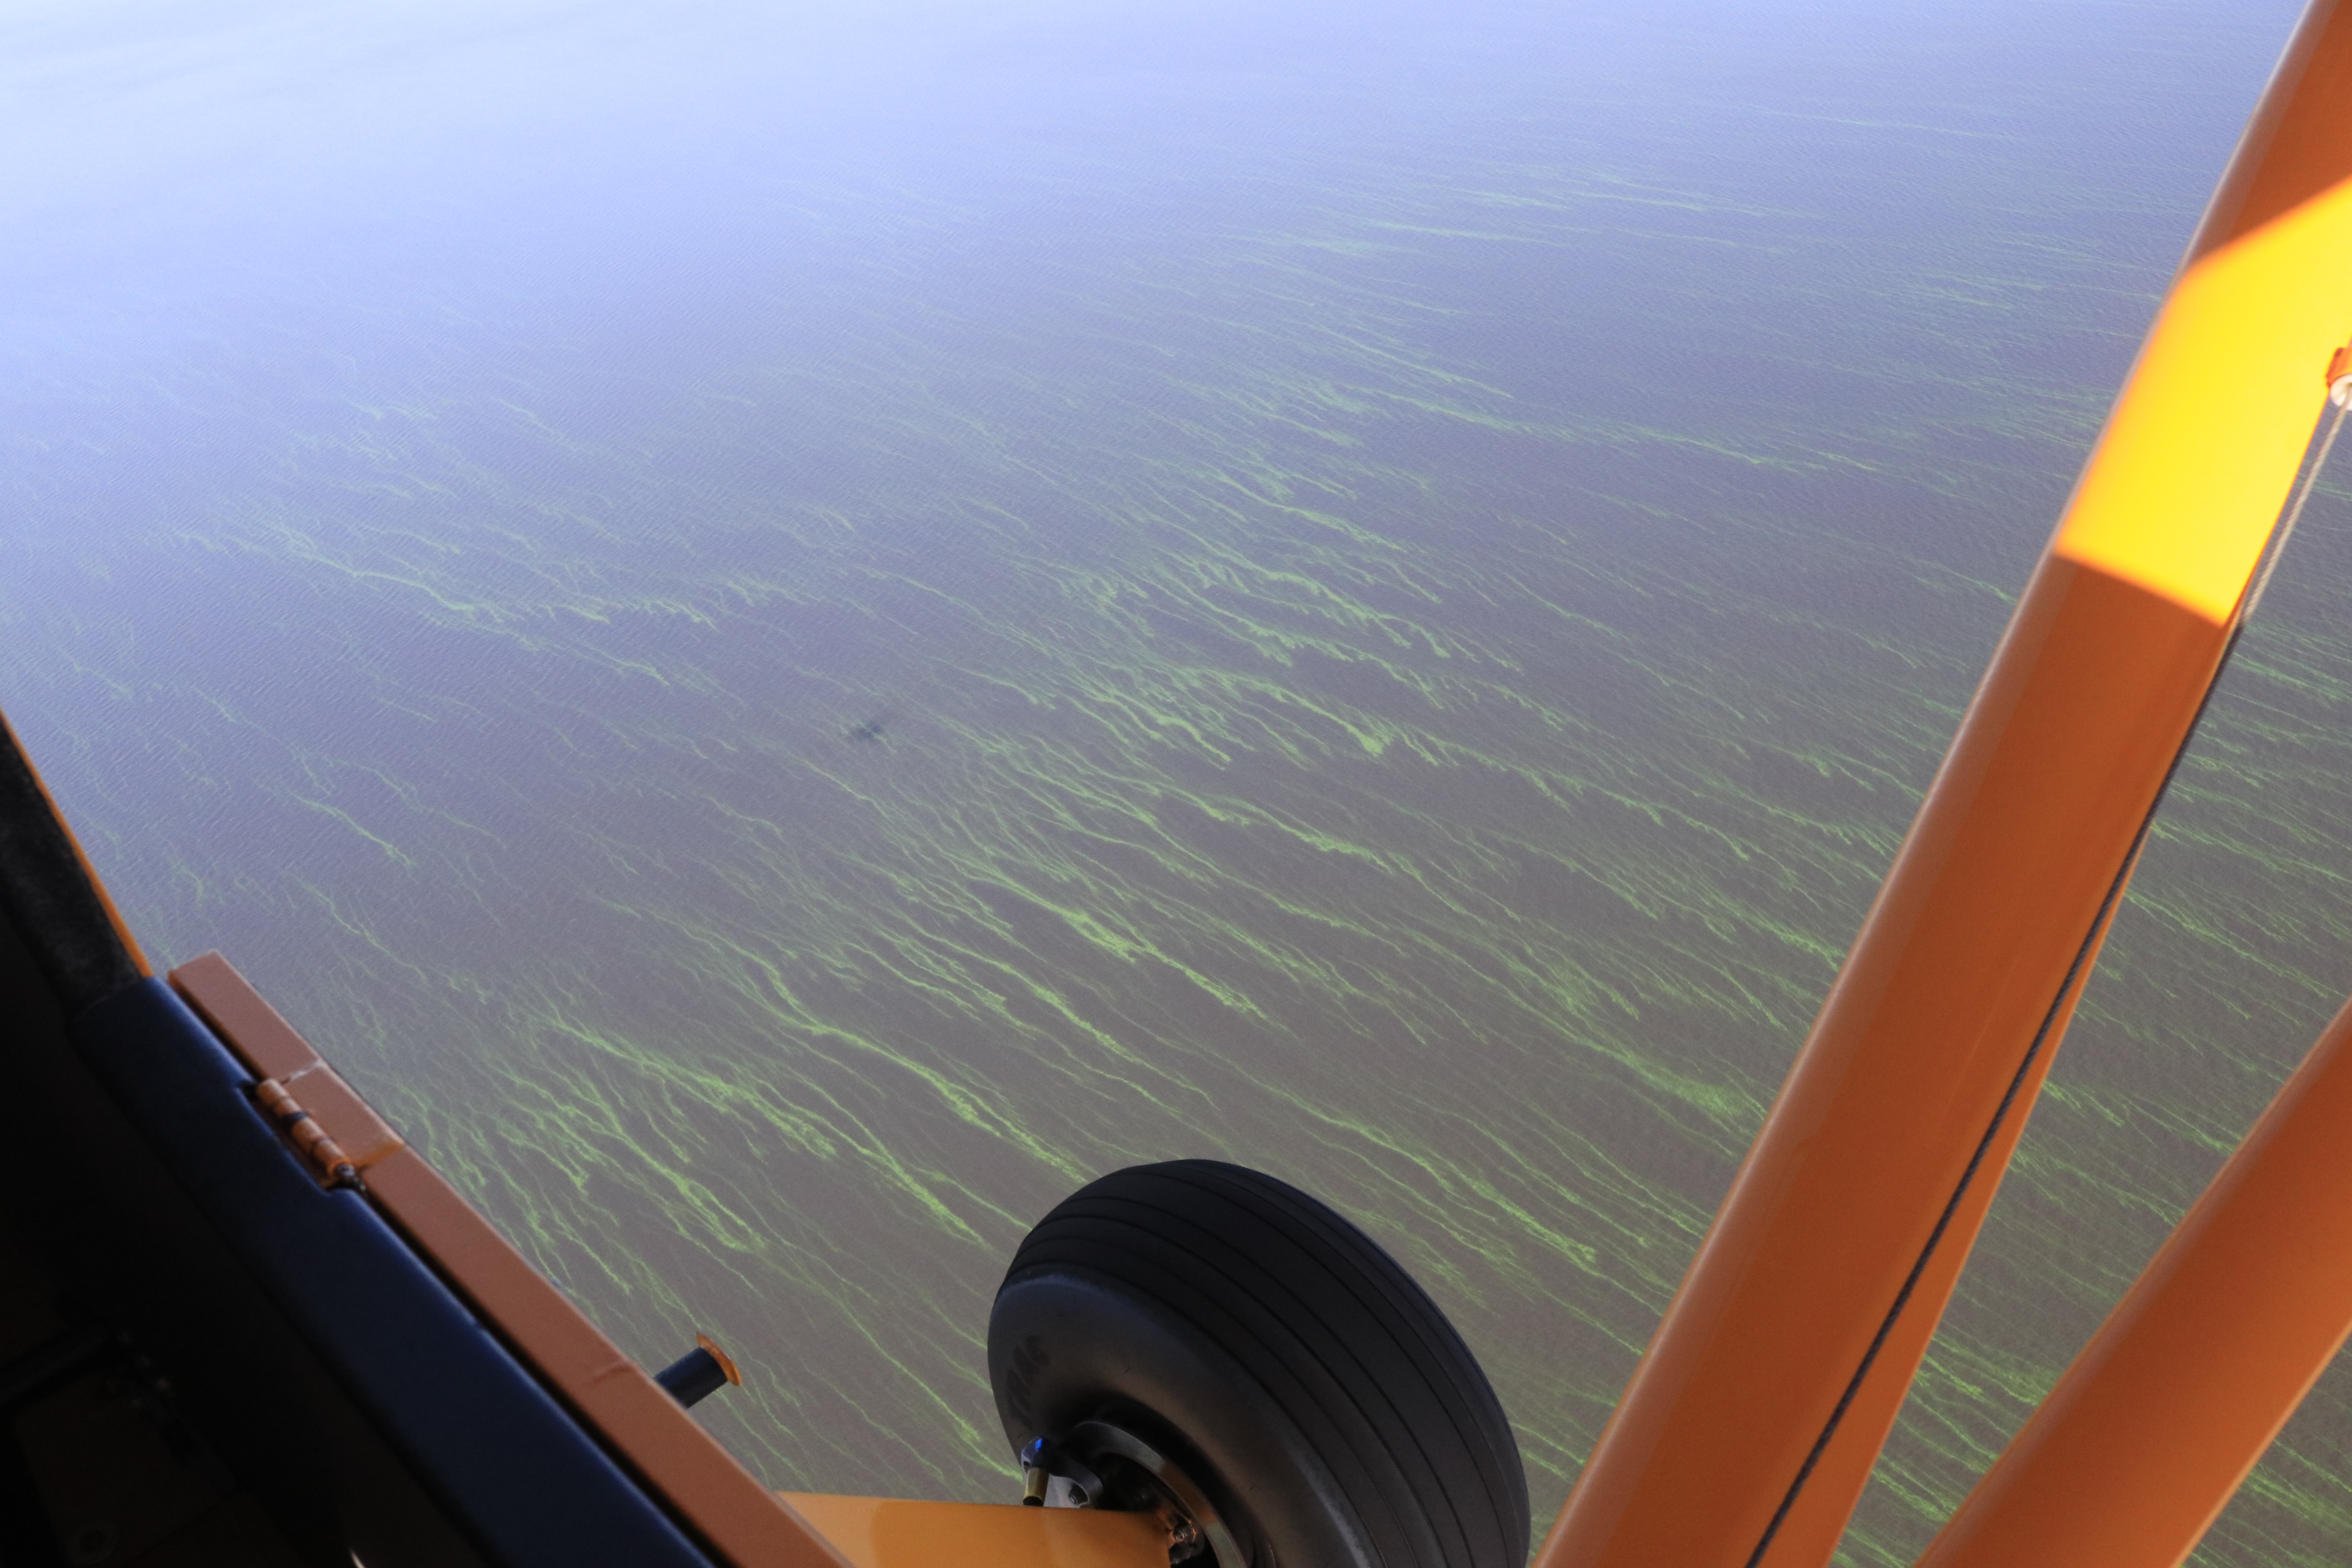


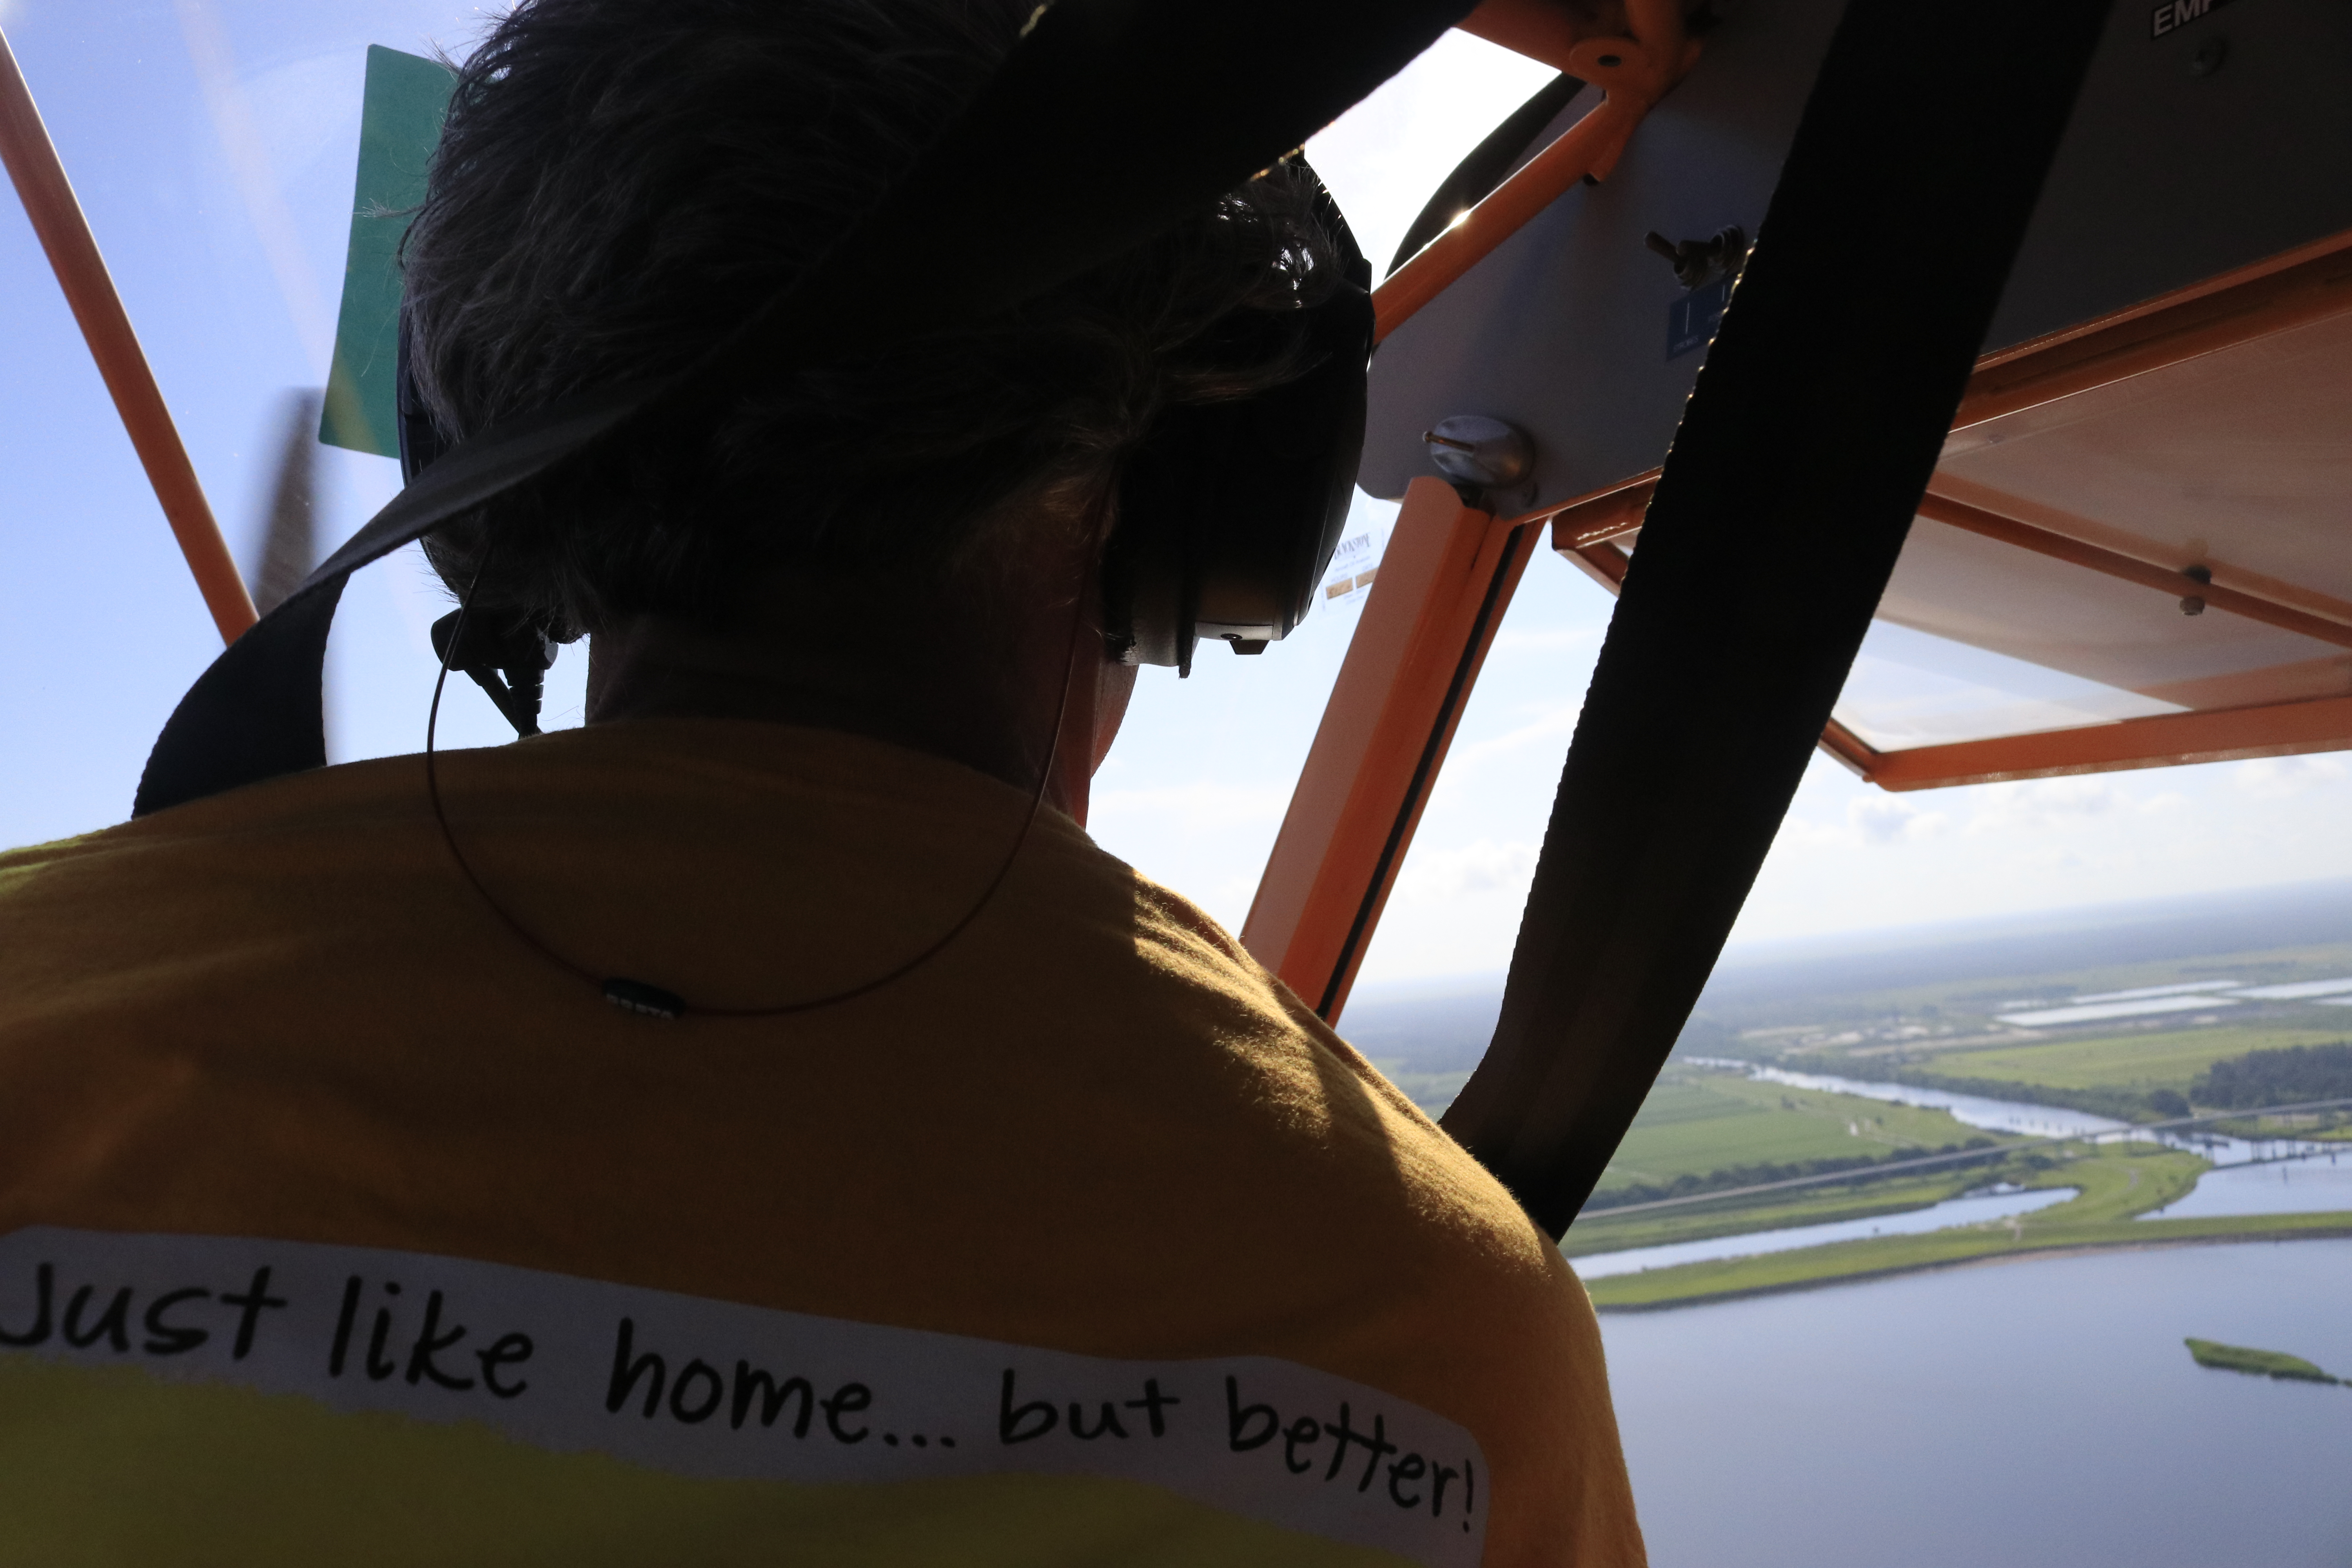


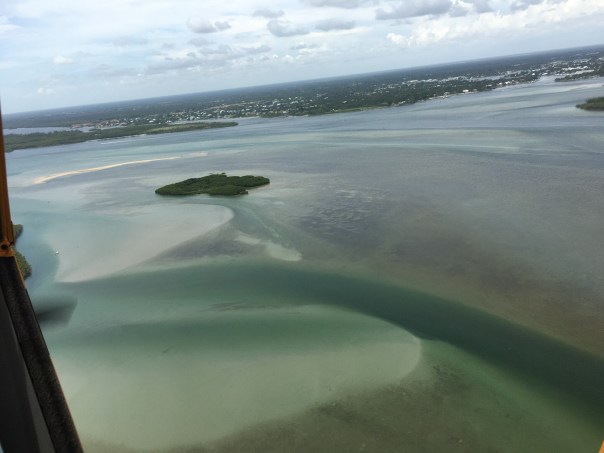

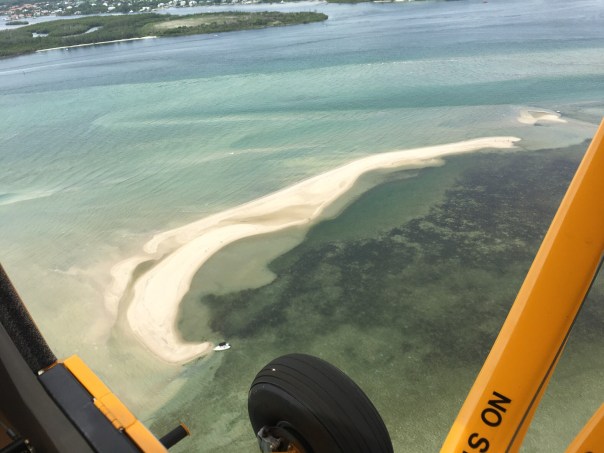


