Even though the water in yesterday’s photo looked gorgeous, lest we forget, here are some images of the St Lucie River/Indian River Lagoon area during a rainy and cyanobacteria ridden 2018.
Ed and I didn’t start taking pictures until were motivated…
You’ll see that after the rain event, the St Lucie River/Indian River Lagoon looks terrible even with out Lake Okeechobee discharges. This is caused by directed water runoff from C-23, C-24, C-25, C-44 and “local” coastal runoff. Naturally, the river never took all this water. Humans made it this way, and we must fix it.
SFWMD canal and basin map.
Soon after the torrential rain, the Army Corp of Engineers made things even worse and started dumping from Lake Okeechobee through the C-44 Canal into the St Lucie River by opening up the gates at S-308 and S-80.
My husband, Ed, first flew over Lake O on June 1st, just by chance. At this time, he spotted algae on the lake and took a photo. Ironically, the next day, the Army Corp started dumping from Lake Okeechobee on June 2nd!
The algae or cyanobacteria (http://www.ucmp.berkeley.edu/bacteria/cyanointro.html)
that was festering in the Lake began to show up almost immediately thereafter in the St Lucie River that has also become a “nutrient porridge.”
After another long, hot summer, the Army Corp finally stopped discharging in the fall~October 5th… Take a look at the photos and remember to enjoy the blue water when it is here, but NEVER FORGET! Only though looking back, will we have the determination to change the future.
Major rain event in March 2018. Rain filled this vile up many times!SLR IRL following major rain event in March 2018. This is runoff from C-23, C-24, C-25, C-44, and “locally” from developed areas along the river and uplands made to drain into river. JTLFollowing rain event in March 2018. A brown Atlantic.Following rain event in March 2018, the SLR/IRL ~Scott KuhnsFollowing rain event in March 2018 Sailfish Flats between Sewall’s and Sailfish Points ~Scott KuhnsJune 5th. A very dark plume moves south along Jupiter Island, just days after ACOE begins dumping so this is a combination of all pollution/runoff waters…
LAKE OKEECHBEE DISCHARGES ADDED
Ed in the Cub after plume photoAlgae as photographed/spotted by Ed in Lake O on June 1st 2018.
City of Stuart, June 9 2018.
Rio near Central Marine, week of June 12, 2018
Photographing a manatee in the algae along seawall by Mary RadabaughMary Radabaugh manages Central Marine with her husband. JTL
Mary found a dead baby manatee floating in the putrid water shortly after LO discharges. MR
LAKE O: Week of June 16th, June 25th, and July 22nd. Cyanobacteria (blue green algae) blooms and then subsides. ~All the while, this water is dumped into the St Lucie River by the Federal Govt.; the water quality is terrible and this the responsibility not of the Feds but of the State of Florida.
Algae is now very visible in Lake O, June 16, 2018 JTLJune 25, 2018 Lake O, near S-308, Port Mayaca. JTLC-44 canal leading to SLR from Lake O.C-44 canal leading from LO to SLR.Satellite view LO bloom on June 24, 2018. ~At its height.By July 22, 2018 the bloom in the LO is lessening, JTLAugust 29, algae would come and go, throughout the SLR. Here near Overlook Drive JTLSeptember 4, algae still “coming and going” ~2018 Snug Harbor, Stuart. Photo by my uncle, Dale Hudson
October 5, the ACOE stops dumping from Lake O. The blooms stop almost right away but the damage remains….
December 8, 2018 the river looks “normal” again near Sewall’s Point but it is not. JTL
Isn’t this old ad from the early 1920s great? Thanks to my mother, local historian Sandra Henderson Thurlow, I have some old real estate ads to share from our region of the state. It makes me think…
The ad reads:
Oscar Hand Pullman Bus Line Connecting with Everglades Boat Line
“Scenic Route of Florida” Daily (Except Sunday)
Through the Everglades, Canals, Across Lake Okeechobee and Along the Famous Muck Soil, the Richest in the World.
Down the Famous Caloosahatchee Vally Route, Abounding with Tropical Scenery, To Fort Myers, the Prettiest Town on the West Coast.
Just $14.04
Today? We could offer a Toxic Algae Tour from Coast to Coast, couldn’t we?
Our ad could read:
A boat ride from the red tide waters of the Atlantic through a polluted St Lucie River
to an airplane or satellite view of an algae filled Lake Okeechobee
then a boat ride to the ailing Calooshahtchee with both red and green tides too!
$1140.04
Historic Scenic Route of Florida?
It went to Hell in a Handbasket!
Come See!
Toxic algae under the Evans Crary Bridge, St Lucie River, JTLLake O 239 square foot algae bloom, NASA satellite imageJamie Burns, St Lucie River full of algae bloom from Palm City to Sewall’s Point.Caloosahatchee algae bloom, photo courtesy Dave Stone.Caloosahatchee region, photo John Moran
I woke up to seeing sunshine through the window. I looked at my phone. My brother’s text read: “S-308 just jumped to 1484 cfs and its climbing.”
(Go to St Lucie River for reports: http://www.thurlowpa.com/news.htm)
In Sewall’s Point, today is the first morning in three weeks that it hasn’t been raining, or just about to. My porches have been slick with moisture and leaves. The frogs in my pond are so loud at night I have to put in ear-plugs. My husband and I laugh saying you can count sheep, but there is no sleep!
In spite of all of this and the fact that the ACOE has been discharging from C-44 canal basin since around May 16, and the St Lucie River already looks like hell, it is still disappointing and heart-wrenching when they formally “open the gates.” ~To Lake Okeechobee that is…
In spite of the history, or knowing why they do it, it just seems so wrong that little St Lucie has to take basically one-third of the crap water for the state. Sorry and I know my mother will not like that word, but its the truth. Thank God for Joe Negron and his work last year as President of the Florida Senate and resurrecting the EAA Reservoir. And curse to any new Governor who does not help it be fulfilled.
The natural drainage basin of the St Lucie River shown in GREEN below was much smaller than it is today. The introduction of four man-made drainage canals dramatically altered its size and the drainage patterns. This primarily being C-44, the canal connected to Lake Okeechobee (bottom). One can see from the map image that C-44 Basin and of course Lake O’s water, the most effective assassins, were never part of the St Lucie Basin as were not Port St Lucie’s C-23, C-24, and C-25 system. These canals have killed our river!
The EAA Reservoir must be built, and in time, more water must move south to Florida Bay. We shall be fixed or compensated or a combination of both for our now noxious-reality. We will not accept this fate. Who knows what this summer shall bring. But one thing is for sure, this life along the St Lucie, is now toxic.
Drainage changes to the SLR. Green is the original watershed. Yellow and pink have been added since ca.1920. (St Lucie River Initiative’s Report to Congress 1994.)
A lone Great Egret looks for fish along a putrid looking, foam filled river. All images taken yesterday, 5-31-18 at Ernest Lyons Bridge. JTL
Thank you to ACOE for the following information and press conference yesterday.
Lake O water management slide_20180531: this slide shows lake levels comparatively. The lake is now high going into hurricane season, starting June 1st, ironically today. The lake is managed as a reservoir for agriculture.
Email 5-31-18
All,
The U.S. Army Corps of Engineers (USACE) Jacksonville District will start releasing water from Lake Okeechobee this weekend as part of its effort to manage rising water levels.
The discharges are scheduled to begin Friday (June 1). The target flow for the Caloosahatchee Estuary is 4,000 cubic feet per second (cfs) as measured at Moore Haven Lock (S-77) located in the southwest part of the lake. The target flow for the St. Lucie Estuary is 1,800 cfs as measured at St. Lucie Lock (S-80) near Stuart. Additional runoff from rain in the St. Lucie basins could occasionally result in flows that exceeds the target.
“Historic rain across the region since the middle of May has caused the lake to rise more than a foot,” said Col. Jason Kirk, Jacksonville District commander. “We have to be prepared for additional water that could result from a tropical system. The lake today is above the stage when Irma struck in September, which eventually caused the water level to exceed 17 feet. A similar storm could take the lake to higher levels.”
Today, the lake stage is 14.08 feet, up 1.25 feet from its 2018 low which occurred May 13. The lake is currently in the Operational Low Sub-Band as defined by the 2008 Lake Okeechobee Regulation Schedule (LORS), but within one foot of the Intermediate Sub-Band. Under current conditions, LORS authorizes USACE to discharge up to 4,000 cfs to the Caloosahatchee (measured at S-77) and up to 1,800 cfs to the St. Lucie (measured at S-80).
“Forecasts indicate more rain is on the way in the coming week,” said Kirk. “Additionally, long-range predictions indicate increasing probabilities of above-average precipitation for the rest of the wet season. We must start aggressively managing the water level to create storage for additional rain in the coming wet season.”
Hurricane Irma may be gone, but her waters are not. Our now black river and the giant plume off the St Lucie Inlet attest to this. Clean rain that fell in our region during the hurricane is now filthy “stormwater” discharging, unfiltered, through manmade canals C-23, C-24, C-25, and C-44. Nature did not design the river to directly take this much water; this much water kills.
Every plume looks different, and this one is multilayered with no clear border. Sediment soup, black-brown in color, yesterday it extended out about 2/3 of a mile into a stirred up Atlantic and flowed south, in the rough waves not quite having made it to Peck’s Lake.
Since Hurricane Irma’s rains, area canals dug with no environmental foresight in the 1920s and 50s for flood control, and to facilitate agriculture and development, have been flowing straight into the river. On top of this, in anticipation of the hurricane, three days prior to IRMA the Army Corp of Engineers began discharging from Lake Okeechobee. During the hurricane they halted, and then started up again at high discharge levels reaching over (4000 cfs +/-) this past Friday, September 15th. As Lake Okeechobee rises and inflow water pours in from the north, and is blocked by the Everglades Agricultural Area in the south, we can expect more Lake O discharge on top of the canal releases themselves.
As advocates for the St Lucie River we continue the fight to expedite the building of the EAA reservoir and to create a culture to “send more water south.” In the meantime, we, and the fish and wildlife, and the once “most bio diverse estuary in North America,” suffer…
My brother Todd, has complied many other links on his website’s favorites under St Lucie River and ACOE/SFWMD: http://www.thurlowpa.com/news.htm
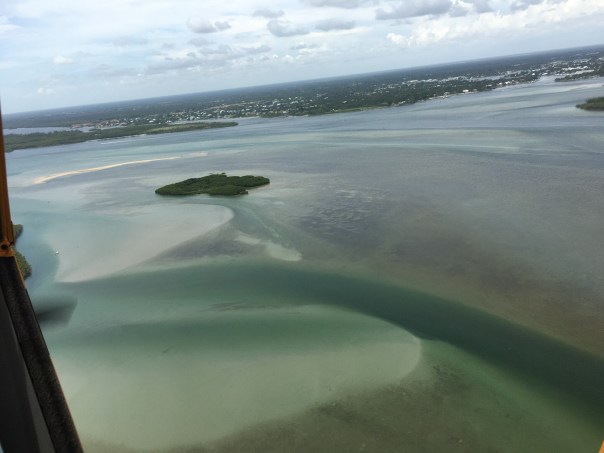
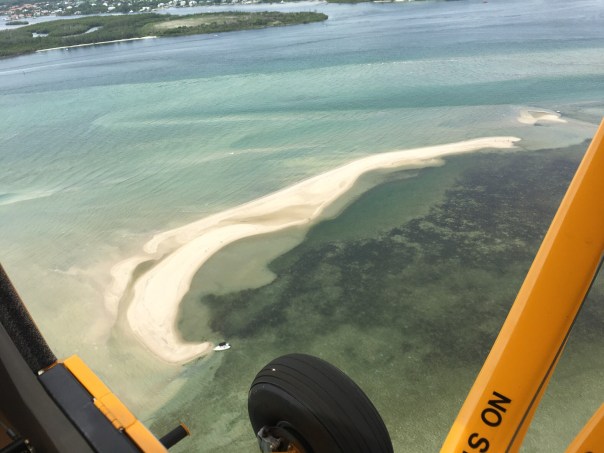
Post Irma flight over St Lucie River/IRL 9-17-17
SFWMD canal and basin map. C-44 canal is the canal most southerly in the image. All canals shown here discharge into the SLR/IRL.The confluence of the St Lucie River and Indian River Lagoon at Sewall’s Point, an area once full of seagrasses and fisheries and formerly considered the heart of “the most bio diverse estuary in North America.”Waves in plume breaking over offshore reefs; looking north to Hurchinson Island.Southern edge of plume along Jupiter Island and Jupiter Narrows south of St Lucie Inlet.
Looking south off St Lucie Inlet.South edge of plume looking south towards Jupiter Island.
TCPalm’s Elliott Jones reported this morning that Stuart has received a whopping 11.30 inches of rain just so far this month! (The average being 7.14.)
Although due to the recent drought, the ACOE/SFWMD are not dumping Lake Okeechobee through Canal C-44, canals C-23, C-24, C-25, and areas along C-44, as well as our own basin, are draining right into the St Lucie River/Indian River Lagoon. Very little of this water is cleansed before it enters and thus is damaging to the eco system. Next time you see water draining through a grate in a parking lot, think about this. Remember too that before the major canals were constructed the 1900s, the river received less than half the water it gets every time it rains today.
SLR at “Hell’s Gate” looking at Sewall’s Point, Sailfish Point and the St Luice InletDrainage changes to the SLR. Green is the original watershed. Yellow and pink have been added since ca.1920. (St Lucie River Initiative’s Report to Congress 1994.)
The aerials below were taken 6-13-17 by my husband Ed Lippisch and pilot Dave Stone. It is important to monitor the river all of the time so we can view changes.
“Rain stained” we are; please remember not to fertilize during the rainy season. The birds on Bird Island will appreciate it! (http://befloridian.org)
TC Palm, Elliott Jones, 6-19-17Bird Island, IRL east of Sewall’s PointBird IslandIRL St Lucie Inlet and Sailfish PointSailfish Flats, IRLCrossroads, confluence SLR/IRL off Sewall’s PointSpoil Island off Sailfish, bird also roosting here!Sick looking seagrass beds in IRL looking south towards Jupiter Narrows““SL Inlet near Sailfish Point, no black plume but darker colored watersJupiter Island’s state park at St Lucie InletSailfish PointSt Lucie Inlet looking southinlet againClear ocean water at jetty, St Lucie InletLooking back to St Lucie Inlet mixed colored waters but not black as with Lake O water releasesSt Lucie Inlet between Jupiter Island’s state park and Sailfish Pointinlet againLooking north to SL InletJettyHutchinson Island and Sailfish Flats in IRL. Sewall’s Point in distance.Parts of the Savannas near Jensen , IRL and Hutchinson Island in distanceSavannas State Preserve Park
Canals draining water into SLR/IRL after rain events:
5-7-17: Hutchinson Island along the Atlantic Ocean and confluence of the St Lucie River/Indian River Lagoon, blue waters, seagrass not yet revived from 2013 and 2016 Lake O discharges. Photo Ed LippischMy husband’s flight yesterday over the Atlantic Ocean, St Lucie Inlet, and St Lucie River/Indian River Lagoon is beautiful. But look carefully and you will see a light-colored brownish plume at the mouth of the St Luice Inlet entering the ocean. Finally after months of drought, it has begun raining. And when it rains… (mind you C-44 connecting the St Lucie River to Lake Okeechobee is closed now) the re-directed run-off of waters from canals C-23, and C-24 of course still flow into our St Luice River/Indian River Lagoon.
These canals organized and built during the 1950s and 60s are part of the Central and South Florida Flood Project that the Army Corp built following the hurricane and extensive south Florida flooding of 1949. The run-off waters from these canals and the local watershed are what you see in today’s video.
As damaging as C-23 and C-24 are (they too must be reworked and redirected) they are not the damaging discharges from Lake Okeechobee that throw the St Lucie over the brink as in 2013 and especially 2016 when toxic algae covered extensive portions of the entire St Lucie.
Rio, St Lucie River, Jeff Tucker, toxic algae
…
…
3
Shoreline of Sewall’s Point, Tracy Barnes 6-25-16
…
(Photo mosaic from 2016 shows various photos by Dr Scott Kuhns, Rebecca Fatzinger, (wildlife) JTL/Ed Lippisch, pilot Dave Stone and others.)
In spite of the light brown plume, the short video flight from Jensen to Peck’s Lake shows blue waters near the inlet and mouth of the estuary as it should be, not black water. If Governor Scott does not veto the budget, the reservoir in years to come will help offset the Lake Okeechobee destruction and open the way to truly “send the water south.” #ThankyouJoeNegron
This is very exciting, but believe me, this is no time to let down your guard, as the fight for control of Florida’s waters has really just begun.
Reef system off Sailfish point is covered in black water, sediment, and nutrient pollution when Lake O is discharging. Here after months of drought, and finally some rains we can see the reefs. 5-7-17, Photo Ed LippischMap SFWMD showing canals and basins. Note S-308 or structure s-308 at Lake O and S-80 down the C-44 canal AKA the St Lucie Canal. Both of these structures have to open to allow water to flow into the C-44 canal to the St Lucie River, Indian River Lagoon. All canals are destructive to the St Lucie/IRL yet it is C-44’s Lake O that puts the St Lucie system in complete and total overload.DEP C-23:http://www.dep.state.fl.us/southeast/ecosum/ecosums/c23.pdf
As you know, we are on a Road Trip. We are driving through not only to learn about the Glades, but also to learn about ourselves. Whether we realize it or not, we are all connected. We are related by history, by the drainage of the Everglades, and by a “better water future” we have no choice but to build together.
This map of the Glades is from the Florida Memory Project. It maps flood damage from two great hurricanes. Notice that the 1926 Hurricane damaged mostly the western part of the lake near Moore Haven, where as the 1928 Hurricane most intensely hit the eastern communities around Belle Glade. The towns/areas of Canal Point, Pahokee, Bacom Point, Belle Glade, South Bay, Lake Harbor, Bare Beach, Clewiston, Moore Haven and Newell all had to rebuild. “Chosen” near Belle Glade was chosen to be lost…
These past hurricanes define the history and the nature of some of the people of the Glades. The ones who “made-it” are survivors beyond anything we can possibly envision.
As Mr Lawrence E. Will an old family, a politician, and a prolific writer from the area wrote in HURRICANE:
“One word describes it. It was Hell. A raging inferno of rolling, swirling waters, of shrieking, demoniac winds, of lashing rain and of darkness, black and absolute. There were no atheists that night on the shores of Okeechobee! Then for the those still living came the second phase of hell; the phase of desolation and despair; of searching in the flooded woods and marshes, in elder clumps and sawgrass for the horrible remains of family and friends and neighbors; of loading them into trucks by unending scores; and finally of burning them in help of dozens when they could no longer be transported. It is hard to know which hell was worse…”
As we know in the 1930s the Herbert Hoover Dike was built to avoid such a disaster from happening again…but there is always the question of whether it will or not. It is dangerous to live on the low side of a dike.
As advocates of the St Luice River/Indian River Lagoon, we must be sensitive when discussing Senate President Joe Negron’s proposal for 60,000 acres to be purchased south of the lake to store, convey and move water south to the Everlgades. One can see how shouts of “Send the Water South” may send some people living south of the lake “over the edge…”
We must always make clear that when discussing Everglades resoration and improved health of the St Lucie River/Indin River Lagoon, safety, and economic prosperty for the Glades communties comes first. We know and respect their past…
Today’s Canal Point is easy to drive right through on one’s way to Pahokee, but the little town has an important past and seeded a great future. As we learn about it, we learn about ourselves, all part of South Florida’s giant drainage and development scheme that continues today. In the future, together, we must work to improve water quality that has been destroyed by development of the Everglades. In studying this area, one thing is clear, almost all has fallen away except the USDA Department of Agriculture Sugarcane Station still standing today, almost 100 years later: https://www.ars.usda.gov/southeast-area/canal-point-fl/sugarcane-field-station/
So how did Canal Point get on the map?
According to the book, Black Gold and Silver Sands, by James D. Snyder, Gilbert A Watkins, an expanding lumber dealer from “nearby” West Palm Beach, acquired lands in the area after 1896 when Hamilton Disston, (the man who first drained Florida’s swamp) died. The lands purchased by Watkins included 4,337 acres near the eastern lakeshore of Lake Okeechobee. Disston’s Southern States Land and Timber owned all the even-numbered, square mile sections east of Lake Okeechobee to the then Broward County line.
In 1917 when the West Palm Beach Canal was dug at the determination of the state’s Internal Improvement Fund, the board developing the state, it was decided to go through Mr Watkin’s property. He became more than a timber owner but a developer as the little town grew. Sugarcane sprouted up as well, and laid the foundation for the success of today’s largest EAA sugarcane cooperations.
The little town that came to be known as Canal Point eventually outpaced Pahokee, Okeechobee and Moore Haven. Tomorrow we will learn more about the United States Department of Agriculture’s Sugarcane Reasearch Center, and the road that got it there….Connors’ Highway. “Fingy” Conners– as his finger had been cut off.
The canal to Lake O became (Structure) S-352 to the WPB Canal as seen on maps belowCanal Point at Lake O. 1920s PBC Historical Society
The photos below of a severe algae bloom were shared yesterday by Rick Solvenson and Brenda Brooks who live on the Caloosahatchee River near Olga. This is on the south side of Caloosahatchee River near Fort Myers’ shores, just downstream of the Franklin lock. There is a second set of photos taken last Sunday and yesterday by Michael and Michelle Connor of Martin County along the side of Lake Okeechobee and at Port Mayaca.
So far in 2016, algae blooms have been reported in Lake Okeechobee, the St Lucie Canal, Palm City, (C-44) and the Caloosahatchee (C-43). The ACOE continues to discharge these algae filled waters from the lake into the estuaries St Lucie and Caloosahatchee with the support of the South Florida Water Management District, the Department of Environmental Protection, the Florida Department of Health, and the knowledge of the Governor and Florida State Legislature.
From what I have read to date, the cyanobacteria toxic algae blooms reported thus far have not yet tested “high enough” to warrant concerns at the level of the World Health Organization…not yet, but if they do, —-expect some information, but don’t expect protection. Florida is not providing such these days, not to us anyway.
Google mapsmapPhotos by Rick Solvenson, Caloosahatchee River 5-23-16.23456789101112
_____________________________
Map of Port Maraca and south side of Lake O in MC.Port Mayaca 5-23-16 (Mike Connor)Lake OLake O’s south side in Martin CountyClose upRedirection of water to the estuaries supports and protects the EAA south of the lake. (Map Everglades Foundation.)
Historic aerial of Port Sewall’s Golden Gate area in 1954, US1 and Dixie in foreground. (Photo courtesy of historian, Sandra Henderson Thurlow)
If you ever drive the easterly location of Indian Street in Martin County, you are in the historic subdivision for the proposed Town of Port Sewall. According to the “History of Martin County,” in 1910, Hugh Willoughby and Captain Henry Sewall established the Sewall’s Point Land Company which developed Port Sewall–of which Golden Gate is part.
I was taken by these old aerials from 1954 showing the straight roads of the Golden Gate section of the development with Sewall’s Point and St Lucie Inlet in the distance; I wanted to compare the photo to a cool old plat map and a Google map of today.
I love this old area of Martin County. So much history. It is fun to drive along Old St Lucie Boulevard and through Golden Gate. There are still remnants of the past. To visit the old Golden Gate building on Dixie Highway now getting a new life as the office of House of Hope—that was once a real estate office…..an awesome old Whiticar Boatworks from a bit later…
One of the long forgotten thing about this area is that Sewall and Willoughby’s vision for this development was a deepwater port off of Sewall’s Point. According to historian Sandra Thurlow, “The port was to be established at the junction of the waterways known today as the Crossroads. It would be called “Port Santa Lucia” and would handle the vast amounts of produce that would be shipped out of the interior of Florida via the cross state canal.”
The cross-state canal in this reference? Yes, the cross state canal of the 1920s was the dreaded St Lucie Canal or more lovingly know today as C-44…the canal that connects Lake Okeechobee to the St Lucie River/Indian River Lagoon.
Willoughby and Sewall’s development and the Port of Santa Lucia never succeeded as the Great Depression of the 1920s killed that dream. But unfortunately part of the dream of that era lived on. Today the cross state canal or since named “Okeechobee Waterway” (C-44 in Martin County) does not transport vast amounts of fresh produce, but rather is used to “manage” the waters of Lake Okeechobee and to send sediment and nutrient filled Agricultural run off to feed algae blooms and destroy the property values of Sewall’s Point, Port Sewall, Golden Gate, and the rest of Martin County.
Golden Gate 1954Historic Port Sewall plat map 1913 – Version 2 (rotated for comparison.)Google maps of Port Sewall area today, 2016.SFWMD canal and basin map. C-44 canal is the canal most southerly in the image. The canal goes from Lake Okeechobee to the St Lucie River exiting at the ocean near Sewall’s Point and Hutchinson Island.Waters off of Sewall’s Point where the Port was to be located in August 2013 during high levels of discharges from Lake Okeechobee. (JTL)Releases from Lake O at tip of Sewall’s Point at the Crossroads, 2016. Photo Ed Lippisch.
Dr. Gary Goforth has more than 30 years of experience in water resources engineering, encompassing strategic planning, design, permitting, construction, operation and program management. (Photo JTL, 2015)…
The following was written by Dr Gary Goforth as a response to U.S. Sugar Corporation’s months long ad campaign in the Stuart News. http://garygoforth.net
· The health and economies of the St. Lucie River and Estuary, the Caloosahatchee Estuary, and Florida Bay have been sacrificed for decades by the management of Lake Okeechobee for the protection of US Sugar and other agricultural lands south of the Lake.
The recent ad blitz by US Sugar appears to be an attempt to divert the public’s attention away from this preferential treatment and from an egregious betrayal of south Florida taxpayers perpetrated by US Sugar, the Florida legislature and the Governor’s administration – the failure to exercise the willing seller contract to purchase US Sugar land south of the lake. Failure to secure needed land south of the Lake is the single biggest obstacle to long-term protection of the St. Lucie and Caloosahatchee estuaries from destructive Lake discharges, and providing Florida Bay and lower east coast wellfields with needed water.
· Water storage necessary to reduce high flows to the estuaries by about 90% will require about 10% of the land in the EAA – not complete elimination of farming in the area. The recent UF Water Institute study reconfirmed what scientists have been saying for decades – additional storage and treatment beyond what is currently planned in CERP and CEPP is needed south of the Lake: “If this required storage were to be provided strictly though deep 12-ft reservoirs, new land area between approximately 11,000 and 43,000 acres would be required south of Lake Okeechobee.” The upper limit – 43,000 acres – is less than ¼ of the amount of land US Sugar was willing to sell to the state (187,000 acres).
· Regarding the numbers in the ads – some are accurate, some are completely fictitious (e.g., the distribution of water from Lake Okeechobee), and many critical numbers are missing, e.g.,
-millions of pounds of nitrogen and phosphorus from lake Okeechobee that feed algal blooms and wreak havoc on the ecology of the river, estuary, lagoon and near-shore reefs. (million off pounds of nutrients that the State of Florida ignores in their BMAP progress reports for the St Lucie River.) – the hundreds of millions of pounds of Lake Okeechobee sediment that turned a once sand-bottom clear water estuary into a muck-filled lagoon that belches blackwater every time it rains. – the hundreds of millions of dollars of economic impact to local businesses, tourism and real estate values attributable to poor water quality If you’re interested go to the SFWMD’s (or my) website.
· Most of the area that the ads calls “local waterways” did not flow into the St. Lucie River (SLR) until after the major agricultural drainage canals (C-23, C-24, C-25 and C-44) were dug, connecting more than 250,000 acres to the SLR. Historically these areas flowed north into the St. Johns River watershed, south into the Loxahatchee and Everglades watersheds, evaporated or recharged the groundwater.
· The ads ignore the fact that more than half of the “local watershed” is agriculture, and that more than half of the flows and nutrient loads to the St. Lucie River and Estuary come from agricultural land use.
· Nutrient loads from septic tanks along the Indian River Lagoon need to be addressed in cost-effective ways based on good science. Nevertheless, nutrient loading and sediment from Lake Okeechobee and agricultural runoff constitute a far greater threat to the health of the St. Lucie Estuary than does loading from Martin County septic tanks. The loading from septic tanks in Martin County have been overstated by upwards of 200-300%.
· The 2016 Florida Legislature was an unmitigated disaster for the environment of Florida, with misappropriations of Amendment 1 funds for the second year in a row and the passage of a water bill that rolled back environmental protection for the benefit of agricultural interests. What role did lobbyists for US Sugar and other agricultural interests play in this debacle? —–Dr. Gary Goforth
*Dr. Goforth has more than 30 years of experience in water resources engineering encompassing strategic planning, design, permitting, construction, operation and program management. For the last 25 years, his focus has been on large-scale environmental restoration programs in the Kissimmee-Okeechobee-Everglades ecosystem. He was the Chief Consulting Engineer during the design, construction and operation of the $700 million Everglades Construction Project, containing over 41,000 acres of constructed wetlands. He is experienced in public education, water quality treatment design and evaluation, engineering design and peer review, systems ecology, statistical hydrology, hydrologic modeling, hydrodynamic modeling, water quality modeling, environmental permit acquisition and administration, hydrologic and water quality performance analyses. (Website: http://garygoforth.net)
Florida is like Africa. We have a wet season and a dry season. This dry season has been very wet!
In today’s blog, I will share the most recent update by Dr Gary Goforth sent to Martin County on 3-13-15 entitled: “Summary of Dry Season Flows, November 1, 2015 – February 29, 2016.” Dr Goforth gives a summary and provides wonderful visuals. The “pages” he mentions in his summary for this post have been converted to slides. (Please view slides from left to right.)
Thank you Dr Goforth. (http://garygoforth.net)
Are are an integral part in helping us understand why we must sent the water south…
Engineer, Dr Gary Goforth.SFWMD satellite map, S.Fl. Water Conservation Areas (WCAs) are below the Everglades Ag. Area (EAA) which is just under Lake O.
” All,
Thought you might be interested in this comparison of dry season inflows to, and discharges from, Lake Okeechobee. Inflows to the Lake were 79% higher this dry season (Nov. 1 2015 – February 29, 2016) compared to a year ago, but Lake discharges have only been 1% higher due to the inability to send water south. Hence Lake stages have increased more than a foot above the level it was at this time last year.
The basins with the biggest increases in Lake inflows are those along the north and northwest shores of the Lake – but not the Upper Kissimmee, which exhibited a 50% reduction in flows to the Lake compared to last year.
As we’ve seen, because of the heavy rains south of the Lake and the agencies delay in moving water out of the Water Conservation Areas, WCAs, the estuaries have taken the brunt of Lake releases this year.
The flow estimates on the first 5 pages are in acre feet and in billion gallons on the second 5 pages.
Gary Goforth
Dry Season Summary slides Dr. Gary Goforth 3-15-16.
View of convergence of SLR/IRL between Sailfish Point and Jupiter Island. Plume from Lake O discharges flowing out into ocean. Photo 2-7-16, Ed LippischCanals in Stuart, C-23, C-24, C-25 built in the 50s and 60s. C-44 connected to Lake Okeechobee constructed in the 1920/expanded in 1940s. The natural basins of the SLR have been tremendously enlarged plus Lake O water. This is killing the SLR/IRL. More water must go south.
It is important to know how to “speak the language” of the ACOE and SFWMD.
The St Lucie River/Indian River Lagoon is once again under siege. The Army Corp of Engineers and the South Florida Water Management District are doing the will of the reigning powers and discharging tremendous amounts of water and pollutants from Lake Okeechobee and altered surrounding lands (basins) into the St Lucie River/Indian River Lagoon.
We must learn how to interpret this destruction and how to use their language of “cubic feet per second,” (cfs), when talking about discharge amounts from Lake Okeechobee and area canals into the SLR/IRL.
I am not good at this interpretation, but someone I know is….
As in most families, each chid in my family was born with different talents. My brother, Todd Thurlow, got all the number and sharp analytical skills that I did not. I am very thankful to him for helping with my St Lucie/Indian River Lagoon educational efforts.
Todd has created a VERY EASY way to convert cubic feet per second (the language of the ACOE/SFWMD discharges) into gallons. All you have to do is click on this link below and put in the numbers. Seriously.
For instance if you click on the link today, it will show that S-80 is last reported to be releasing approximately 6800 (cfs) cubic per second, down from just under 7600. Just enter 6800 in the top box and it will be converted to 1. gallons per second; 2. gallons per day; and 3. “olympic size swimming pools” (in honor of Stuart News reporter Tyler Treadway’s common example for communicating with the public.)
Go to this link now, and try it! You will be amazed at how east this is. To win this war, we must be able to speak “their” language and to understand.
Click on chart below to get started. Save the link to have it handy for this year. It is going to be a difficult one and we are going to need to know what we are talking about in order to negotiate and to communicate.
Dredge and fill, public photo, 2015.A multi-image of the area in the 1887 NOAA map, the 1925 shot (partially), 1940, a 1958 NOAA map, 1970 and today by Todd Thurlow.
Today’s blog is a full expansion of the 1925 aerial photo I wrote about last Friday.
My brother Todd took this photo creating a time line flight of 1925 and 1940 views of the Sailfish Flats, the Indian and St. Lucie Rivers, and the St. Lucie Canal (C-44).
Todd’s video is a history lesson in “dredge and fill” which was very common throughout all south Florida and the United States until national laws in the 1970s required more scrutiny and often no longer allow such due to heavy impacts and damages on waterways and the natural environment.
Our Martin and St Lucie County canals dug by the ACOE and water management entities C-44, C-23, C-24, C-25 are dredge and fill. Sailfish Point, Sewall’s Point, and Indian River Plantation, just to name a few, have large portions that are dredge and fill. The dike around Lake Okeechobee and the work abound the FPL plant in Indiantown by Barley Barber Swamp are dredge and fill. At the time, it was “how it was done.” People did not foresee the ramifications to the environment or to people living in these areas in the future.
The land was our Play Doh…
1925 aerial by Bob Higgins shared by Sandra H. Thurlow. SLR/IRL
I know you will learn a lot and enjoy watching Todd’s video. The link is above.
—My questions to Todd after I saw the video included:
Jacqui: “So Todd, what are the white lines on the edge of Stuart, Rocky Point etc…more piled white sand? Looks like Jupiter Island was smaller at one point…across from Sailfish…
So how in the world did they dig out the Sailfish Point Marina and what about the straight marina of Sailfish Point that was already there from the days of Mr Rand? Also what about the FPL Pond in Indiantown? Where do you think they put that fill? Holy cow! That’s a lot of fill!
(I have adapted Todd’s words after checking concepts with him so I could present info in a simple manner.)
Todd: “The lines on the edge of Rocky Point were probably a beachy shoreline. With it being more open water at the time and more exposed to the inlet; I’m sure there was more of a beach there. That shoreline matches perfectly the shoreline shown on the early NOAA maps – even before the inlet was there.
With respect to Jupiter Island, you are probably referring to all the spoil that was piled up at the entrance to the Great Pocket – some of that was put there when I was in middle school. The main part of Jupiter Island is more to the east and is now gone – and earlier connected to Hutchinson Island. The old Gilbert’s Bar Inlet was south of that point.
The marina on Sailfish Point was dredge fill. We have some aerials of it in the making. As was the case in areas of Sewall’s Point, the sand dug to build small marinas or subdivisions was piled on the land (Archipelago, Isle Addition) to make the land higher or to create completely new lands.
As far as the giant FPL pond, they probably just dug with a dragline and used the fill to make the dike around the outside of the pond and also to build up the land around FPL.”
Hmmm?
So we live in an environment altered by our forefathers, and now we are experiencing unintended consequences to the health of our St Lucie River/Indian River Lagoon. We must assist the next generation in understanding the past so that we and they can create a better water future. And that we can!
Official seals are as ancient as Mesopotamia. Whether ancient or modern, seals symbolize what is important to us and how we see ourselves. Throughout history, seals are often recreated to represent new perceptions and values. All seals, of every era, hold great historic importance. Let’s take a look at the seals of Martin County, Florida, and its surrounding municipalities.
Recently my mother, historian Sandra Henderson Thurlow, gave a presentation at Indian River State College. I was intrigued by the early seal of Stuart and its changes throughout the years.
I was also struck that the St Lucie River, the original reason people moved to our area, was removed in favor of the sailfish and ocean sometime in the 1970s or 80s. I was also struck that the Railroad was so prominent, and today we are fighting it. —-Today the prominent symbol is a sailfish. A sailfish is certainly a wonderful and attractive symbol, however, it seems repetitive in that both Martin County and the City of Stuart use the sailfish. View both seals below.
Martin County sailfish.City of Stuart sailfish.
Let’ s reflect. Stuart became the sailfish capital of the world in the 1930s and 40s, very cool, but Stuart was originally named “Stuart on the St Lucie ” for the river….Stuart became a city if 1914; Martin became a county in 1925.
In any case, how much do we promote sports fishing since it is the symbol of both the city and the county? The sports fishing industry a huge money-maker and is directly related to the health of the St Lucie River/Indian River Lagoon. If the river is sick, and the polluted canal plume waters from C-23, C-24, C-25, C-44 and Lake Okeechobee are belching off our inlet, it is more difficult for the sailfish to have a successful spawning season.
Why isn’t the river at all represented anymore?
It’s all tied together— the river and the inlet ocean area…partially due to the degradation of our waterways we are really no longer truly the “Sailfish Capital of the World.” How can we become the sailfish capital of the world again?
How can we honor our sailfish history and have an eye for a better water future? Is it time for updated seals? Should Stuart and Marin County both be sailfish? What do you think? I suppose the most important questions are: “What is most important to us today, and what do we really stand for?”
Stuart City seal 1914 with East Coast Railroad Bridge over the St Lucie River and docks. No auto bridge. Image shared by Sandra Henderson Thurlow.City of Stuart seal showed the railroad and an auto bridge over the St Lucie River in 1978. Seal taken from city stationary. Courtesy of Sandra Henderson Thurlow.City of Stuart seal changed to sailfish sometime after 1978. (Sandra Henderson Thurlow)
Here are some other seals of Martin County’s incorporated cities and towns:
Town of Jupiter Island, palm tree and wavy waters, 2015.Town of Sewall’s Point seal brown pelican and satin leaf plant unique to its hammock, 2015.The Town of Ocean Breeze does not appear to have an official seal that I could find, but this image is displayed often, 2015.
Aerial photo of plume from C-44; C-23, C-24, Tidal Basin, and 10 Mile Creek, along Jupiter Island south of St Lucie Inlet. Photo taken at 1000-1500 feet on 10-10-15 through a green glass canopy. Jupiter Narrows, part of the Indian River Lagoon, is visible west of Atlantic Ocean. Photo Cam Collins/Pilot Ed Lippisch.
Today I will be sharing aerial photos of the recent plume along Jupiter Island south of the St Lucie Inlet, taken this past Saturday, October 10th at 9:34 am. These photos are courtesy of friend Mr. Cam Collins. My husband, Ed, took Cam up in an acrobatic plane, the Extra 300, a plane I have not flown in yet. Doing “Half-Cubans” and “Loops” over the Atlantic Ocean is not my favorite way to see the St Lucie River/Indian River Lagoon….
Typically I am sharing photographs taken in the Legend Cub, an open aircraft; most photos are taken at around 500 feet. Cam’s photos are taken at about 1000-1500 feet, thus there is a much broader perspective. The effect is powerful.
I was surprised to see the giant plume considering the major rain event from tropical activity occurred on September 17th, 2015, over three weeks ago. Out of curiosity, I went back and looked at the ACOE Periodic Scientists Call information to review what the release numbers from C-44, C-23, C-24, the Tidal Basin, and Ten Mile Creek have been. No Lake Okeechobee so far. This is what I found:
8-25-15/8-31-15 was reported at 1985 cfs (cubic feet per second)
9-8-15/ to 9-14-15 was reported at 2108 cfs
9-15-15/9-21-15 was reported at 5877 cfs (rain event)
9-22-15/9-28-15 was reported at 2311 cfs
9-29-15/10-5-15 was reported at 1418 cfs.
Cubic feet per second is very hard to understand. For reference, I can share that at the height of releases from Lake O during 2013, the cfs were between 5000 and 7000 cfs at S-80. (http://www.midtel.net/~dccinc/sample_graph.html)
SFWMD discharge chart via ACOE 10-6-15.
So I wonder how long it takes the discharge water to travel through the St Lucie River/Southern Indian River Lagoon and out of the St Lucie Inlet? September 17th’s rain event was three weeks ago? It seems that water would have passed through by now…..what water is the water in Cam’s photographs? Is October’s plume September’s water? If you have an idea, please write in.
——In any case, thank you Cam and thank you Ed. We will continue to document the discharges, Lake O or otherwise, that are killing our St Lucie River and Indian River Lagoon.
SFWMD canal and basin map. These canals have expanded the basin of the SLR/IRL 5 times or more its natural water flow. (Florida Oceanographic Society)Cam Collins, 10-10-15.2.3.4.5.6.
To get involved, advocate, and learn about St Lucie River/Indian River Lagoon issues please attend a Rivers Coalition meeting: (http://riverscoalition.org)
St Lucie Inlet, plume exiting SLR at Crossroads of SLR/IRL. 10-3-15. Photo Dr Scott Kuhns.
I am supposed to be on a blog break, but I did not want to miss the chance for Dr Scott Kuhns’ photos to be documented. Dr Kuhns has a much better camera than Ed or myself who use our iPhones. These photos were taken on Saturday, October 3, around 11:00am, 2015, with a Nikon D750.
So far this year, the St Lucie River/Indian River Lagoon has avoided the releases from Lake Okeechobee, and we were fortune that Hurricane Joaquin did not hit Florida which certainly would have filled up that lake. Nevertheless, we have been getting the discharges from regional canals C-23, C-24, C-44 and C-25 up in Ft Pierce.
While this fresh water is running off Martin, St Lucie, Okeechobee, and Indian River County, and being dumped to tide through our ailing rivers, Lake Okeechobee is filling up from the Kissimmee and other tributaries.
10-3-15 plume rounds Jupiter Island south of St Lucie Inlet, Hutchinson Island over near shore reefs. Sailfish Point on right. (Kuhns)10-3-15 —-(Kuhns)10-3-15 over Sailfish Point. (Kuhns)SFWMD discharge chart from ACOE Per. Scientist Call 10-29-15SFWMD basin/canal map, 10-29-15.SFWMD salinity chart SLR Roosevelt Bridge.10-29-15.Thie big picture… image courtesy of the EF.
Lake Okeechobee’s level today is at 14.77 NGVD. (http://w3.saj.usace.army.mil/h2o/currentLL.shtml) Hurricane Season officially ends November 30th….When the lake gets over approximately 15.5 feet there is a high chance its waters will be directed through C-44’s S-308 and S-80 to the St Lucie River/IRL by the SFWMD and the ACOE.
Presently according to NOAA, there is an El Nino (complicated, but basically a wet “winter” predicted/fewer hurricanes in summer) so this 2016 winter and Florida-spring, during what is normally the “dry season,” it may be rainy.
We must keep an eye on Lake O’s level every day, all year-long. I would still like to get a bank in Stuart to sponsor a “Lake O. Level Screen,” next to the temperatures….like they do in Clewiston. Like Clewiston, the lake affects our lives and livelihoods along the St Lucie River/Indian River Lagoon on an everyday level—– whether we can “see” it or not.
Thank you Dr Scott Kuhns for the quality aerial photographs! Let’s keep documenting, learning, advocating, and affecting change.
C-25 at Taylor Creek, exits into the IRL near Ft Pierce Inlet. (Photo Ed Lippisch 9-2-15)
On Wednesday, my husband Ed and I sat down for dinner. “Did you see my photos of the river? He asked.
“No, I’m sorry, I haven’t looked at them yet…”
“They are pretty dramatic,” he replied, taking a swig of his Lagunitas.
I didn’t think much more about it, but later that evening, when I reviewed his shots, I understood.
Today I will share Ed’s recent photos of the Indian River Lagoon and St Lucie River that he took on Wednesday, September 2nd between 11:30AM-1PM. The first set of photos are from the Ft Pierce area around Taylor Creek where canal C-25 dumps into the IRL near Ft Pierce Inlet. C-25’s discharge can also be from C-24 or C-23 as they are all connected and can be manipulated to flow in different ways by the South Florida Water Management District. C-25, C-24 and C-23 ARE NOT connected to Lake Okeechobee. These photos are just showing rain runoff and all that is carried along with it and brought in by rising ground waters.
Canal and basin map SLR/IRL. (Public, SFWMD)Drainage changes to the SLR. Green is the original watershed. Yellow and pink have been added since ca.1920. The watershed has been unnaturlaly expanded to include up to 5 times the amount of water in the natural watershed.LO is the final blow when it comes. (St Lucie River Initiative’s Report to Congress 1994.)SFWMD chart showing flow into C-25 over past days.
I believe there have been recent improvements made at Taylor Creek (C-25), but perhaps there should be more as the outflow still looks like an oil spill. A cocktail of agriculture, development, residential, and road runoff….a “river of death…”
Once a reader wrote me saying,” Jacqui I like your blog but when it rains anywhere in the world there are these freshwater plumes….you are being misleading….”
I nicely replied. “I agree there are freshwater plumes all over the world, but I have to say, ours in the SLR/IRL region are beyond freshwater-soil plumes…they are deadly, full of heavy pollution. You can read it on agency web sites if you look hard enough…It is unnatural…and it is killing the St Lucie River/Indian River Lagoon.”
C-25 Canal in Ft Pierce. 9-2-15. (EL)C-25 discharging into Taylor Creek and the Marina, IRL Ft Pierce. 9-2-15. (EL)9-2-15 EL9-2-15 EL9-2-15. EL
_____________________________________
This second set of photos is from the same day, but further south along the Indian River Lagoon where it meets the St Lucie River at Sewall’s Point. Here you will see a plume at Hell’s Gate, not so dramatic as the C-25 plume, but a definite plume nonetheless.
The ACOE did recently dump BASIN runoff from around the C-44 canal (see map above) in preparation for ERIKA, but they DID NOT dump from Lake Okeechobee. In fact the canal is higher than the lake. I think this blog makes clear we have enough problems even with out releases from Lake Okeechobee.
Well, hope you learned something. Have a good Labor Day weekend as we honor the American Labor Movement and the contributions laborers have made to the strength, prosperity, and well-being of our country. —Sounds like just who we need to rework our canals….
ACOE/SFWMD slide showing breakdown of runoff into SLR. (9-1-15)ACOE website shows no releases from S-308 or Lake O.
ACOE website does show releases from S-80. In this case this is from the C-44 basin only. The basin is huge and mostly agricultural. See above chart.Plume at Hell’s Gate St Lucie River, west side of Sewall’s Point. This water is from rain runoff probably from C-44, C-24, and C-23 unless the SFWMD is dumping C-23 and C-24 through C-25 in Ft Pierce. (Photo EL 9-2-15)9-2-15 EL Another angle of Hell’s Gate and SP, SLR9-12-15 ELIncoming tide still clear around southern tip of Sewall’s Point. 9-2-15 EL –Hell’s Gate jutting forward far left.Confluence of SLR/IRL between Sailfish Point and Sewall’s Point. St Lucie Inlet in full view. (Photo EL 9-12-15)EL 9-2-15. Another view. Sailfish Point, SLR/IRL This areas seagrasses have still not recovered from 2013 even though water is blue in this photo.Sailfish Flats in distance SLR/IRL EL 9-2-15.
1909 map of South Florida from the State of Florida report: “Report on the Drainage of the Everglades of Florida, By J. O. Wright, Supervising Drainage Engineer.” (Courtesy of Dr Gary Goforth.)
Just say “No!” To wasteful canals that is….
There are over 2000 miles of canals draining precious fresh water off South Florida; it’s a good idea to know the main ones. I started thinking about this after going through some old files and finding this awesome 1909 Map Dr Gary Goforth shared with me showing a plan in 1909 to drain the Everglades and Lake Okeechobee WITHOUT killing the St Lucie River/Indian River Lagoon.
1909 map of South Florida from the 1909 State of Florida report on the Drainage of the Everglades of Florida, By J. O. Wright. (Goforth)
Well as they say: “The rest is history….” As we know, the C-44, or St Lucie Canal, was later built.
So when I was looking on-line for a good map to show the canals of South Florida today to compare to Gary’s canal map of 1909, believe it or not, I could not find one! One that was well labeled anyway. So I made my own.
It’s pretty “home-school” but its readable. From left to right, below, you will see canals Caloosahatchee, (C-43); Miami, (L-23); New River, (L-18); Hillsboro, (L-15); West Palm Beach, (L-12); L-8 that never got a name as far as I am aware; and St Lucie, (C-44.) I do not know why some are labeled “C” and others are “L,” but you can follow them to see where they dump.
I believe the first two built were the Miami and the New River— by 1911, as I often see those two on historic maps prior to 1920. Today our state canal plumbing system is outdated and wasteful sending on average over 1.7 billion gallons of fresh water to tide (to the ocean) every day. (Mark Perry, Florida Oceanographic.)
Even though I grew up in Stuart, I was never really taught about the canals. As a young adult and even older, I drove around for years not knowing about these canals and others like C-23, C-24, and C-25. If I “saw” them, I did not “recognize” them. I knew the land had been “drained” but really had no conception of what that meant or the extent thereof…
I remember my mom used to say if we were driving around in Ft Pierce in the 80s, “And to think there used to be inches of water covering all this land at certain times of the year….” I just stared at her but didn’t really “get it.” The pine trees flashed by and it seemed “impossible” what she was saying…
In any case, the young people today should be learning in detail about these canals so they can be “updated,” “refreshed,” “reworked,” and “replugged.” Say “no” to old-fashioned canals, and “hello” to a new and better South Florida!
South Florida major canals: L to R. Caloosahatchee, Miami, New River, Hillsboro, West Palm Beach, L-8, and St Lucie. (SFWMD canal map 2013)
Below is a history of the South Florida canals as written in an email to me by Dr Gary Goforth. It is very enlightening. Thanks Gary!
Hi Jacqui
As you know, plans to manage the level of Lake Okeechobee (by discharging to tide) in order to develop and protect the agricultural lands south of the lake were developed before 1850 and evolved through the mid-1950s.
1. Buckingham Smith, Esq. in 1848 proposed connecting the Lake with the Loxahatchee River and/or the San Lucia (report to the Sec. of the US Treasury; copy available).
2. In 1905, Gov. Broward rejected a proposal to lower the Lake with a new canal connecting to the St. Lucie River.
3. Attached is a 1909 map of South Florida from the 1909 State of Florida report “Report on the Drainage of the Everglades of Florida, By J. O. Wright, Supervising Drainage Engineer”. The importance of this map and report is the recommendation to manage the water level in Lake Okeechobee via drainage into multiple canals from the Lake to the Atlantic Ocean – but NOT the St. Lucie Canal. The primary canal for moving Lake water to the Atlantic was to be the Hillsboro Canal which would connect the Lake to the Hillsboro River in present day Deerfield Beach / Boca Raton. Note the recommendation is to construct what is now called the “West Palm Beach Canal” and route Lake water into the Loxahatchee River and then out to the ocean via the Jupiter Inlet – this is actually being accomplished as part of CERP and the Loxahatchee River restoration program.
4. In 1913, the State accepted the recommendation of an NY engineer (Isham Randolph) to construct a canal connecting the Lake to the St. Lucie River (report available). The Everglades Drainage District was formed the same year, and was responsible for the construction of the canal and associated locks/water control gates. (historical construction photos available). Construction lasted from May 1915 through 1924, and the first Lake discharges to the St. Lucie occurred June 15, 1923 (ref: Nat Osborn Master’s thesis 2012, copy available)
5. After the 1928 hurricane, the State asked for and received federal assistance. The canal was enlarged by 1938; new St. Lucie Locks was rebuilt in 1941; the new spillway was constructed in 1944. —Dr Gary Goforth (http://garygoforth.net)
Today I will try to provide some insights for every day people trying to figure out what a basin management action plan is, why we have one, and how we are doing so far….
Before we begin, we must first note that in 2002 the state of Florida declared the St Lucie River “impaired.” Impaired as in “its health”— with too much nitrogen and phosphorus and other pollutants from fertilizer and other sources that run off agricultural and developed lands…If you want, you can read the 2002 report below.
Today we hear more about BMAPs (Basin Management Action Plans) and TMDLS (Total Maximum Daily Loads) than the original impairment report, but we must be aware that the only reason we have a BMAP is because the river is “impaired.” A BMAP is put in place by the state to “fix” impaired water bodies.
Our Martin County/St Lucie St Lucie River (SLR) impairment is compounded by the fact that the watershed has been heavily altered over the past 100 years. The Everglades Agricultural Area (EAA) south of Lake Okeechobee blocks the natural flow of Lake O. water going south to the Everglades; therefore the “overflow” waters of Lake Okeechobee are released into the St Lucie.
On top of that are canals C-23, C-24, C-25 that go way out west expanding the St Lucie River’s basin, draining parts of Okeechobee and St Lucie counties and even waters of the St John’s River that used to go north once located near Vero! Road runoff, marinas, agriculture, our yards, tributaries, non-functioning septic tanks, and other things all add up to create a pollution cocktail encouraging toxic algae blooms that kill seagrasses and wildlife and lower our property values for the entire area.
According to the St Lucie River Initiative our canals expanded the “flow” into the St Lucie River by as much as five times what Nature intended. See map below. The BMAP doesn’t really deal with this problem; it does not try to reroute these canals, it rather tries to “better the situation” we are in now as far as water inputs.
Drainage changes to the SLR. Green is the original watershed. Yellow and pink have been added since ca.1920. (St Lucie River Initiative’s Report to Congress 1994.)
So with that in mind, let’s get back to the state of Florida’s created Basin Management Action Plans implementing “total maximum daily loads” (TMDLs) for nitrogen and phosphorus. “Everyone” is part of lowering their loads to the river through building projects that help lower loads and implementing Best Management Practices for fertilizer etc…. Everyone in the basin that is. (Not Lake O- They have their own plan). Not everyone is an equal polluter but everyone tries to lower their load.
The stakeholders agreeing to do projects and implement Best Management Practices to lower their inputs are:
Agriculture
City of Fort Pierce
City of Port St. Lucie
City of Stuart
FDOT District
Hobe St. Lucie Conservancy District
Martin County
North St. Lucie River Water Control District (NSLRWCD) 10
Pal Mar WCD
St. Lucie County
Town of Sewall’s Point
Troup-Indiantown WCD
These stakeholders work together with the help of DEP, the Department of Environmental Protection, and others to lower their measured inputs of Nitrogen and Phosphorus into the river over a period of fifteen years, in five-year increments beginning in 2013. The draft report now is just reviewing the first two years of the first five years. We have a long way to go….
This slide of the summary report provides some overall insights. You can see the load originally compared to now and how far they have to go together to achieve the first increment.
DEP chart for SLR BMAP. (Draft 2015)
1.1 Summary of Accomplishments
Table 3 summarizes the projects completed during the second annual BMAP reporting period. These resulted in an estimated reduction of 118,163.3 lbs/yr of TN and 26,998.8 lbs/yr of TP. The reductions are in addition to those projects given credit before BMAP adoption. Therefore, the total reductions to date are 595,952.0 lbs/yr of TN and 157,540.8 lbs/yr of TP, which are greater than the required reductions in the first BMAP iteration of 316,024.2 lbs/yr of TN and 121,250 lbs/yr of TP. These reductions, in addition to those shown as completed in the BMAP, are 56.6% of the required TN reductions and 39.0% of the required TP reductions of the Phase I BMAP.
The progress towards the TMDL TN and TP load reductions in the St. Lucie River and Estuary Basin are shown in Figure 2 and Figure 3, respectively. The first bar in these figures shows the baseline load for stormwater runoff. The second bar shows the current estimated loading with the implementation of projects. The third bar shows the total allocation for stormwater runoff to meet the TMDLs. The line shows the target for the first BMAP iteration. (DRAFT REPORT)
____________________________________
So the St Lucie River BMAP is making “pretty good” progress according to the report. I imagine there is still a lot to improve. It is a process. We are learning….
These programs are definitely a major “participatory decision-making process” to be commended. I cannot imagine what it takes to coordinate this effort! It would be a nightmare actually. I rather just reroute the canals!
In closing we must note the Indian River Lagoon of which the St Lucie River is a tributary, has a BMAP, but it is for the central and northern lagoon not the southern lagoon where we are in Martin County. I don’t quite understand this. The river does not seem healthy in this area either.
Maybe one day soon the southern IRL will soon have its own BMAP too? A very complex process for two very sick rivers…A process we should all try to understand and help with too.(DEP BMAPS http://www.dep.state.fl.us/Water/watersheds/bmap.htm)
Florida BMAPs DEP.Close upList of Florida’s impaired water bodies and BMAPS.
*According to the Department of Environmental Protection: a BMAP is a “blueprint” for restoring impaired waters by reducing pollutant loadings to meet the allowable loadings established in a Total Maximum Daily Load (TMDL). It represents a comprehensive set of strategies–permit limits on wastewater facilities, urban and agricultural best management practices, conservation programs, financial assistance and revenue generating activities, etc.–designed to implement the pollutant reductions established by the TMDL. These broad-based plans are developed with local stakeholders–they rely on local input and local commitment–and they are adopted by Secretarial Order to be enforceable.
*Also for the first five years of the fifteen years the BMAP will take place, the stakeholders are getting extra credit because their SLR BMAP” credit includes storm water management strategies and projects that have been put in place since 2000 or will be implemented during the first five years of implementation June 2013-June 2018).”
I am adding a comment from Dr Gary Goforth to this blog post at 1:00 PM 8-13-15. I think his professional insights are helpful even to the lay person; he did attend the BMAP meeting yesterday; and he is a regular contributor to my blog. Thank you Gary. (http://garygoforth.net)
3-18-15 at 7:17 AM Gary Goforth commented on 2015 Annual Update, St Lucie River and Estuary Basin Management Action Plan, SLR/IRL
Inside cover of the Draft 2015 SLR BMAP Report. I …
Hi Jacqui
I am very familiar with the TMDLs and BMAP for the St. Lucie River Basin. I attended the BMAP progress meeting yesterday along with Mark Perry and others. There were nice updates by Diane Hughes and her counterpart in St Lucie County on construction and operation of what should be good, effective projects for reducing nutrient loads to the St. Lucie River and Estuary. It is clear that local communities and others are working hard to reduce nutrient loading.
However that’s where the good news ended.
While the progress report leads the public to believe that great strides have been made by landowners in cleaning up their stormwater pollution, unfortunately the BMAP process and progress reporting is seriously flawed and present an overly optimistic assessment of the region’s water quality, and the progress made towards achieving the desired endpoint. I expressed this opinion to FDEP, FDACS and SFWMD staff at the meeting yesterday, with the following support:
1. The nutrient loading data in the progress report are not real (measured data), rather they are a combination of potential load reduction estimates superimposed on simulated data. No where in the progress report will you find the observed amount of nitrogen or phosphorus that actually entered the St. Lucie River and Estuary during 2015. As was discussed at the meeting, FDEP does not plan to bring real data into the progress reports until 2017.
a. The real data show a very different story, for example, phosphorus loading from the C-44 Basin (excluding Lake releases) has increased more than 50% from the 1996-2005 Base Period.
b. Until real data are shown, there can be no assessment of how well the BMAP program is working, and no mid-stream corrections will be made.
c. The majority of load reductions are attributed to agricultural land uses as a result of BMPs. However, FDACS and FDEP staff acknowledged that they have not yet documented the actual effectiveness of any ag BMP in the region – they repeatedly stated they were short on staff.
2. The progress report (and the BMAP) ignores the nutrient and sediment load from Lake Okeechobee discharges. In the 2015 reporting period, the assessment ignores over 400,000 pounds of nitrogen and 47,000 pounds of phosphorus that entered the River and Estuary from the Lake. And don’t expect future reports to reflect this loading – the BMAP process will continue to ignore loading from Lake Okeechobee, assuming instead that the Lake will achieve its own TMDL (another sad subject altogether).
3. The nutrient loads for the BMAP base period are not the actual loads that occurred in each of the basins – instead it is a simulated load that differs up to 25 percent from the observed load. Without an accurate base period load, true progress cannot be assessed.
I could go on for a while; I made many more suggestions how to improve the process and will follow up with written comments to the FDEP.
A pipe into the Indian River Lagoon from a cottage along the Indian River Drive goes directly into the river disposing of sewage. In our Treasure Coast’s regions’ early days there were no laws prohibiting this. Photo archives of historian Sandra Thurlow. ca late 1950/60s.
It’s been a tough week for river lovers.
It was reported by the Stuart News and others that a gentleman died suddenly after being “stuck by a fish.” He had put in his line in the Indian River Lagoon, near Harbor Branch, in St Lucie County. Just a few days later, the headlines noted the experience of Mr Bruce Osborn whose “knee and leg turned black, swelled up, and became hot to the touch after he dove into the confluence of the St Lucie River/Indian River Lagoon. Mr Osborn was boating near the Sandbar which is located within sight of the St Lucie Inlet…
Mr Osborn had an open sore….he recovered with prompt, emergency-room, antibiotic-treatment and a good wife.
Today in Stuart New’s “Letters to the Editor” a retired New York sheriff is of the opinion that the news of the fisherman had been “sensationalized” noting that “no autopsy had been performed on the man– who died…..”
Who is right? Who is wrong? Or does “truth” lie somewhere in between?
Who knows…But it is all certainly worth thinking about.
Interestingly enough, in this river or near-ocean story, the culprit would not be a shark or anything scary like that, but rather a microscopic bacteria or virus that cannot even be seen….
Bacteria is everywhere. In soil and in water. On our skin and in our bodies. For humans there is “good” and “bad” bacteria.
How do we know where there “bad” bacteria is in the river?
Canal and basin map SLR/IRL. (Public) The basin has been expanded at least 5x its natural size since 1920.
I don’t know, but I do know numbers of bacteria everywhere in water communities are highest in the sediment. Sediment is the sand, clay and other soil types that build up on the bottom of the river in the St Lucie River/Indian River Lagoon and all estuaries of the world.
Muck from the bottom of the Indian River Lagoon. (Public photo)
In our area, the most recent hundred years of sediment, this “muck,” has been heavily affected by human alteration of the environment, especially by drainage canals, like C-44, the drainage of Lake Okeechobee, C-23, C-24, and C-25, as well as shoreline development’s tear down of native vegetation along the shoreline. (That can no longer filter runoff.)
Giant, mile-long canals drain mostly agricultural lands from out west. Many if not most of these lands never even drained into the St Lucie River/Indian River Lagoon in the first place. Not by God. Not by Nature. Just by “us” since around 1920.
So now literally thousands of pounds of fertilizers, pesticides, herbicides, metals, oils from cars and roads, septic effluent…..the list goes on and on….so these pollutants run into our waterways building up in the sediments of the river, —-to be re-suspended with every storm, with every boat that races by……as the sediment builds and flocculates, bacteria grows–especially if it is warm..many fish live on the bottom of the river….
Estuary depiction public photo.
On the positive side, as far as water, many things have changed for the better since my childhood.
During my lifetime, in the early 60s, sewage was directly dumped into the St Lucie River/Indian River Lagoon from homes and boats….I swam and skied in this water every weekend….Not many people lived here. As kids, we did not know or notice although we used to make jokes about “logs passing by…”
🙂
And yes, since the 1960s and 70s tremendous improvements in sewage treatment plants, packaging plants, septic systems, “Best Management Practices” for Agriculture to lower runoff, etc…have been made. This is fantastic.
Ag runoff DEP photo.
But we can never catch up….We are always chasing our tail….Because we keep putting more pollution into the system than we can clean up. Like putting too many fish in a fish tank, and not cleaning your gravel often enough…our relatively closed lagoon system has met its limit…
The chart below just goes to the year 2000. Florida is now the third most populated state in the nation with over 19 million people. 19 million people’s’ waste….19 million people’s yards, and not just small time farmers anymore, but agribusiness– hundred of thousands of acres of fields and chemicals….a huge portion seeping into our water. Best Management Practices. That’s just not enough…Oh. Let’s not forget what runs down from Orlando….
What’s the truth? The truth is there are too many fish in our fish tank. And we whether we know the cause or not, until we stop draining so much of our personal and agricultural waste into our waterways, we will continue to “drown in our own filth.”
River Kidz founders Evie Flaugh and Naia Mader, 2011.River Kidz 2015.(Photo Nic Mader.)
“Time flies”… “Time waits for no one”… “Time is of the essence”….
There are hundreds of sayings about time, and none of them can truly encompass its passage and what it feels like to know it is slipping away….
Having no children of my own, I am dependent on the children of others to really see time “fly.” As time seems to fly fastest when it comes to children turning into adults–right before our eyes, while we of course feel “exactly the same…”
I deeply believe that all kids are River Kidz!
The two closest to me are my niece Evie Flaugh, and Naia Mader, two Town of Sewall’s Point girls that founded River Kidz in 2011 when I was mayor. Sometimes they come and visit me. These are some of my favorite days. When they visit, I am struck by how they are changing. They are growing up. They are becoming women.
“10ish” years old when their endeavor started, I think they are now both “15.” Three months apart. Evie is a bit older but they are in different grades. I can’t keep up actually. But I do know they were both once well below my shoulder and they now stand almost a full foot taller than me. I noticed recently, when I sat on the bench with them for a picture, that my feet hardly reached the ground. Their knees were bent…
I look at them in awe.
“Was I that young once?
I was, and boy did want to be older…. This I remember.
Things are going to start changing even more quickly.
They will be driving soon….Gulp….
And where have “we” all driven the river since 2011? The St Lucie River/Indian River Lagoon is in really in the about same predicament it was in 2011. In some areas worse. A lot has happened, and good has been achieved, however, the biggest killer, discharges from canals C-23, C-24, C-25, C-44 and Lake Okeechobee will continue to slowly kill the river with no end in sight, because our state in is denial of the depth and timing of our pollution and water crisis. They think we have 30 years…Oh let’s make that 50 years….no 100….
However awareness is high. As Amendment 1 and our local River Movement has shown, the public is pushing for change; and not giving up. WE ARE MAKING PROGRESS even though it seems sometimes it may take forever, or that we will return to our maker not having achieved the goal.
I am certain that one day there will be substantive positive change for the Indian River and all of Florida’s precious waters. There must be in order for the state to survive. To feed this change and the human will for survival which requires clean water, we must continue to put “gas in the car,” or better yet, use solar energy—- we have to keep making “River Kidz out of kids.” We have to keep driving.
One day soon, these kids will take the wheel of life. I am confident they will drive with more care than previous generations did; they will do all they can to navigate the crash we will be leaving them.
The River Kidz, Naia and Evie, they inspire me. But my heart aches for them. For them we must work harder to change the tide of legislative and agency complacency. We must make more people realize that we do not have 30 years. We have now.
“Be Floridian. Don’t Fertilize.” Photo adapted from “Beauty of Nature” photos sent to me by Anna Marie Wintercorn, 2015.*
The “Be Floridian” program was born over a decade ago of the Tampa Bay area. This program has many elements, but most noteworthy is that “strict” fertilizer ordinances evolved collaboratively along the counties and cities of Florida’s “southerly” east coast.
Today, Tampa Bay has more seagrass than it did in the 1940s. This is in spite of the area’s high population. Certainly, they have different issues than we, and “no Lake O,” but the goal is clear: “if they did it there; we can do it here…improve our waters.”
On Florida’s east coast, in 2010, the peninsular Town of Sewall’s Point, my community, was the first to implement in a strong fertilizer ordnance. With the 2011-2013 melt down of the Indian River Lagoon due to super-algae blooms killing approximately 60% of the northern/central lagoon’s seagrasses, and the toxic “Lost Summer” of excessive dumping from Lake Okeechobee and area canals along the St Lucie River/Indian River Lagoon, communities all along the Indian River pushed their governments to implement strong fertilizer ordinances. —Making a statement that they were “fed-up” with dead waters, and were willing themselves to put “skin in the game.”
In case you don’t know, there are variations, but basically a “strong fertilizer ordinance” is one that does not allow fertilization with phosphorus and nitrogen during the summer rainy/hurricane season.
Recently there was an article in the “Stuart News” asking the question of whether or not these strong fertilizer ordinances are “working” along the IRL. The expert on hand replied it is “too soon to tell…”
I beg to differ, and here is why.
Of course they are working.
A four-year old can tell you they are working.
Ad in Stuart News. Martin County has a strong fertilizer ordinance and is now promoting the BE FLORIDIAN program here in Martin County. Dianne Hughes and Deb Drum deserve applause for these great ads, 2015.
I use this analogy a lot when discussing Lake Okeechobee and the Everglades Agricultural Area’s 700,000 acres south of the lake blocking the natural flow of water from the northern estuaries to the Everglades.
In spite of the sugar and vegetable empires south of the lake trying to convince us that it is water from Orland and the Kissimmee River killing our St Lucie River/Indian River Lagoon, any four-year old studying the River Kidz program will point to the area directly south of the lake as biggest problem forcing the water up and out the estuaries rather than allowing it to flow south as nature intended…We need a third outlet south of the lake. There is too much water to hold it all north. End of story. I don’t need a study to tell me this. I know it. A four-year old knows it. You know it.
Back to fertilizer….last night it rained hard here in Sewall’s Point. My rain gauge says two inches. Seemed like more than that. If my yard had been fertilized of course that fertilizer would have gone into the gutter and down the drain and into the Indian River Lagoon. You can go out and watch this from my driveway.
It must be noted that until the ACOE and SFWMD (collaborating at the direction of our government) stop dumping from the lake and out over expanded canals, we will never know our “area’s” levels of phosphorus and nitrogen.
For example, the ACOE began releasing into our SLR/IRL this January and just stopped a few weeks ago, so if a scientist had done her or her study recently, they would be measuring nutrients that came into our river from “other places” too.
But we, here, are doing our part and can feel good about this…keeping our house in order will help push order in the houses of the state and federal governments that are presently quite un-orderly.
Enforcement? Let’s focus on education. As we can see. It’s working! Five years ago people weren’t even aware that fertilizer was an “issue.”
As a sidebar before I close, I recently had the pleasure of meeting Mr Woody Woodraska who headed the SFWMD in the 1980s before it was under the anvil of the governor and the state legislature. The topic of visiting Cuba arose. My husband Ed and I will be visiting Cuba this fall with our church, St Mary’s.
Mr Woodraska said: “Oh, you are going to love it..”
In the course of telling his story visiting as a competitor in the Ernest Hemingway competition, he alluded to Cuba’s long repressed economy and how this kept fertilizers, via the agriculture industry, from ruining Cuba’s waters, fish and wildlife. Thus overall, Cuba’s waters are healthy and beautiful today.
We here in Florida, on the other hand, have developed every piece of land right up to edge of every river, some with septic tanks, and torn out the native plants and replaced with plants that we must fertilize; agriculture is a corporate producer going through literately tons of fertilizer every day; canals not only to drain our land, but we build houses along them; a turf grass industry flourishes in South Florida that sells 25% of all turf-grass in the WORLD; wonderful universities, like my alma mater and family connected University of Florida, do research and watch the industry’s back to “keeping our economy rolling!”
Yeah…rolling right over our fish, and our wildlife, and over ourselves as we see our own economy suffering from dirty waters.
Whew. I need a cup of coffee.
Sorry to be so opinionated, but I just can’t stand it. Fertilizer that is. In fact I have a file on my computer called DEATH BY FERTILIZER. Here are some pictures; thanks for reading my rant, have a good day, and I will not say “happy fertilizing!” 🙂
Grass going right over edge of canal….photo DEP.Ag runoff from fields into canals DEP photo.An ad from the west coast of Florida, 2014.When it rains a lot all runoff from yards goes into the SLR/IL taking fertilizer, pesticides and herbicides with it. This kills seagrasses by supporting algae blooms Animal and fish suffer. (JTL)Ad west coast near springs.Ad on bus west coast or Gainesville.River Kidz protest Florida legislature’s trying to outlaw local governments from creating stricter fertilizer ordinances than the states. 2012. (Nic Mader)
RK artwork 2011. Save the dolphins. Fertilizer is not good for their skin, or seagrasses needed by the fish they eat.
The National Research Council’s book “Clean Coastal Waters, Understanding and Reducing the Effects of Nutrient Pollution,” National Academy’s Press, 2000, is the best book I have read on this subject. It can be ordered on line.
It is an amazing thing to fly through time and space, and this is exactly what I did yesterday with my brother, Todd. He took me on a “flight” over a 1958/Today St Lucie River, North Fork, and Ten Mile Creek. All the while, the images flashing in and out of past and present….Please watch this short video yourself by clicking the link or image above.
At one point along our armchair journey, I said to myself, “Wow, I don’t feel so great,” –just like sometimes when I am with Ed, my husband, in the airplane. I actually got motion sickness having plastered my face right up to the screen to see every moving detail!
A few deep breathing exercises put the feeling off, but next time I’ll take my Dramamine!
Google Earth image at the northern reaches of what was Ten Mile Creek in St Lucie County. Algae in agriculture canals is very visible.
This flight, as the others you may have experienced on my blog with Todd, is amazing. It allows one to really see what the lands were originally like and how they have been developed as residential homes and endless agriculture fields.
Towards the end of the video, you can even see algae growing in the agriculture canals, off of Ten Mile Creek, St Lucie County–“bright green,” for all to see on Google Earth. I have witnessed these green canals too from an airplane.
Due to drainage canals— leading to drainage canals—leading to drainage canals, this water from the ag fields, and from all of our yards, ends up in the now sickly St Lucie River. This problem is exacerbated by ACOE/SFWMD releases from Lake Okeechobee and the basin area of C-44 in Southern Martin County. These canals and the expanded engineered runoff from the lands is what is killing our river.
It is my hope that with visuals like the video above, future generations will find a way, and want to be a part of a new water and land management generation “seeing” how to improve St Lucie River/Indian River Lagoon. Our generation seems stuck in a quagmire….
Like they say: “seeing is believing,” and seeing provides insight for change.
*Thank you to my brother Todd, for this incredible journey using overlays of aerial photographs taken in 1958 by the United States Government, and marrying these aerials over images from today’s Google Earth. (http://thurlowpa.com)
Northern reaches of the North Fork of St Lucie River, Ten Mile Creek in St Lucie County, 1958. Wetlands showing multiple small ponds are visible. These lands were drained in the 1950s by canals C-24, and further south C-23 and further north by C-25. These canals were part of the USACOE and SFWMD’s effort for more flood control and to expand agriculture and development: These canals are part of the Central and South Florida Flood Control Project of the 1950s which allowed more non flooding development and agriculture, but also destroyed our valuable south Florida waterways.
Radar weather screen shot from 4-29-15. My phone, NOAA site. JTL.
The past two days, I feel like I have been a guest on the TV series “Storm Chasers,” except I have been running from the storms.
Yesterday, I decided I really needed to go look at Lake Okeechobee myself to see the toxic algae bloom that has been reported through social media, TC Palm, and the internet. –The algae bloom that inspired Senator Negron to ask Col. Dodd of the ACOE to refrain from opening the gates, which they did not do. On Tuesday’s, at 2:00 PM, are the Army Corp of Engineers’ “Periodic Scientist Call for Lake Okeechobee” of which I have participated in for almost three years…
“Perfect,” I thought, “I’ll go to the lake for the call a bit early and take some photos. I will be out in Palm City around that time anyway; it’s really not that far…” The drive is about 20 miles.
Signs at Port Mayaca, Indiantown.JTL
In spite of the previous day’s inclement weather, I had not checked the weather closely as I can never figure out how to get radar maps on my phone. Not checking the weather, turned out to be a big mistake.
Satellite photo of Lake O, NOAA. If you look closely, you can see the C-44 canal connecting the St Lucie River in Stuart to the Lake O. This canal runs along Highway 76 in Martin County.Map SFWMD showing canals and basins. Note S-308 or “structure 308” at Lake O, and S-80 east along the C-44 canal. Both of these structures have to open to allow water to flow into the C-44 canal to the St Lucie River, Indian River Lagoon.
Around 1:00 PM, as I approached Port Mayaca going west along Highway 76, suddenly grey clouds in the distance converged overhead spilling out over the sky like black oil. Huge bright lightning bolts struck the ground in the direction of the lake, thunder followed almost immediately; rain dumped out of the sky. …”Oh no, not again…” I thought.
The winds screamed across the landscape. Large trucks coming towards me in the opposite direction splashed wakes hitting my car full force. Eventually, I pulled over at the entrance of DuPuis Wildlife Reserve;” the water was rising on the dirt road. Looking at my surroundings, I realized I was next to the Port Mayaca graveyard where thousands of people were buried in a mass grave after perishing in the 1928 hurricane. I turned on the radio, my windshield-wipers whipping back and forth. The unnerving sound of the Emergency Broadcast System blared and a calm computerized voice said: “Tornado warning for western Martin County.” Shaking, I forced my self to try to find radar on my phone. I found a written tornado warning for Indiantown. I was at ground zero.
All alone with the elements, I wondered what possessed me to do such a thing….I closed my eyes…I prayed…
Within thirty minutes the storm had passed. Thankfully it was not my day to die. I shook off my fear, got my self together, and completed my drive to the lake. This is what I found:
S-308 as, the structure that allows water from Lake Okeechobee to enter the C-44 canal, SLR/IRL. Lake O is in the background.Closer view of S-308 with the beginning of the C-44 canal before its gates. The lake is behind the dike structure.Algae bloom on west side of S-308 gate.West side of S-308 showing all gates. Algae bloom visible.Close up of western side of S-308.Edge of S-308 structure standing on dike, looking east over Lake Okeechobee.East side of S-308 facing the lake.Turning around from S-308 structure to see the rim canal. Dike on left of photo. Lake on left side of dike.
The lake seemed oddly calm after such rage. You could hear a pin drop. I looked around…
Storms tend to break up algae blooms, but under the right conditions of heat and over nitrified water (over-fertilized basically), they come back. In my opinion, this toxic algae issue really forces us all, from the public, to city government, to the office of the Governor, to the state legislature, to the President of the Untied States, and Congress, to ask ourselves the most critical of questions.
“Is it legal for a federal agency to knowingly release toxic water into a local community?”
To me this is situation is different than a toxic algae bloom simply forming in a localized body of water. What we are talking about here is toxic algae being purposefully transferred from one body of water to another, by the government no less…This seems wrong. Un-American.
Then of course there is the other issue, flooding south and around the lake. As I experienced yesterday, things happen very fast around this giant lake, this “big waters,” this Lake Okeechobee.
Take a look again at the first photo I show of S-308 from the bridge. This photo gives perspective of how fragile this dike and structure-gate system is. It is like trying to hold back an ocean with a cement wall. There has got to be a better way to keep our families, healthy and safe….
S-308 is the structure that allows water from Lake Okeechobee to enter the C-44 canal, SLR/IRL. That is Lake O. in the background and the mouth of the C-44 canal in the foreground. This is not much to stop “an ocean of water”…These gates are one set of gates that allow toxic water to endanger communities along the St Lucie River/Indian River Lagoon.
Confluence of St Lucie River/Indian River Lagoon between Sewall’s Point and Sailfish Point, Hutchinson Island, “The Crossroads,” 3-8-15 showing releases from Lake Okeechobee and area canals. (Photo Ed Lippisch)
Usually, my husband, Ed, does not like it when I ask him to “do things”…like take out the trash or blow leaves off the driveway. But he always likes it if I ask him to go up in the plane. He did so yesterday, and was able to visually document the polluted discharges pouring into our St Lucie River/Indian River Lagoon.
Yes, once again.
The Army Corp of Engineers (ACOE), and the South Florida Water Management District (SFWMD) agreed to have the Army Corp start releases this year on January 16, 2015 at 200 cubic feet per second (cfs) through S-308 into the C-44 canal which is attached to the South Fork of the St Lucie River, and then in turn is connected to the Indian River Lagoon “my town,” Sewall’s Point.
Exhausting isn’t it?
The ACOE is now discharging at a rate of “950 cfs.” This rate goes up and down. It is going up because Lake Okeechobee is not going down…
This SFWMD basin map also shows S-308 at Lake O, the C-44 canal, S-80 at St Lucie Locks and Dam, SLR/IRL.
Today I will share Ed’s photos and show how to “see” how much the ACOE is releasing at S-308. (Structure 308) which is located at Port Mayaca, in Indiantown, Martin County.
Ofcouse, there are discharges from area canals C-44, C-23, C-24 and C-25 as well, but today for simplicity’s sake, I will focus on the lake discharges today, which in my opinion, are the worst of all anyway—because they are not at all “ours.”
So—–
You can search “Jacksonville, ACOE” or just go to this link: (http://w3.saj.usace.army.mil/h2o/reports.htm). You can then very quickly check two things: Lake Okeechobee’s level and how much the ACOE is dumping at S-308 from the lake.
To do so, after accessing the site, go to “Current Lake Okeechobee Water Level” at the top left: Always one day behind or so, the latest date reported is 3-7-15– Lake O is at 14.71 feet. Then go back to the main page to the last link: “Port Mayaca Lock, S-308 Spillway.” View by date; the last date shows 873 cubic feet per second (cfs) being discharged.
Front page of ACOE Lake O website, 2015.3-9-15 Lake O level 14.71 feet. NVGD.S-308 report shows 873 cfs on 3-7-15 going into C-44 or SLR.
Here are some more photos Ed took yesterday, 3-8-15, of the SLR/IRL.
West side of Sewall’s Point, 3-8-15 showing St Lucie River. (Ed Lippisch)East side of Sewall’s Point, 3-8-25 showing Indian River Lagoon. (Ed Lippisch)Southern tip of of Sewall’s Point showing SLR in foreground and IRL in background. 3-8-15. (Ed Lippisch)Known as the “Crossroads” this area off of S. Sewall’s Point is the confluence of the SLR/IRL. The St Lucie Inlet is just off of the tip of S.Hutchinson Island and is known as Sailfish Point and is blocked in the far upper right of this photo. 3-8-15. (Photo Ed Lippisch)St Lucie River/Indian River Lagoon near Sewall’s Point and Sailfish Point, Hutchinson Island. “Crossroads.” (Photo Ed Lippisch)SL Inlet in distance, 3-8-15. (EL)3-8-15. IRL. East of Sewall’s Point. (EL)
When Ed got home, he said I was lucky I did not go up with him as it was windy which means bumpy…He also said the plume looked different from what we have seen before. It looked “chalky” as is seen in these two photographs below and extended about two miles off shore and further south of the St Lucie Inlet.
I am no scientist, but I would imagine this is silt/suspended solids in the water as everything is “stirred up” from the wind. Suspended solids falling on and smothering our reefs….
Plume off St Lucie Inlet, 3-8-15. (EL)Plume another view 3-8-15. (EL)Map showing reefs in Marin and Palm Beach counties. The reef in MC is directly impacted by the discharges from Lake O. (map courtesy of state.)
In closing, I must thank my husband for the photos, and I must point something out.
This area around Sewall’s Point and Sailfish Point, this “confluence” of the St Lucie River/Indian River Lagoon, in the not too distant past, has been documented as the most bio-diverse estuary in North America (Dr. R. Grant Gilmore, senior scientist with Estuarine, Coastal and Ocean Science, Inc., (ECOS)(http://www.floridaoceanscouncil.org/members/bios/gilmore.htm).)
The map below allows us to see where these precious seagrass beds are/were located. The map above shows where our “protected” near shore reefs are located just outside the St Lucie Inlet where the discharges go out to sea. These reefs are the northern most “tropical reefs” on the east coast of Florida…
SFWMD seagrass map, 2015.
I think it is a truly a sin that the ACOE and SFWMD year after year discharge onto these productive sea grass beds and near shore reef habitats that are the breeding grounds for thousands of fish and sea creatures. Its loss is felt all the way up the food chain, including “us.”
Where is the Department of Environmental Protection? Where is the Florida Wildlife Commission? Where is NOAA?
Not to mention, last year a designation of “Critical Wildlife Area,” —the first in 20 years for Florida—for 30 plus species of nesting and resting protected birds, was established on “Bird Island,” located just 400 feet off south Sewall’s Point….”Now” is right before nesting season’s height. Where will the birds find food when the seagrass beds are covered in silt and the water is so dark they can’t really see? Chances are these releases will continue.
Don’t our state agencies have a duty to protect? Don’t they have a voice or has it been muffled? Not a word? Not a peep. Where is our governor? Isn’t this money? Isn’t the productivity our of waterways linked to our businesses? Our real estate values? Where is our local delegation? Have we all become numb to this destruction? Beaten down and manipulated so long we that have no reaction?
It breaks my heart.
Our state and federal government entities responsible for “protection” especially should hang their heads in shame.
If nothing else “speak out” about how bad it is. Recognize the loss. Address the “constraints,” killing this ecosystem and local economy. Take leadership!
Be true to our heritage. We are the United States of America. Be brave. Speak out!
National Geographic’s February 2015 issue has an article entitled “Treading Water,” which discusses among other things, sea level rise and the future loss/threat to sugarcane and oranges south and around Lake Okeechobee in Florida. (NG, photo of page 119.)
My husband Ed was out of town on Friday, so I thought I would get some reading done on something other than the St Lucie River/Indian River Lagoon. That evening, with the dogs at my feet, I began reading the February issue of National Geographic magazine, a publication my parents filled our family home with, and I have kept subscribing to as a window to the outside wonders of our world.
After reading articles on the terrible trauma of “blast force” to US soldiers that served in Iraq and Afghanistan; Hawaiian identity and the sea; and the amazing microscopic revelations of mites; —–at the very end of the magazine, there was an article entitled: TREADING WATER about climate change, seal level rise, and South Florida.
The article focused quite a bit on a Dutch company that sees “profit rather than loss” in floating houses in trendy Miami, but also mentioned a few things that had little silver lining such as an insert on page 112, entitled, “Home on the Water.” This insert briefly noted the 2,100 miles of canals, (that we are all so familiar with), that have been built over the past century to drain the Everglades and empty the state’s water mostly into the Atlantic Ocean. (FOS, 1.7 billion gallon a day on average….)
According to the article, if there is two feet of sea level rise, conservatively predicted by 2060, the gates draining the lands around lake Okeechobee and the Everglades, “will no longer work…”
I’ll be 95 in 2060….hope I can get out of the nursing home to see….
National Geographic page 112. “Given two feet of sea level rise, more than 80 % of the gates will no longer work.”
The article also notes “two key” very threatened and very profitable agricultural industries: sugarcane and oranges.
National Geographic magazine’s February 2015 issue article “Treading Water,” shows locations of sugarcane in the Everglades Agricultural Area, and orange groves both north and south Lake Okeechobee. (NG, photo of page 119.)
Food for thought….
Sea level rise is a factor I deal with as a commissioner in the Town of Sewall’s Point and have been exposed to through the Florida League of Cities. The sea has risen before and it is rising again. Too bad humanity is speeding things up, but we are…
After listening to many state agencies and scientists speak on the issue, I personally do not believe Florida will be abandoned or”sink.” I think it will rise in new form, adapting to change as humanity has done for thousands if not millions of years.
Nonetheless, if I owned sugar groves in the Everglades Agriculture Area, I’d have an exit strategy; if I worked for the Army Corp of Engineers, or South Florida Water Management District, I would reexamine the plumbing; and if I were Florida’s governor, or legislature, I would be talking to scientists about the advantage of fresh water on the land south of lake, pushing back salt water coming up from below and providing drinking water in the future to all those people living on floating houses in Miami…
So much for reading about the “rest of the world”…our St Lucie River/Indian River Lagoon/ Everglades issues are inescapable!
Town of Sewall’s Point: (http://sewallspoint.org )—FEMA houses being lifted, flood map changes are just a few of the things the town is dealing with in regard to sea level rise.
“Chronology of Water Management Changes” map. Reconstructed pre-drainage landscapes, source, McVoyet al., 2011. Presentation of Robert Johnson, Director of South Florida Natural Resources Center at Everglades National Park,Everglades Coalition, 2015. (With words added: “Water Started Flowing South 2014, JTL”.)
After the horrendous “Lost Summer of 2013,” and public outcry, more water has been sent south to the Everglades by the Army Corp of Engineers and South Florida Water Management District in 2014/15 than in the past ten years. But we are still drowning…
Hanging over our heads is the fact that Lake Okeechobee is at 15.04 feet today, and chances are that to prepare the lake for a predicted El Nino rainy winter/spring, the ACOE is going to “have to” start releasing water soon. Although it’s being worked on right now, the system is not even close to being able to hold the ocean of overflow-lake water and “send it south….” plus we are handcuffed by 10 parts per billion phosphorus goals.(http://www.sfwmd.gov/portal/page/portal/xrepository/sfwmd_repository_pdf/derivation_wqbel_stas_toc_4-20-10.pdf)
With this in mind, the Everglades Coalition’s 30th Annual Conference (http://evergladescoalition.org) was a whirlwind; its theme “Send it South: Water for America’s Everglades.”
Let’s begin, by looking at some water/land maps and think about the big picture.
The image below is a “simplified chronology of water management changes,” and shows the canals and structures that waste water to the ocean destroying our precious estuaries. This map was shared by Robert Johnson during the coalition meeting. It made a big impression on me, because it gives historical perspective, is simple, and is clear.
Map again from above to review.
The red lines are canals that drain lake Okeechobee. We know them well: the Caloosahatchee (C-43); the Miami: the North New River: the Hillsboro: the West Palm Beach; and our own St Lucie (C-44). The grey shows the Herbert Hoover Dike built around Lake Okeechobee in the 1930s after the terrible hurricanes of the late 1920s; the Eastern Protective Levee is also in grey, on the far right, and basically is like a giant underground wall between the Everglades and eastern coastal development; the Everglades Agricultural Area Levee System, which I think is the grey line depicting a structure built south and almost around the Everglades Agricultural area; the Water Conservation Area Levees (WCAs-areas where water slowly travels south after being cleaned in Storm Water Treatment Areas (STAs) above them) are the grey lines around the WCAs; and last on this chart, the South Dade Conveyance System…
There are other canals as well. Thousands of miles of them….
These canals make our lives a living hell along the Indian River Lagoon, and must be re-plumed, but we must note that they also have allowed South Florida to rise above the poverty of our ancestors, and to develop some of the world’s most “productive” sugar and vegetable farms. Too bad they had to build their riches south of Lake Okeechobee blocking the flow of the lake! Also, much of this drainage system has allowed development of the east coast of south Florida, inside the Everglades’ boundary which is in yellow on the map above and red below.
The red line, shows were development has “crept into the Everglades.” This is obviously a problem for sending water south. Therefore, whatever is created to “send more water south,” must be created so as to avoid destroying lives or property.
West of the red lines shows the edge of what was once the Everglades in South Florida. Development has crept and continues to creep over this edge. (Photo/map courtesy of Chappy Young,/GCY Surveyors, 2014.)
So narrowing this down to “our” needs, how does one build a way to send more water south? And aren’t we already doing that? Let’s look at the projects being built first before we conclude our goals for more storage.
There are many projects on the books to help with sending water south: some include CERP (http://www.evergladesplan.org/about/about_cerp_brief.aspx) and CEPP…(http://www.evergladesplan.org/docs/fs_cepp_jan_2013.pdf), in fact parts of the Tamiami Trail are being raised right now, but according to many experts at the coalition, one thing is missing, enormous amounts of LAND. Land would help these projects come into being. There must be land to hold some of the tremendous amounts of water, and to clean it. Also realistically, the above projects will take generations to complete. Land purchase or no land purchase.
One thing is for sure, more land south of the lake would help the situation tremendously. As even a five year old can see, lack of lands south of the lake is the true disconnect. But where is there that much land and what are our options?
Below is a map of “Option 1,” and “Option 2”, lands in the Everglades Agricultural Area, lands that US Sugar agreed to sell in 2008. These lands remain for sale.
Perhaps US Sugar rather not sell these lands anymore. In 2008 they were going broke, but today, ironically after an infusion of cash from the South Florida Water Management District that was given to buy the paired down 26,800 acres purchased, and since the economy has improved since, US Sugar is thriving again.
But a “contract is a contract,” and thus there remains a contract allowing for the state of Florida to buy the option lands.
General consensus for many at the Everglades Coalition meeting was “buy the lands” with the new Amendment 1 (http://ballotpedia.org/Florida_Water_and_Land_Conservation_Initiative,_Amendment_1_%282014%29) monies starting with Option 1 because it is less expensive than Option 2, and can be traded for other lands, and because the option expires in October of 2015. The secondoption expires around 2020.
Option Lands Map SFWMD River of Grass
Would purchasing these slow everyone down even more, taking moneys and energy away from other projects?
Hmmmm? Maybe, but according to some very seasoned River/Everglades Warriors, it is worth it.
At the Everglades Coalition meeting Nathaniel Reed, Maggie Hurchalla, Mary Barely, former governor Bob Graham, and Mark Perry gave the group a “call to action” to purchase these option lands. It is a lofty goal and one that would change the game forever.
But there is not much time, and the legislature is in committee meetings “now.” (January through Feburary) and convenes (starts) March 3, 2015, and then ends in May! A rabbit race!
There is not a second to spare.
So long story short, there may be options as far a purchasing the sugar lands, but there is no option when it comes to advocating for such. Should this be your goal, you must start today! Start writing and calling below and thank you for being a part of history!
Cover of “Let’s Keep Florida Beautiful,” the environmental reelection plan for Gov. Rick Scott, 2014. Many Florida springs have stopped flowing and are choked with algae. The SPRINGS ETERNAL PROJECT explains the plight of Florida’s ailing springs: (http://springseternalproject.org) They, like our SLR/IRL, are dying.
Yesterday, I stumbled out of bed by 5:00 A.M to write my blog and make it to Palm City for the Collaborative Chamber Breakfast starting at 7:30 A.M. I had to get up as Governor Rick Scott’s kick off campaign tour to publicize his “Let’s Keep Florida Beautiful Plan,” was kicking off, in of all places, Martin County, Florida. I wanted to hear what he had to say.
Scripps reporter, Isadora Rangel, implies this morning in our Stuart News that Martin County was chosen as the kick off location because “it is the epicenter of grassroots efforts to clean the estuary.”
Reporter Isadora Rangel interviews Democrat, Congressman, Patrick Murphy who attended the breakfast. (Photo JTL)
There were about 200 people at Martin Downs County Club and both Democrats and Republicans and were present. The Lagoon goes beyond political boundaries. But politics abounds…
I greeted everyone from Democrat Maggie Hurchalla, to Republican Senator Joe Negron, and found my seat. I introduced myself to the people at my table. I looked around the room to see a veritable “who’s who.”
Hmmm? I thought.
In spite of the politics. This is pretty cool. Martin County has been chosen to kick off the governor’s reelection campaign. Why?
Because we are the most vocal little county in the state! Because 5000 people protested last summer at the height of the SLR/IRL toxic algae outbreak and releases from Lake Okeechobee. Our voices were heard. We practiced our right to assemble under our constitution. We are fighting still as last weekend’s 1500 plus at the Clean Water Rally showed. We have made a name for ourselves. Some of our politicians helped us, yes. But WE did it. We have called attention the dying St Lucie River/Indian River Lagoon, the canals and Lake Okeechobee and maybe now there will be help.
As I was daydreaming about how great Martin County’s River Movement is, the governor walked to the front of the room and took the microphone.
He was very well dressed and looked more comfortable than usual. He greeted the crowd and then told the story of his life:
Born in Illinois, single mom, did not know his father, step dad, poor, Eagle Scout, Navy, University of Missouri, Law-Southern Methodist, no money, worked since a kid, rose to success, went to church a lot as his mother said he would….no money…family….made money….the importance of jobs…
I sat there thinking that if the governor had a really good P.R. person they would have written a book on the “Eagle Scout” part….and not concentrated so much on the business….
So anyway, his assistants walked around the room and passed out a booklet with a photo of a spring on the front reading “Rick Scott, Let’s Keep Florida Beautiful.”
“Hmmmm? I thought. This is different. A pretty picture of a Florida spring and Rick Scott’s name on it.”
I opened up the booklet and right on the first page it read: DURING MY SECOND TERM I WILL: 1. Ensure that Everglades and Indian River Lagoon Restoration continue to have the vision and funding to provide a restored ecosystem to our children…”
“Remarkable” I thought. After the “Indian River Lagoon” having “no name” in Tallahassee for years, it is now listed in the first sentence of a governor’s reelection booklet. Will it happen? Time will tell. At least we are recognized.
One thing is for sure. Martin County is not just the epicenter for the Indian River Lagoon, it is the epicenter of water change for the whole state. No place has a reputation like we have. The governor choosing Marin County to start his campaign supports this point. Like him or not, that’s cool.
I have included photos I took of the booklet below. Some are blurry but it will give you an idea of what it says.
Politics are as toxic as the waters of the SLR/IRL. And we, little Marin County, have risen to the top of the fermenting algae heap. Be proud and keep fighting for the St Lucie River/Indian River Lagoon!
Booklet passed out at yesterday’s kick off re-election campaign for Rick Scott.
System Status Update is a presentation slide from the ACOE periodic scientist calls. It shows how much water is going east/west and south, in this slide, from the Everglades Agricultural Area (EAA) to the Everglades.
Today I am going to share an entire 25 piece slide presentation from the Army Corp of Engineers’ Periodic Scientists Call, 7-25-14. It’s a lot of slides, but I think you’ll enjoy trying to interpret them, and I’ll help the best I can. These presentations include a lot of information and show how the ACOE decides how much Lake Okeechobee water is going to go the estuaries, south, to the Everglades, and held, or released, to other places. This information is UNCLASSIFIED so I can share it.
I first was invited to sit in on these calls in 2012, as I was former mayor and continued commissioner, as today, for the Town of Sewall’s Point. I have talked about this before in my blog but I will restate. I felt like a complete idiot for the first six months as the ACOE kind of speaks in their own language. A military language.
Eventually, I started to catch on, and even gained the confidence to comment. Although not a scientist, as an elected official I am allowed to give succinct perspective.
These calls take place approximately every two weeks depending on the circumstances. During the terrible 2013 releases from Lake Okeechobee into the St Lucie River/Indian River Lagoon and the Caloosahatchee, calls took place every week. “Stakeholders” from the lakes south of Orlando to the Everglades participate in these calls. Representatives from agriculture, the state agencies, counties and others are present.
Here is the entire presentation from the last call on July 25, 2014.
In the slides one sees weather outlooks; inflows/outflows (west, east, south) from Lake Okeechobee and/or the southern flow of water from the EAA or Storm Water Treatment Areas into the Water Conservation Areas and Everglades; position/historical analysis of water levels in the lake; Lake Okeechobee Regulation Schedule (LORS) guidance for releases; estuary salinities; basin and lake runoff/releases into the estuaries; ongoing emergency storage of water…
In all honesty, it’s a lot for me. I mostly pay attention to the level of Lake Okeechobee and how much they may or may not decide to release into the St Lucie River/IRL. Here the LORS guidance said they could release 1170 cfs cubic feet per second into the SLR/IRL but the ACOE chose not to. Yes, many times the ACOE actually cuts us a break. But when the lake is really high, over 15 feet or so, there is no break.
I also pay more attention to how much water is going south, as this would help alleviate our situation. It appears to me that usually the water “going south” is from the Everglades Agricultural Area (EAA), not from the lake, as in this presentation, the canals just south of the lake are not noted or say “0.” Understandably, the agriculture people like to hold the water in the lake, in case a drought comes, as they need water for their crops.
I will never interpret these calls like a scientist and some the scientist may cringe when I make my non-scientific statements. But that’s OK. I am “trying.”
I think the ACOE and shared South Florida Water Management District (SFWMD) slides have gotten better and show more information than when I first started attending. I think they know the people and some politicians of Martin and St Lucie Counties, really all over the state now, are watching like hawks and demanding more disclosure and transparency in how the ACOE and SFWMD decide to manage Lake Okeechobee and surrounding areas.
I do hope you find this information interesting and not overwhelming. You can find some of it on the ACOE Facebook page (Jacksonville District, U.S. Army Corps of Engineers) or on their website (http://www.saj.usace.army.mil).
Personally, I still find the info for the SLR/IRL hard to find. I wish the ACOE would devote a special area on their website to us like the SRWMD has because the more we as citizens can easily learn and pay attention, the better chance we have, one day, for a healthier St Lucie River Indian River Lagoon for our children.
Canals C-23, C-24 and C-25 in St Lucie County were built in the 50s and 60s and are all connected. C-23 and C-24 release into the north fork of the St Lucie River leading to the S. Indian River Lagoon, but C-25 releases straight into the southern central Indian River Lagoon near Taylor Creek, close to the Fort Pierce Inlet. These canals were built as part of the Central and South Florida Project of the 1940s that came into existence after a very large flood of central and south Florida. (Photo, Jacqui Thurlow Lippisch, 2013)
One of the things that is hardest for me to comprehend is that my ancestors worked as hard, if not harder, to get the water off the land as I am, trying to keep in on…
According to an article shared by my mother, historian Sandra Thurlow, by Charles S. Miley a newspaper man in Ft Pierce, “prior to the 1920s floods were a common occurrence in the area particularly in the back-coutry.”
The article discusses how a demand for drainage began to develop among land owners as the growing of pineapples was no longer profitable and the people turned to citrus. In 1915 citizens in the area of Ft Pierce “held court” forming the North St Lucie River Drainage District. The headline in the News Tribune paper of 1921 read: ” Drainage of 75,000 Ares of Rich Land Now Under Way.”
I can just see it, “Sam, I think it’s time to form a flood district and utilize our lands.” Go forward just shy of 100 years and the conversation is : “Joe, I think it’s time we get the Army Corp to stop dumping this lousy water into the St Lucie River, ruining my riverfront property values.”
The North St Lucie River Water Control District is still in place today and was created, as all drainage districts of its time, under the provisions of Chapter 298, Florida Statutes, commonly referred to as the “General Drainage Law of Florida.” Today the NSLRWCD falls under the authority of the South Florida Water Management District that historically began really as the Central and South Florida Project, C&SFP.
In 1945 there was massive flooding throughout central and south Florida so the state and its residents called for federal assistance. Sound familiar? It may if you recall that the Hurricane of 1928 caused an even more extreme reaction and the Herbert Hoover Dike was built around Lake Okeechobee by the Army Corp of Engineers. Thus our federal partnerships today. The one that we complain about all the time…Ironic, isn’t it?
The green area is the NSLRWCD’s boundaries; the orange are is the Fort Pierce Farms Drainage District, since 1976 under the South Florida Water Management District.
So, I drifted a bit, but I was talking about the Central and South Florida Project. This large project was formed after the great flood of the 1940s and three huge canals were built during the 50s and 60s as part of this plan: C-23, C-24 and C-25. I drove over them for years with my parents as a kid and had no idea what they really were, I never learned about them in school, and I was 40 years old before I decided I needed to figure them out…
Map of canals system, Matin/St Lucie Counties.
I have not even mentioned the C-44 also known as the “St Lucie Canal” that is further south. This canal drains the basin lands around it as well as being a dumping ground for “overflow waters” of Lake Okeechobee.
The South Florida Water Management’s web site says that after C-23, and C-24 were built, the north fork of the St Lucie River drained lands approximately four times its natural drainage size! That is not even counting C-44 and Lake Okeechobee. Oh, and by the way in 1892 we opened the St Lucie Inlet permanently too.
We are living a world very different than Mother Nature created. From what I’m told she’s moody and a bit irritated. I think I’ll keep working on getting her some of her water back!