Locktender’s house at St. Lucie Canal lock #2 in the Everglades Drainage District. 1913 (circa). State Archives of Florida, Florida Memory.
I love this old photograph. I would think it must have been taken sometime between 1916 and 1925 when the Everglades Drainage District was constructing or repairing, (1924), the St. Lucie Canal. Yes, the lonely little house in the wildlands of a slash pine forest saw the the construction of the canal, the lock and spillway, the first locktenders, some wicked storms like the hurricane of 1928 causing the Army Corps of Engineers by 1930 to take over management of both Lake Okeechobee and the St. Lucie Canal. In 1937 the canal was rededicated as the “Cross State Canal, or Okeechobee Waterway.” It was deepened and widened for higher discharges and for more yacht traffic. By 1941 the St. Lucie Lock and Spillway was replaced as part of this expansion and the southern banks were drastically cut in the direction of the little locktender’s house. I can imagine the stories this little house would tell! Today we don’t have the little house, but we have the next best thing, my little brother!
Watch Todd tell the remarkable history of replacing the lock and spillway and the location of the original locktender’s house throughout the canal’s changes. Todd brilliantly uses historic aerials and images juxtaposed to Google Maps some shared by my mother Sandra Thurlow.
~The site plan: “U.S. Engineer Office – Jacksonville, Florida. Sept. 1938… To Accompany Specifications June 27, 1939.
~The aerial photo with the locks under construction is dated 2/23/1940
~On Florida Memory the picture of the little house is titled cited “Locktenders house at St. Lucie Canal lock #2 in the Everglades Drainage District. 1913 (circa). State Archives of Florida, Florida Memory.
~1940 Aerials, U.S. Dept. of Agriculture
~Dr. Gary Goforth, 2014 History of the St. Lucie Canal
Early Locks, Thurlow Archives, Courtesy Sandra Henderson Thurlow.
2024 will be the 100 year anniversary of the St. Lucie Canal…
Courtesy Dr. Gary Goforth, History of the St. Lucie Canal 2014.
“Jacqui, you spoke for the water, for the water had no tongue. And with faux righteousness, Florida’s leaders attacked you. God forbid you call out the bad actors…”
“Bad scene this morning, It’s the whole lake covered.” Toxic Lake Okeechobee. Professional pilot Dave Stone 6-24-23 of Ft. Meyers.
“Lake Okeechobee is really lit up around Pahokee.” Ed Lippisch, 6-23-23.
“The cyanobacteria is now on inside of S-308 Port Mayaca, Lake O.” Ed Lippisch 6-23-23.
S-80 St. Luice Locks and Dam C-44 Canal. Discharge of “basin” waters 6-23-23, but no Lake Okeechobee water.“St Luice Inlet post rains 6-21-23.” Dr. Scott Kuhns
St. Lucie River dark with runoff, C-23, C24, C-44 but no Lake O.
St. Lucie River dark with runoff and C-23, C24, C-44 but no Lake O.
Every time I post, I learn something. After reading “The Once Great Forests of Indiantown,” Stuart’s multi-generational resident, and dear friend of my mother, wrote:
“Jacqui, about 1968-9 my 4 hunting buddies and I went hunting in Indiantown in the Barley Swamp, there were huge cypress trees laying over?? Also walking through woods we came up on a mountain,”large Indian mound.” I have never found anyone who knew about the mound. Mid 70s I built a house that all the interior was don w/cypress from Barley Swamp, a sawmill north of Okeechobee cut it. Years later I was talking to a man I built for and he said his brother worked for FPL digging the dike, when digging, he found a carved stone face about 3x2x10 that “I thought looked like images found in Mexico and south,” I guess FPL might have dug up that mound…”
I’d like to thank Boo for his comment questioning why there were gigantic felled cypress trees in Barley Barber Swamp as late as 1968/69. I had written in my blog that according to a 1930 Stuart News article, most of the cypress and pine trees five miles NW of Indiantown were timbered from 1920 through the later years of the 1930s.
Well, my brother Todd and I went back and tried to deduce a theory. The theory is that the timber companies, as reported in the July, 19, 1930 Stuart News article, had cut most of the trees “five miles west of Indiantown,” but no matter how they tried, their trams and tracks and axes and saws could not reach the deep interior of the swamp. Its heart! So some of the largest trees, as Boo, notes, were felled later, leading up to Florida Power and Lights digging, construction and diking of its Indiantown cooling reservoir.
For perspective, Todd shades below the visible dark river shape of Barley Barber Swamp over a 1940s Department of Agriculture aerial. The shaded area is 3078 acres or 4.81 square miles.
Below, in these Florida Department of Transportation aerials from 1971, at a lower altitude, we can clearly see the Barley Barber Swamp and encroaching agricultural lands that have already been cleared and de-stumped.
The remaining and distinctive thimble shape of Barley Barber Swamp remains today as seen in the 1971/Google Earth 2023 comparison. This would have been just two or three years after Boo Lowrey and his hunting buddy visited the area in 1968/69 and witnessed the giant cypress trees lying on their sides.
Todd also created a remarkable slider for comparison.
By 1974, the remaining cypress forest of the once great Barley Barber Swamp was being burned, smoke rising to Heaven, to make way for the reservoir as can be viewed and compared in the slides below.
Heartbreaking. But as I am often told such is “progress.” I disagree.
And the Indian Mound? Of course it was right were the FPL reservoir was today. Boo saw it before most of it was drowned. It is no reach to make this deduction as Big Mound City is known worldwide as “the largest prehistoric Native American earthwork in southeastern Florida.” It was huge and lies a few miles south from Indiantown, not far from the lake, in J.W. Corbett Wildlife Area. These were ancient “cities” along Lake Okeechobee. In fact, when Indiantown was named “Annie” in 1915, long after the native people were gone, the year the St. Lucie Canal was started, there was actually an Everglades Drainage District survey documenting the road from Annie to Big Mound City. Indiantown to Big Mound City? Not far at all.
Hi everyone. I wanted to share an email written to me by Todd Thurlow yesterday that really made me smile. It shows that we are getting closer to the ACOE halting Lake Okeechobee discharges to the St Lucie River as the lake level is approaching where the Corps wants it to be prior to next hurricane season. And today was so sunny, not a cloud in the sky, surely the lake is even lower. Check eyeonlakeo.com. Have a great weekend!
Jacqui,
With the top of the Eco envelope flat at 14.5ft between 3/15 and 4/1, it looks like we are catching up and could get down in the envelope soon.
(By my calcs – I had to interpolate the top and bottom on my own a while back with no publicly available table to find). The 0.27ft number also appears live on the banner of eyeonlakeo.com. I hadn’t looked at it in a while until I was talking to Lt. Col. Polk today at Rivers Coalition and checked it on my phone. We are only +3.2 inches above to Top, as shown on the banner.
Today I share “on the water” visual reporting by my brother, Todd Thurlow. On Saturday, March 18, 2023, Todd and family took a boat ride to the popular Sandbar area just inside the St Lucie Inlet of Martin County. This is a region my husband Ed and I have been documenting since the 500 cubic foot per second discharges from Lake Okeechobee began by the Army Corp of Engineers on January 22, 2023. First there was no algae reported then there was. The ACOE has started and stopped at least three times as reported by TCPalm, but now with the weather cool the gates are again open.
For months, from the air, the historic seagrass beds have looked like a desert.
Todd’s pictures close up, on the water, show some life and give hope that by June or August there may be more lush seagrass meadows as retuned in 2022. Sprigs of seagrass, although light, are visible along with young welch, conch, and moon snails. Wading birds and sea birds can be seen feeding on and around the flats. Rays or manatees take off -hiding in sand cover. Such a beautiful place! This area and its critters are protected; be careful and thoughtful when boating here. It is an Indian River Lagoon aquatic preserve.
Ravaged by discharges from Lake Okeechobee in 2013, 2016, and 2018, the SLR/IRL does not need any Lake O water, this particularly holds true when blue green algae has been reported by the SFWMD, ACOE, FDEP, and the public.
Thank you Todd for this documentation 3-18-23 taken around 11: 50 am.
Thank you for FWC – Florida Wildlife Commission- for creating these IRL Aquatic Preserve signage to help educate and protect seagrasses. Please share! IRL A.P. 18-24 large seagrass_sgn
Todd Thurlow is the author of the website eyeonlakeo.com for “science for the everyday person.”
Today I am trying my hand at posting while mobile. So if the two YouTube videos I share do not come through and eyeonlakeo.com is not linked I apologize.
Many of you who follow my blog know my brother’s “Time Capsule Flights, “and his web site eyeonlake.com. Todd and I have worked together for many years documenting South Florida’s water history-past and present.
For this post, by going back and forth between present and past Google Earth images, Todd gives us a comparative view of what just was and now is. Hard to watch, but important to know. Next time it could be any of us. Our hearts are with Florida’s West Coast in the aftermath of Hurricane Ian.
In July a post I wrote, “At Low Tide,“ made many waves of happiness as our seagrass recovery (albeit with macro-algae) was suddenly visible. Today I share “At Mid Tide,” not as dramatic, but certainly worth documenting as it too shows the improving state of our St Lucie River/Indian River Lagoon since the damaging and toxic Lake O discharges of 2013, 2016 and 2018 eradicated all seagrasses.
These photos were taken at different times of day on Sunday, August 14, 2022 in the area of the St Lucie Inlet between Sewall’s Point and Hutchinson Island – an area often locally referred to as the “Sand Bar,” including Sailfish Flats.
Incorporated are photos from my sister Jenny, my brother Todd, friend Mary Radabaugh, and me. All on the water with family/friends on the same day! Ed and I were late getting out, and the tide was receding. While about, Ed and I are very careful not to disturb the budding seagrasses -staying on the edge. All mollusks/sea life if photographed is immediately returned to its original location. This habitat is delicate!
Yet another recent wonderful day on the St Lucie River/Indian River Lagoon since there have been no major damaging discharges from Lake Okeechobee in over three years and Mother Nature has not thrown a hurricane our way…
Enjoy!
Approaching Ernie Lyons Bridge from Jensen Boat RampDo you see the fighting conch’s blue eyes? Video below gives perspective:
Almost home!
II.
My sister’s photos: Zella-Sand Bar, earlier incoming tide, Jenny Flaugh
III.
My brother’s photos: Todd Thurlow – daughter Julia water skiing off the House of Refuge
IV.
Mary Radabaugh, friend and nature photographer: Osprey & blue sky near Boy Scout Island
~Our wildlife, sea and sky, needs our continued support for a healthy St Lucie!
I posted most of these photos on Facebook, but today I will give explanations and document on my blog. From above, our St Lucie/Indian River Lagoon remains beautiful, but we must be sensitive to the losses beneath the waters. These aerials were taken during a “slack tide” between 12 and 2pm on December 9, 2020 by my husband, Ed Lippisch. December 9th was the last of five days the ACOE stopped discharging from Lake Okeechobee; however S-80 was discharging “local runoff.” (Click on chart above.) Unfortunately, due to high lake level and lack of storage reservoirs, since these aerials were taken, the ACOE has begun ramping up Lake discharges once again.
Below Lawrence Glenn of the South Florid Water Management gives a comprehensive ecological report covering low-salinities and loss of oyster spat in the St Lucie and other aspects, positive and negative, for the entire Everglades system.
Below is an explanation of aerials documenting discharges December 9, 2020. All photos by Ed Lippisch.
-S-80 at St Lucie Locks and Dam discharging local basin S-80 runoff on December 9, 2020
S-308 at Port Mayaca, Lake Okeechobee closed on December 9, 2020. No algae visible.
-Plume of along Jupiter Island south of St Lucie Inlet
-Dispersing plume in Atlantic Ocean just past Peck’s Lake in Jupiter Narrows
-St Lucie Inlet -St Lucie Inlet State Park, Sailfish Point, Sewall’s Point, Stuart, Jensen
-Looking north to Sailfish Flats between Sewall’s Point and Hutchinson Island. This area has greatly degraded since 2013 as far as loss of seagrasses and fishing opportunities
-The area below, especially around Sailfish Point, was once considered “the most biodiverse estuary in North America” as documented, first, by Grant Gilmore
-This photo reveals seagrass loss across many areas of the Sailfish Flats
-Another view between Sewall’s and Sailfish Point, a seeming desert…
-Close up, Sailfish Point
-Sewall’s Point, east Indian River Lagoon
-Sewall’s Point is a peninsula surrounded by the St Lucie River on west side, and Indian River Lagoon on east side
Ed Lippisch, selfie. Thank you Ed!
As you can tell, I have lots of people helping me. Whether it is Ed flying or my brother Todd who provides an incredible easy to read website called EyeonLakeO. You can click below to check it out. The more we know, the more we document, the more we can overturn the destruction of our beloved estuary…
“Thank you Jacqui! While this is bad for the East Coast, the West Coast has been inundated with nonstop discharges from Lake O. Can your brother update his Caloosahatchee chart to include 2020?” Mike Downing
Thanks to my brother, Todd, for replying to Mike’s question right away. (Chart above)
Mind you, these numbers measured from S-79 (comparable to the St Lucie’s S-80) include basin runoff and Lake Okeechobee discharges. As of 12-1-20, the brown line of 2020 is creeping higher, just under 2018, to 1,409,269 acre feet! That’s one foot of water on 1,409,269 acres of land!
If we want to see a break-out of basin and Lake O discharges to the Caloosahatchee, we can view SFWMD, Division Director of Water Resources, Lawrence Glenn’s draft slide for the upcoming, December 10, South Florida Water Management District Meeting. (See below.)
In a color coordinated way, Lawrence’s chart splits out the basin and Lake Okeechobee discharges over the course of 2020. Look at all the dark blue representing Lake O in late October, November, and December. Also, look at all the basin runoff (green and gray)For Lawrence’s entire presentation -which includes the St Lucie- click here.
As a non scientist, non-technical type, what I notice looking at Todd and Lawrence’s charts is that although there has been notable discharge in 2020, the water was released by the ACOE later in the year. This is significant.
Back to Todd’s chart:
If you want to learn even more, use my brother’s eyeonlakeoacre feet calculator to get a visual for 1,409,269 acre feet of water. 1,409,262 acre feet would put 33.66 inches of water on the land area of Lee County and 48.66 inches of water on land area of Martin County!! Mind boggling! See here or chart below.
What helps keep things in perspective for me is a map created in 2019 by the SFWMD based on the famous historic 1913 Harshberger map that makes very clear -colored in light baby blue- the water that once covered the central and southern portion of Florida. The majority of this water is now sent through the Calooshahatee and St Lucie Estuaries…
A Ten Year View, Discharges to the St Lucie Estuary
Today I share images that help tell the story of the St Lucie Estuary over the past ten years. The first image is from the website eyeonlakeo. My brother, Todd Thurlow, takes data from D-Hydro of the SFWMD and puts it into a format that the average person can understand.
The chart above shows the “S-80 spillway at St Lucie Locks’ cumulative discharges by CALENDAR YEAR, 2011-2020.”
Scientists use Water Years, May 1 of one year, through April 30 of the next year. This splits up the years making it more confusing to remember or understand. We, as people, live our lives in calendar years.
We can see by looking at Todd’s chart that 2016’s calendar year is highest overall discharge year with 842,775 acre feet (one foot of water covering one acre) of water going to the St Lucie from what is called “local runoff” (all canals and surrounding areas) as well as discharges from Lake Okeechobee.
How large is 842,775 acres? Comparatively, Martin County is 347, 520 acres. 2020 is 188,723 acre feet and climbing. We are talking tremendous amounts of water!
In descending order, we see 2016; 2013; 2017; 2018; 2015; 2020; 2012; 2014; 2019; and 2011. The brown of line of 2020 crests 2015 as when the year is completed, 2020 will more than likely be higher than 2015.
“Could you please get me a chart or graph showing discharges to the St Lucie River for 2012-2020 by month. Please present this information from January through December of each calendar year and break it out from S-80 and S-308 and also give a total combined number. Please also note for each of those calendar years, the highest level Lake Okeechobee got that year.”
To view this information, click on Charts in red below for visuals, and data in red below for numerical charts. As mentioned this information below is from the SFWMD. This compiled information provides great perspective.
I, as many, participated in yesterday’s Army Corp of Engineers‘ Periodic Scientist Call. During the course of the call, it was alluded that the ACOE may be letting up or halting Lake Okeechobee discharges to the St Lucie Estuary soon. As soon as they do, we will begin to chart calendar year 2021. All things considered, everything in me believes it will be better than 2020!
Today is October 26, these photos/videos were taken over the weekend on October 24, 2020. The first is the St Lucie River looking off the Evan’s Crary Bridge at Sewall’s Point; the second is a video of the St Lucie River taken between Rio and Stuart; and the third is a video of a brown ocean at Peck’s Lake. The St Lucie River/Indian River Lagoon and much of the east coast of South Florida have endured tremendous, repetitive downpours in 2020, causing massive “local basin runoff.” The St Lucie has been stressed for months, and since October 14, there are also discharges from Lake Okeechobee. Prior to that, there had been no Lake O discharges since March of 2019. This post is written to document this discharge era for today and for later reference.
1-Video visual water quality from boat, wide St Lucie River near Rio 10-24-20
2-Video visual water coloring, Atlantic Ocean at Peck’s Lake, south of St Lucie Inlet 10-24-20
DOCUMENTING THE DISCHARGES 2020
Map SFWMD showing canals and basins. C-44 is designed to discharge both basin and Lake O water, depending. When flowing, C-23 and C-24 are constant polluted discharges. More often than not, the St Lucie receives more polluted fresh water discharges from these canals than the river can handle.
Covid-19, an active hurricane season, and the 2020 presidential election have captured our attention, but most of know, as this Tyler Treadway Stuart News article reports, much to our dismay, due to a high rate of Lake Okeechobee rise, and after weeks of media briefings, and warnings, a reluctant ACOE started discharging to the St Lucie River on October 14th. Thankfully, for much of the time, it has been difficult due King Tides. The discharges are expected at least another week longer if not a month depending weather and rainfall from Tropical Storm Zeta. See link below from the ACOE’s most recent, 10-20-20, Periodic Scientist Call for more info.
The most comprehensive place to keep track of all this is Todd Thurlow’s website (http://eyeonlakeo.com) that provides a multitude of easily interpreted information. Check it every day, especially LIVE DATA and Satelitte NCCOS HAB images of Lake Okeechobee.
FACEBOOK UPDATES
Michael Conner, THE INDIAN RIVERKEEPER keeps an active Facebook page on Lake O discharge and other local issues and is often on the ground reporting.
I am not happy about the discharges, however, I am pleased to report that the SFWMD has created a transparent website page where one can learn all that is being doing to try to curb the harmful discharges to the estuaries. The SFWMD is working hard to send water south even during this very rainy hurricane season. And each year we must figure out how send even more water south. https://www.sfwmd.gov/content/district-actions-reduce-harmful-discharges-northern-estuaries
Also on 10-14-20 The Florida Department of Environmental Protection put out a press release: “Governor Ron DeSantis Announces Preparation for Algae Bloom Mitigation Following Announcement by Corps of Releases From Lake O.” This technology has not been needed thus far.
I can’t forget to include that October 11, 2020, right before the discharges began, Ed and I took this video documenting a significant algae bloom in the middle of Lake Okeechobee. Since that time it has been too stormy, or cloudy to go up. Usually, rain and lack of sunshine minimize visual blue-green algae blooms as can be seen on Todd’s website. The algae does remain in the water column. This image/video was shared by many news stations and posted on Facebook.
3-Large algae bloom in middle of Lake Okeechobee, 10-11-20.
Next , I would like to document Florida Oceanographic CEO, Mark Perry’s recent op-ed as it gives us pause. “Why can’t, why aren’t we able to send more water south?” We know a lot has been done, and we are grateful, however, 2020 is not 1948, we must continue to advocate for a better water future…
OP-ED MARK PERRY, PUBLISHED IN STUART NEWS, October 15, 2020
Lake Okeechobee discharges can go south now.
As the water level rises in Lake Okeechobee, the U.S. Army Corps of Engineers is considering discharges to the coastal estuaries, the St. Lucie to the east and Caloosahatchee to the west.
According to the Lake Okeechobee Regulation Schedule, the Corps considers where the lake level is at this time of year within the “operational band,” which ranges from 10.50 to 17.25 feet of elevation. Then, based on the rainfall outlook and tributary conditions, they determine “allowable Lake Okeechobee releases” to the water conservation areas and to the estuaries.
The water conservation areas (900,000 acres) are the remnant Everglades, south of the Everglades Agricultural Area (EAA) which is the 700,000 acres immediately south of the lake used primarily for growing sugarcane.
For “allowable Lake Okeechobee releases” to the estuaries, the Corps has specify flow amounts going to each estuary, which can be “up to 4,000 cubic feet per second (cfs) to the Caloosahatchee and 1,800 cfs to the St. Lucie.”
That is where they are right now with the lake at 16.02 feet elevation.
But the “allowable” releases to the water conservation areas are always “up to maximum practicable.” What does that mean? Well, they rarely talk about how much they can release to the water conservation areas, and never tell us how much should be considered to go south.
In fact, water has been flowing south into the water conservation areas all throughout this wet season, May through October.
But it is not coming from the lake.
About 955,000 acre feet (311 billion gallons) has been going into the water conservation areas from the EAA basin runoff. This means that they are keeping the EAA water table down to 10.5 feet — ideal for crops — by draining all this water through our 57,000 acres of stormwater treatment areas and into the water conservation areas — the Everglades.
Meanwhile, the Corps says they must discharge Lake Okeechobee to the estuaries because they can’t release it to the south. Well, they can — they have been doing it for months and they still are today, but it is all coming from the EAA basin runoff!
All this time, we could have been releasing lake water to the water conservation areas, and we could do the same right now instead of killing the estuaries with releases and wasting this water to tide.
But for that to happen, we need to tell the EAA to store and treat runoff on their own land so the stormwater treatment areas can be used for water flowing south from Lake Okeechobee.
The Corps and South Florida Water Management District are jointly responsible for managing water in south Florida. We need to have them focus on restoring more natural water storage and treatment north of the lake, in the 2.5 million acre watershed, so the lake doesn’t fill up so fast.
But we must also get them to flow south from the lake to the Everglades during the wet and dry seasons. We don’t have to wait for huge regional projects to be authorized and completed, we can do this now.
The lake is rising quickly because the EAA is using the capacity to send water south. Agricultural interests would like it to stay high because during the dry season, November thru April, the EAA will demand water from the Lake, about 350,000 acre feet, as water supply for their crops.
These are ideal conditions for the EAA, but not so good for the lake, the greater Everglades ecosystem and the coastal estuaries.
Mark Perry is executive director of the Florida Oceanographic Society in Stuart.
Below are Florida Oceanographic’s most recent St Lucie River/Indian River Lagoon water quality reports
Finally: During Rivers Coalition meeting 10-22-20 more expansive documentation/reporting of on-going seagrass loss/slow recovery in the St Lucie River/Indian River Lagoon was requested. It was noted that SFWMD “Ecological Reports” cover only two historical seagrass areas of the once lush and healthy Sailfish Flats.
My brother Todd took a family fishing expedition on Saturday, June 28, 2020. 119 miles! His journey may not have revealed many fish out in the deep ocean, but there was tremendous visible life in the Indian River Lagoon and nearshore ocean. Good to see!
“Beautiful flat day. 119 miles and only a barracuda, but it was fun.
Saw hundreds of Pelicans diving on the silver minnows near the power plant. That is probably to most Pelicans I have ever seen in one place locally, including bird island.
Also in all my life I have never seen the fin of a shark at the sandbar. After looking at my photos, I am pretty sure is was a little Scalloped Hammerhead. I cropped a comparison from the online guide and a link to the entire guide. I couldn’t see the head but the fins seem to match. The few people who saw it thought it was a Bull Shark but I didn’t think so. A Bull Shark fin isn’t as sharp.”
Below are photos of the hundreds of happy brown pelicans and also photos of the juvenile scalloped hammerhead shark. Don’t be scared! It’s just a young shark. The estuaries are their home. These and all sharks are protected species and many like the scalloped hammerhead, globally endangered due to overfishing. Mostly for shark fin soup! Awful.
Well, there’s nothing like a day on the water! Fish or no fish. 119 miles is never for nothing around here!
This morning, for purposes of documentation, I am posting the path my husband, Ed Lippisch, flew over Lake Okeechobee yesterday (6-10-20) and all aerials taken. Thank you to my brother Todd Thurlow, who shares technical information on his website, for re-creating Ed’s path via Flight Aware, and for also sharing the latest satellite high resolution images of Sentinel 2 retrieved 6-9-20. All of Ed’s phots displayed in gallery format below were taken from 2000 to 1500 feet on return flight along southern portion of Lake Okeechobee ending at Port Mayaca, east central, Martin County. His flight to the west coast was at 5000 feet and Ed said he saw no algae visible from that perspective.
All aerials, Ed Lippisch flight, 6-10-20, Moore Haven to Port Mayaca: if you are having trouble viewing this gallery please go to (https://wp.me/p3UayJ-b0a)
Moore Haven, Calooshahtchee canal C-43
Off southern rim. Cities of Moore Haven and Clewiston are in this area.
Turning over lake southern shore in distance
Now turned east, south eastern shoreline in view, getting close to Port Mayaca on east center in Martin County
Distinctive shape of S-308 at Port Mayaca in view
Algae bloom one mile or so off Port Mayaca, lighting makes difficult to see but it is clearly present
Ed said all algae was very bright, florescent, in color and his phone did not capture that aspect
Chlorophyll, we learn about it in grade school and know it resides in plants, but really, if you’re like me, you may not think too much about it. I certainly wasn’t pondering until my brother Todd Thurlow sent me some of his exciting new eyeonlakeo publications.
These newer publications include: 1. Movie Sea Surface Temperatures and 2. Movie Chlorophyll. Even for the non-scientist type, they really are fascinating. The one that caught my eye is “movie 2.” revealing color-coded levels of chlorophyll swirling around Florida’s waters from June 2019, to May 2020. Like rainbow liquid fire, formations twirl and dance around our peninsular home. And what a home it is!
Todd points out, that If you watch closely, there is an eddy that begins off of Ft Meyers with an offshore “puff of red.” (10/22/2019 at 0:11 on the video). This eddy swirls all the way through November!
Then there’s “movie 2. sea surface temperature” with the weird gyrating underwater loop.
Bizarre! What was that?
Todd:
“The loop seemed to be drifting southeast like a big underwater hurricane heading toward the west coast of Florida. (SEE IMAGES BELOW YOU-TUBE VIDEOS) After 9/5, it is blocked by clouds so the images don’t show it all. Day’s later an eddy forms off of Ft. Meyers. I actually have no idea if there was red tide at this time. Was there? I’ll have to look later but this is interesting. Maybe these will explain something. Are these underwater hurricanes, so to speak, picking up the deep nutrients and pushing them to shore? Pulling nutrients offshore and returning them later?
Another interesting point, which ties into my sea surface temperature movie – two days before, on 9/3/2019, the SST movie shows a “belch” of warmer and cooler water traveling north from the Yucatan and Cuba right before the chlorophyll loop current shows up.
Once again, maybe the scientist can explain….”
The untold secrets, temperature and chlorophyll. Take a look a both videos below! What do you think is going on?
*A series of images from the movie showing the loop current and the eddy that Todd was describing:
Florida Chlorophyll a and Martin County Chlorophyll a – MODIS (Terra)The “Florida Chlorophyll a” and “Martin County Chlorophyll a” products pull localized imagery from NASA’s Global Imagery Browse Services (GIBS) gibs.earthdata.nasa.gov. Eyeonlokeo.com queries two layers from the MODIS sensor on the Terra Satellite, cropping the imagery in separate products for Florida and Martin County. The queries pull the CorrectedReflectance_Bands721 (to show land and clouds), layered with the Chlorophyll_A bands (to show concentrations of chlorophyll in the ocean). Note that a concentration of chlorophyll does not indicate a Harmful Algae Bloom (HAB). These layers are provided to allow users to easily monitor the relationship, if any, between the concentration of chlorophyll off the Florida coasts and discharges from Lake Okeechobee through the St. Lucie and Caloosahatchee Rivers. The “Martin County Chlorophyll a” product goes a step further by querying the South Florida Water Management District’s (SFWMD) online DBHydro database (www.sfwmd.gov/science-data/dbhydro). A script pulls the discharge data for the S-80 structure at the St. Lucie canal. S-80 is the spillway located adjacent to the St. Lucie Locks on the C-44 Canal. It is only one of several spillways that empty into the St. Lucie River but it is the terminus of the C-44 canal that carries discharge water from S-308, located at Port Mayaca, together with C-44 basin runoff to S-80 at the St. Lucie Locks. The daily discharge data is added to the bottom of each image. When discharge rates are high at S-80, a large plume of chlorophyll can usually be seen off of the St. Lucie Inlet in Martin County. The plume often moves south close to shore but further from shore the Gulf Stream carries the plume north.Additional layer information from gibs.earthdata.nasa.gov: “The MODIS Chlorophyll a layer provides the near-surface concentration of chlorophyll a in milligrams of chlorophyll pigment per cubic meter (mg/m3) in the ocean. Chlorophyll is a light harvesting pigment found in most photosynthetic organisms. In the ocean, phytoplankton all contain the chlorophyll pigment, which has a greenish color. Derived from the Greek words phyto (plant) and plankton (made to wander or drift), phytoplankton are microscopic organisms that live in watery environments, both salty and fresh. Some phytoplankton are bacteria, some are protists, and most are single-celled plants. The concentration of chlorophyll a is used as an index of phytoplankton biomass. Phytoplankton fix carbon through photosynthesis, taking in dissolved carbon dioxide in the sea water and producing oxygen, enabling phytoplankton to grow. Changes in the amount of phytoplankton indicate the change in productivity of the ocean and as marine phytoplankton capture almost an equal amount of carbon as does photosynthesis by land vegetation, it provides an ocean link to global climate change modeling. The MODIS Chlorophyll a product is therefore a useful product for assessing the health of the ocean. The presence of phytoplankton indicates sufficient nutrient conditions for phytoplankton to flourish, but harmful algal blooms (HABs) can result when high concentrations of phytoplankton produced toxins build up. Known as red tides, blue-green algae or cyanobacteria, harmful algal blooms have severe impacts on human health, aquatic ecosystems and the economy. Chlorophyll features can also be used to trace oceanographic currents, atmospheric jets/streams and upwelling/downwelling/river plumes. Chlorophyll concentration is also useful for studying the earth’s climate system as it is plays an integral role in the Global Carbon Cycle. More phytoplankton in the ocean may result in a higher capture rate of carbon dioxide into the ocean and help cool the planet.”
Before Hurricane Dorian came this way, my brother, Todd, was helping me answer a question. ~One I think will be interesting to you as well…
“Where were the rapids of Lake Worth Creek?” Yes, rapids!
T41S R43E, Survey 1855 John Westcott, Surveyor General.
To answer the question, we must first recognize that Lake Worth Creek has been altered as we can see comparing the images above and below.
This change happened slowly over time, but most notably in 1894 with the completion of the Intracoastal Waterway from Jacksonville to Maimi. The Google Map below shows the Intracoastal today. The 1855 survey above shows Lake Worth Creek pre-development. In both images, it’s the area between Jupiter Inlet and Lake Worth- the historic area of Lake Worth Creek.
To learn where these rapids were located let’s read an excerpt from Palm Beach County’s MANAGEMENT PLAN FOR FRENCHMAN’S FOREST NATURAL AREA, FCT PROJECT # 96-011-P7A, June 1998.
The Frenchman’s Forest Natural Area (located right under Frechman’s Passage, JTL) is part of a broad coastal swale that was separated from the Atlantic Ocean by coastal sand ridges and from the Loxahatchee Slough by a broad pine flatwood ridge. It was part of the headwaters of the former Lake Worth Creek, a meandering blackwater creek that flowed northward to join the Loxahatchee River near its mouth at the Jupiter Inlet. The earliest accounts of the site date from the 1840s, and were from U.S. Army Topological Engineer reports made during the Second Seminole Indian War (Corbett 1993). Eighty men from Fort Jupiter moved up Lake Worth Creek in seventeen canoes. Approximately two miles north of the natural area, they reached the “rapids”, a series of muck terraces that disappeared during periods of high water, but helped hold water at a higher level in the upstream sawgrass marshes. Another series of muck terraces may have been present 0.25 miles north of the natural area. After getting past these barriers, the troops entered a large sawgrass marsh, where they pulled the canoes for a mile to a haulover path over the sand ridge separating the marsh from Lake Worth. The southeastern portion of the natural area was part of the sawgrass marsh, and the soldiers may have crossed through the site. Once they reached Lake Worth, the soldiers raided Seminole Indian villages along its shores, capturing guns and canoes. The soldiers had followed an old Indian route for traveling between Jupiter Inlet and Lake Worth. When the last Seminole Indian war ended in 1859, pioneers began to use this route for coastal travel. Charles Pierce (1970) described his family’s travel to Lake Worth by small boat via this route in 1873. He noted his father’s difficulty in finding the right channel through the sawgrass to the haulover. Pierce and his family were among the earliest permanent settlers on the shores of Lake Worth. Pierce also provided the first direct reference to the natural area, noting that the bird rookery on Pelican Island (present-day Munyon)…
Another source we can use comes from the Atlantic and Gulf Coast Canal and Okeechobee Land Company 1881 Prospectus where it documents the advantage of making the cut through Lake Worth Creek. Nine lines from the bottom it mentions the rapids: “There is a depth of five feet of water in the channel from its mouth to the rapids…”
And the last shared source is from an 1884 USGS Survey Report noting the difficulty of working through the sawgrass route from Haulover Head on Lake Worth to the Rapids of Lake Worth Creek.
Fascinating and historic information, but what about X marks the spot? Where were those rapids?
Using the above information, below (look for yellow arrow) Todd shows more specifically on a topo map from his video “Lake Worth through the Haulover and Sawgrass Route to Jupiter Inlet – 1883” showing where Lake Worth Creek’s rapids may have been located. On today’s map that is very close to Frenchman’s Passage/Frenchman’s Creek.
Next time you’re in the area give a shout out to the once rapids of the former Lake Worth Creek, a wonder of old Florida that we shouldn’t forget!
9:16am 9-16-19: I was close! My brother just texted me this: Hey Jacqui. Sorry Dorian interrupted our discussion of the Falls. It was actually near the creek called Frenchman’s Creek on the old topos not Frenchman’s Passage which is a neighborhood today about a mile and a half south and inland from the old creek/rapids. 😬
Frenchmans Creek still appears on Google maps. It is where Cypress Island Marina is today off of Palmwood Road.
My recent post about “Holding Lake Okeechobee’s Algae at Bay” got a lot of responses with a few questioning whether the algae bloom in Lake O off Port Mayaca was caused by the waters of C-44 flowing back into the lake.
I do not know the answer to this question, but I do know flights over the C-44 canal in 2019 have shown no visible algae blooms, but many in the lake with some right off Port Mayaca. Nonetheless, we know the C-44 is full of nutrient pollution.
Today I want to share a chart from my brother Todd Thurlow’s website http://eyeonlakeo.com/ as well as our back and forth on the issue of how much water has been put into Lake Okeechobee from C-44 so far this year rather than going into the St Lucie River. The ACOE can flow C-44 flow both ways…
Be sure to read “Summary of Query Results” below for the answer.
Todd: Jacqui, I changed my DBKey on my daily spreadsheet to S-308 just to see what it would spit out. See below. It looks like S-308 has sent a net 17billion gallons of C-44 basin water (over 54,000 AF) into Lake O this year. I am pretty sure that means we get a “free” 17billion gallons in our direction before it is considered “Lake Water”.
Jacqui: Todd did the ACOE start sending the C-44 canal water back to Lake O May 29th? Looking at the chart this is what I see.
Todd: There has been little flows all year as can be seen on the chart too but the big flows started on May 13 at -2042cfs. There was a pause between June 4 and July 30. Then is started again with a few days off here and there. Here is the data that is summarized in that chart.
The May 29 date that you might see (its actually May 20) is where the “Cumulative Total Discharge” graph crosses the zero axis? That is where the net flows for the year were back to zero. In other words, it took from May 13 to May 20, 8 days of westward flow, to cancel out all of the net eastward flow for the year.
SFWMD canal and basin map. C-44 can run east to the St. Lucie or west to Lake Okeechobee.
These DEP canal summaries are no longer available on-line but remain good references even though written in 2001.
Todd Thurlow gave a great presentation last evening about his website “EyeOnLakeO,” http://eyeonlakeo.com. The site is a cache of images, charts, data, videos, graphs, and mathematical conversion calculators. This information is all public, but hard to find because it is buried under layers and layers of government-agency material. Thanks to Todd, now much of this is in one place, and only a click away!
Last’s night’s presentation reviewed everything on the site, but focused mostly on “Descriptions of Satelite Imagery and Sources.” This you may have seen me post on Facebook where Todd juxtaposes the Lake Okeechobee NOAA Harmful Algae Bloom Images to Real Color Images.
You can see other subject boxes include: Florida Chlorophyll; Martin County Chlorophyll; Live Discharge Data; Historical Discharge Graphs (my favorite); Calculators and Tools (super helpful!); Satellites- Landsat 7 & 8; Terra, Aqua, Suomi Last 7 Days; Measurements (of algae blooms in Lake O); Landsat 1-4 Movies 1972-2013; Landsat 4-8 Movies 1982-2018 (compilations of satellite images over time); Lake O Surface Winds “Windy” (to see where the algae will be pushed and gather); Hurricane Matthew Video info (was 20 miles off Stuart/Cat. 4/2016); Terra/Aqua/Suomi Archives; and a movie of the Lake O Algae Bloom 2016 that Todd measured at 253 square miles being dumped into the St Lucie River at S-308…not a good year!
Todd noted all this got started with Mark Perry, CEO of Florida Oceanographic, asking Todd if he could measure the 2016 bloom. I’m so glad Mark asked!
The presentation was well received and left our heads spinning!
Todd noted during his introduction that he is not a scientist, but a lawyer and an interested citizen like the rest of us. He shared that there is a ton of information out there and that it is not the responsibility of the government to give us the information. It is our responsibility to get it ourselves. Thank God I have Todd as a brother because I don’t have the ability or the desire to mine all of this information. But he does, and we can all use it and all share it and hold our state accountable using it.
What a wonderful thing!
Please go to Todd’s website and explore, bookmark as a reference especially with summer coming: http://eyeonlakeo.com
In closing, I’d like to use this opportunity to compare the 5-18-19 NOAA image on Todd’s site with photographs of algae bloom in Lake Okeechobee taken by my husband, Ed Lippisch, just yesterday. Ed described this bloom as five miles long and a few miles wide. As with many other years, the cyanobacteria is back in the lake. But now we can watch it, and fight that it is not discharged into our river.
~Yes, it is from the air, and from outer-space, that we really can force the conversation for a better water future!
This blog post is a follow-up to my previous post: https://wp.me/p3UayJ-9Vm, entitled “Top 25 Discharge Years” to the St Lucie and Caloosahatchee . Here I wrote that the SFWMD’s DBHydro systems’ discharge dates were not the same for the St Lucie and Caloosahatchee estuaries and speculated on why. To review, the St Lucie’s dates available on DBHydro are 1953-2019, whereas the Caloosahatchee’s is 1967-2019. Thirteen years are “missing.”
Of course my brother Todd, was able to locate and give insight into those missing numbers explaining that comparisons could be found in another system, the USGS system, that actually shares information about the entire planet.
Todd has created the above charts using the USGS data for the Caloosahatchee and the DBHydro data for the St Lucie, and we can now see the 1959/1960 discharge comparison of the St Lucie and Caloosahatchee for 1959 and 1960 in the above charts and excerpts below. Cool!
St Lucie
Caloosahatchee
Delving into all this is a lot of work, and sometimes imperfect, but isn’t it great that the internet allows both the state and federal government to put all this raw data out there for anyone to analyze? Although it takes time and expertise, at the local level it is really our responsibility to individually, through non-profits, and as local governments, tap into this available data and present it in a fashion that everyone can understand, and perhaps inspire!
So now, the lost numbers of the Caloosahatchee are found revealing that the St Lucie River has the highest discharge number on record – 1960- at 3,093,488 acre feet!
Shockingly, the worst year, 1960, displays 3,093,488 acre feet of water coming through S-80 into the St Lucie River/Indian River Lagoon. For comparison, the highest year in the past decade was 2016 at 857,529 acre feet. ~A difference of 2, 235,959 acre feet.
We know now that an “acre foot” is an easy calculation, “one foot of water covering one acre of land.” 3,093,488 acre feet of water would have just about covered St Lucie, Martin, Palm Beach, and Broward counties as the acreage of these counties combined adds up to 3,293,440 acres. Hard to believe!
TT3
Even though in 1960, the lake was not yet prone to massive cyanobacteria blooms, fresh water itself is destructive to a brackish estuary, and over three million acre feet discharged into the river by, what would have been at that time, the Central and South Florida Flood Control District, (the predecessor to the South Florida Water Management District), must have wiped out just about everything.
Of course the question is: “Why such high a high number in 1960?” One would deduce, that the primary reason would be because there were three tropical storms and one hurricane that crossed over Florida during this era. According to NOAA’s Tropical Cyclone Rainfall in Florida chart: Judith, October 1959, 7.90 inches; Donna, September 1960 13.24 inches; Florence, September 1960 15.79 inches, and we do not know for the Unnamed 1959 storm.(https://www.wpc.ncep.noaa.gov/tropical/rain/tcflorida.html)
But this is conjecture…
Going back to Todd’s graph, you’ll notice that thirteen out of the twenty-five years listed had higher discharge number than 2016. Sobering, isn’t it? Staggering numbers, for a river that by Nature was never connected to Lake Okeechobee, and only a portion of the so-called C-44 Basin. We have drowned her, indeed…
Hurricanes 1959, 1960 NOAA, courtesy of Todd Thurlow.
Now for one final question.
The Caloosahatchee has data too, but only for years 1967-2019. Thus the Caloosahatchee’s highest year for discharge of its top 25 years is 2005, at 3,731,056 acre feet; followed by 2016, at 2, 950,926 acre feet and so on. Please click on the graph.
So what about the missing thirteen years of 1953-1968? Where did this water go? Did it go to the St Lucie? Was the Caloosahtchee off-line? Did it go through the Calooshahatchee but was not recorded? These are questions I cannot answer. But in any case, both rivers need a break, or they shall break themselves. History allows us to see the long-standing destruction and ecological disregard for our treasured Northern Estuaries.
S-79 Spillway on Caloosahatchee at Franklin Lock and Dam, Top 25 Discharge Calendar Years, 1967-2019, courtesy Todd Thurlow.
Basin map SFWMD. Before it was connected by canals, the St Lucie River was a large fresh water “stream” that ran into the Indian River Lagoon.
Structures along the Caloosahatchee, courtesy Melody Hunt, Research Gate. The Caloosahtchee was connected to Lake O in the late 1880s by Hamilton Disston after he blew up the waterfall rapids at Lake Hipochee and dredged on to the Lake.
S-79 Spillway Caloosahatchee at Franklin Lock and Dam, Calendar Year 2010-2019, courtesy http://eyeonlakeo.com, Todd Thurlow.
Structures along the Caloosahatchee River, courtesy Melody Hunt, Research Gate. S-79 is the gate used for purposes of this post. S-79 is comparable to the St Lucie’s S-80 at St Lucie Locks and Dam, in that it is the final structure along a channelized river thus allowing both runoff from the surrounding “basin” and water discharged from Lake Okeechobee.
Last week, I presented a blog on discharges, 2010-2019, to the St Lucie River from both the surrounding basin, and Lake Okeechobee. Although we can separate Lake O’s numbers, it is important to know just how much water, thus sediment, nitrogen and phosphorus, the estuaries are taking “at once.” I have often said the worst thing about discharges from Lake Okeechobee is that the river is already on life support -from being drowned out by basin runoff- when Lake Okeechobee is leashed open.
So called “basins” around our rivers, like everything else in South Florida, have been altered to drain more efficiently than Nature intended. Thus with “basin discharges” these rivers (St Lucie and Caloosahatchee) are already being drowned out during high rain events, and thus when Lake O’s water comes on top, well, it is the “nail in the coffin” so to speak.
I just needed to explain that before we begin….
~ So today, as in the previous post, I will be speaking about both basin and Lake O water.
Referring to my brother, Todd’s, graph at the top of the page, you’ll notice right away the destructive-discharge numbers are much larger for the Caloosahatchee, than the St Lucie, as it is much larger estuarine system.
As we can see comparing the two charts labeled “Cumulative Discharges 2010-2019” below, both the St Lucie and the Caloosahatchee’s highest year for discharges, by far, was 2016. But whereas the St Lucie received 842,000 acre feet of water, the Caloosahatchee’s water number is a whopping 2,950,926 acre feet! That would mean one foot of water on 2,950,926 acres of land.
You’ll remember from last time that “acre feet” is a very easy way to calculate. “Acre feet” means one foot of water on top of one acre of land. This 2016 Caloosahatchee 2,950,926 acre feet of water would just about cover, by one foot, Lee County, Collier County, and Hendry County – counting land and water within boundaries – as the acreage of these three counties adds up to 3, 012,450 acres.
Lee, orange; Collier, blue; and Hendry, green equals 3,012,450 acres of land so 2,950,926 acre feet of water would just about cover this area.
TT3
Again, this visual is meant to give perspective on the tremendous amount of land this amount of water would cover. Often when we hear “acre feet” we don’t put “two and two” together. Once one realizes the number of acres of land that would be covered, it is astounding!
~But then, of course! These waters used to flow naturally as sheet-flow from the Shingle Creek area up in Orange County all the way south to Florida Bay.
Continuing on, we see that in second place, although the St Lucie’s second worst year was 2013, for the Caloosahathcee it was 2017, and then 2013. The fourth worst, for both estuaries was 2018.
Please compare the charts below of both rivers to see other differences from 2010-2019. Interesting… In the future, perhaps we can ask why 2018, in fourth place, was by far the most horrific year for the Caloosahtchee. Certainly it has to do with that sediment, nitrogen and phosphorus feeding cyanobacteria. As we know, in 2018, Lake Okeechobee was 90% covered in a cyanobacteria (blue-green algae) bloom…
*Please note that the charts look similar below; look closely to see that the first is for the CALOOSAHACHEE and the second is for the ST LUCIE. Thank you Todd for these awesome visuals!
CALOOSAHATCHEE 2010-2019 basin and Lake O
ST LUCIE 2010-2019 basin and Lake O
Go to http://eyeonlakeo.com, Todd’s website for more ways to easily access and compare Calooshatchee, St Lucie and other information.
Today, I begin a series of blog posts under the title: “Destruction by the Numbers,” based on new information my brother Todd has added to his website: http://eyeonlakeo.com.
The first slide we will study is calculated under Historical Discharge Graphs for “S-80, Calendar Year 2010 to 2019.” S-80 is the Army Corp of Engineers’ structure located at the C-44 Canal that discharges water to the St Lucie River/Indian River Lagoon from two sources. First, from the basin surrounding the C-44 Canal; and second, through S-308 at Lake Okeechobee.
Todd’s chart allows us to isolate the most recent decade, 2010-2019, and see that the highest discharging year during this time was 2016 at 847,773 acre feet. 2016 was by far the worst year in recorded history for cyanobacteria blooms being discharged from Lake Okeechobee and spreading throughout the river system. There was such massive blue-green algae build-up at Bathtub Beach that the waves and shoreline were completely green.
Don’t be intimidated by the left axis’ measurement of acre feet. Acre Feet is easy to calculate as it means exactly what it says. The acreage noted, in this instance, 847,773 acres, would be covered by one foot of water.
For reference, I will use the Everglades Agricultural Area, (EAA), located underneath Lake Okeechobee that we talk about all the time. This farmed area, mostly sugarcane, is 700,000 acres. So 847,773 acre feet of water —dumped into the St Lucie River from S-80, in 2016 –would cover the entire EAA, and more, by one foot of water!
~The map below shows the EAA in a salmon color.
Back to the chart. The next worst year, following 2016, was infamous 2013, the year that became known as the “Lost Summer,” and really started the river’s revolution at 671,067 acre feet. At one foot deep, the amount of water discharged would just fit inside the boundaries of the 7000,000 acres of the Everglades Agricultural Area. It is interesting to note that 2017, a year not often mentioned, closely followed with 661,000 acre feet.
2018, a horrible water year, fresh in our memories, actually came in fourth at 402,116 acre feet! Obviously timing and temperature are factors too.
~2010, 2015, 2012, 2014, 2019, and 2011 follow. Of course 2019 is not even finished. It will be interesting to see where it ends up.
As we would have guessed, 2016’s toxic algae health hazard was the highest destruction by the numbers year in the past decade. But what we would never have estimated is how much water was discharged to the St Lucie River/Indian River Lagoon through S-80 in the 1950s and 60s. This number will truly blow your mind. But we’ll save that for the next “Destruction by the Numbers.”
The EAA is labeled and shown in a salmon color. It is approximately 700,000 acres.
S-80 is located along the C-44 Canal that connects Lake Okeechobee to the South Fork of the St Lucie River. Maps courtesy of the SFWMD.
The red line shows the historic flow (in both directions depending on water levels) of the Loxahatchee Slough. Courtesy of Todd Thurlow, “Time Capsule Flights.”
Today we continue our journey of the Loxahatchee Slough, once part of southwest headwaters of today’s “Wild and Scenic,” but also water-anemic, You will see that the Loxahatchee River is located in both Martin and Palm Beach counties. My brother, Todd Thurlow’s “Time Capsule Flight” guide-posts are below to give reference during your awesome flight of this area.
Again, as in some of Todd’s other videos, you will see that humankind has developed lands “right in the middle of a river.” Certainly we would have done things differently today!
For instance, the red line in the video and photo above shows the “Southern Path From the Everglades to the Loxahatchee Slough” using 1949-1950 USGS Topo maps. Today, this once “water wonderland” is completely developed, and channelized, shutting off the once intermittent, bi-directional flow, depending on rain levels and locations… to the Loxahatchee River.
It is kind of sad that most of us are completely unaware that this giant slough was once a flourishing “fork” of the Loxahatchee River. It took me awhile to figure it out. They should teach this stuff in school. Please watch Todd’s video below. You will be in awe!
In this video you will see:
0:00 1958 USGS 1:250K Topo Quad of Palm Beach and neighboring counties
0:05 I added the red line to the map showing the path of low lands between Loxahatchee Slough and the Everglades
0:08 Eight 1949 and 1950 1:24K USGS Topo maps
0:25 Fade away to a current aerial showing the red line and flying…
— north, from the intersection of State Road 7 (US441) and Old Hammock Way (just north of The Mall at Wellington Green)
— 0:30 across the West Palm Beach Canal
— 0:33 to the south end of Loxahatchee Slough (Behind Renaissance Charter School / Okeechobee Rd & Benoist Farms Rd)
0:46 Fly up the C-18 Canal, which now splits and drains to Loxahatchee Slough (C-18/Corbett Basin)
0:59 Turnpike and I-95 interchanges at Indiantown Rd. (SR706)
If one looks up the Loxahatchee River today there is hardly a mention of the once great southwest arm of the river, it is just a long skinny canal, ~the photo not even showing the large partially remaining Loxahatchee Slough now amputated from the river by development. https://loxahatcheeriver.org/river/about-river/
Water Catchment Area is how the Loxahatchee Slough show up on maps today. JTL
West Palm Beach Canal 1940 Aerials and 1958 Topo, Todd Thurlow
You will see:
0:06 1940 USDA Aerial Index of Palm Beach County
0:20 Eight 1949 and 1950 1:24K USGS Topo maps
0:45 Pinner Island (now known as Ibis Isle)
1:01 1940 USDA Aerial – West Palm Beach Canal outlet to Lake Worth
1:40 Lake Clarke area where the Palm Beach Canal now crosses under I-95
– The road “s” turning over the canal is actually the Seaboard Air Line Railroad (now CSX)
– The Florida East Coast Railway is 0.6 miles to the east (the next canal crossing downstream)
1:54 Lake Clarke – on the 1950 Palm Beach USDA Topo
2:54 Morrison Field Airbase (later renamed Palm Beach International Airport).
See: http://www.pbchistoryonline.org/page/…
3:37 SFWMD Offices south (left) of the canal across from the airport
4:11 Wide fade-in of 1940 USDA Aerial Index – ponds and bogs of western Palm Beach County
4:21 The northern end of what is now the Loxahatchee National Wildlife Refuge
(aka WCA1 – Water Conservation Area 1)
4:41 1958 USGS 1:250K Topo Quad showing western Palm Beach County
4:49 Twenty Mile Bend
5:05 Eastern portions of the Everglades Agricultural Area (EAA)
5:46 Canal Point at the western end of the Palm Beach Canal
____________________________________
Palm Beach County is a fascinating place, especially, as in 1925, Martin County was born of it. We are connected, as is everything in this water-world of South Florida.
Today, I feature another incredible “Time Capsule Flight” by my brother, Todd Thurlow. I have recently been studying Palm Beach County and Todd’s flights help me understand what was, what is, and would can be. Palm Beach County is interesting as unlike Martin County, it has been developed very far west into the historic Everglades.
When I made a big deal out of this, my mother gave me a book published in 2000 entitled OUR CENTURY, a conglomeration of articles by the Palm Beach Post. A historian, my mother smiled saying, “Jacqui, Palm Beach County always planned on going west…”
The first article I came upon was about Louis Perini, the father of “Westward Expansion.” Eliot Kleinberg writes: “In the mid 1950s West Palm Beach was only a mile wide. But a single land deal set off a westward land rush now limited only by the Everglades…”
And to the Everglades it certainly went!
To learn some canals while were at it, you’ll see that Lake Okeechobee is connected to the historic West Palm Beach Canal, which is connected to the C-51 Canal, which in turn drains the C-51 Basins to the Lake Worth through Structure-155. Like the C-44 Canal, both lake water and basin water can be transported through the C-51 canal damaging the water quality in Lake Worth ~Sound familiar? Very similar to the plight of the St Lucie/Indian River Lagoon. Tremendous amounts of precious fresh water wasted to tide, destroying ecological habitat and property values along the way. We must do better!
In any case, it is an amazing thing to really see that we are living in what once was indeed a beautiful marshy swamp.
Enjoy Todd’s flight “West Palm Beach 1940 Aerials and 1958 Topo;” it’s time-travel into Florida’s past and into her future. Again here is the video.
Lake Worth, fading 1958 topo map to 1940 US Ag Dept. aerials ~outlet of C-51 to Lake Worth. Looking west to 20 Mile Bend going north then west again as West Palm Beach Canal leading to Lake Okeechobee. Todd Thurlow
USGS 1958 Quad Western Martin and St.Lucie, slide Todd Thurlow, Time -Capsule Flights
Today, I present, yet another incredible Time-Capsule Flight by my brother Todd Thurlow. (https://jacquithurlowlippisch.com/todd-thurlows-time-capsule-flights/). This flight takes us on a tour over the Everglades, the Everglades Agricultural Area, Loxahatchee Slough, Allapattah Flats, Ten Mile Creek, and the St Johns River Marsh, fading in and out, so one can see what the landscape/waterscape looked like in 1958 using USGA topographical maps compared to today’s Google Earth maps.
What is most striking for me, is how undeveloped, how undrained, much of the land was in 1958, not really that long ago… 61 years ago. For reference, my husband, Ed, is 62 years young!
More than we can image has happened to South Florida since 1958…
For instance, when Todd flies by notice how little sugarcane and other crop production was taking place in the Everglades Agricultural Area just south of Lake Okeechobee compared to today. Now there are about 525,000 acres of sugarcane, back then, there appears to have been fewer than 50,000 acres of sugarcane in acreage.
Everglades National Park had been in place since 1947, but look at the difference in Whitewater Bay, as well as Taylor and Shark River Slough; and what about Florida Bay?
The Loxahatchee Slough region, near Jupiter, in Palm Beach County? Holy moley, notice how the once magnificent slough was made smaller by development encroaching from every direction, eventually leaving “Grassy Waters” at the southern end – as the sole water supply, via rainfall for all of West Palm Beach…
When Todd travels north over Marin, St Lucie, and the southern edge of Indian River County, perhaps the biggest shock for me endures, as I grew up in this area ~(For reference, I’m 55 years old 🙂
You’ll see that on the USGA map, southern Indian River, St Lucie, and Martin counties are shown in wavy blue as a gigantic marsh, at certain times of year, FULL of clean water!!!! Crazy! Since 1958 these lands have been drained (Ten Mile Creek) that was hydrologically connected to the marsh, through canals C-23, C-24 and C-25; and the waters of the St Johns “Stick Marsh,”( the headwaters of the St Johns River), a north flowing river, are now also drained south into the St Lucie River. Agriculture fields and nearby highways cover those most of those stick marsh lands today.
And the central larger marsh? “Allattah Flats,” also known as “Allpattah Marsh,” or in old military Indian war maps, “Alpatiokee Swamp? Well, the City of Port St Lucie, with over 250,000 residents, and acres of ailing greening orange groves, and more agricultural fields fill these areas today.
Just unbelievable, isn’t it?
Talk about “taking control of one’s environment. “Kind of cool, but I’d say we have really over done it, considering that now our waters, critical for life itself, are almost entirely impaired.
It is my wish that as the residents of Florida push their governments to work for cleaner water, and restore some of these lands, that we all keep in mind the history ofwhat the lands were, working with Mother Nature, not against her.
Todd’s Time Capsule Flights are an invaluable tool in recognizing how much human determination has changed these lands, and how a modern-day determination can restore them. Please click on below and enjoy! Thank you Todd!
An Incredible Flight! 1958 USGS Quads, the Everglades, Loxahatchee Slough, Allapattah Flats, and St. Johns River Marsh, by Todd Thurlow
1958 USGS Quads of the Everglades, Loxahatchee Slough, Allapattah Flats, and St. Johns River Marsh
This time capsule flight overlays three 1958 USGS Quadrangle Maps of southeast Florida from Florida Bay to the St. Johns River Marsh in Indian River County. You will see the following places: 0:30 Whitewater Bay 0:39 Shark River 1:44 The Everglades Agricultural Area (EAA) 2:20 Loxahatchee Slough 3:15 Allapattah Flats 3:35 Tenmile Creek 4:03 St. Johns River Marsh
My brother, Todd, has programmed a way to present a running comparative of satellite imagery in an easy way for all to understand. These images are a revolutionary tool for the St Lucie River movement and for the state of Florida. They help us to understand, and put us in a better position to ask for change as we are up to date and we know how things work. And although experimental, the concept is on track. Make this link a permanent part of your Lake Okeechobee tool kit. Read here:
If you’re like me, you might wonder about the various satellite images in the news and on social media showing the cyanobacteria, also known as blue-green algae, in Lake Okeechobee. What’s the connection between the colorized and the not? How do the scientists determine the colorized image? Where do they come from?
In this post, I share a link to my brother, Todd Thurlow’s latest creation, “NCCOS HAB Images.” This exciting site juxtaposes an experimental product of the National Centers for Coastal Science, NCCOS, being used to track Harmful Algae Blooms, HABs, in Lake Okeechobee, to NOAA True Color, or enhanced traditional satellite images.
The NCCOS images are referenced by The South Florida Water Management District, however, experimental. Experimental or not they are cool, tell us a lot, and they are interesting!
Before relying on a CICyano (Chlorophyll Cyanobacteria Index) image, scientists must first look at the “true color” version to determine if clouds or sunlight reflections have corrupted the data. Todd has made it easy for us to compare the NCCOS “Chlorophyll Cyanobacteria Index” pictures to the corresponding “True Color” picture. He processed hundreds of images, putting them side by side. Generally, if there are clouds on the right image, then the left image may not be so reliable. But if there are no clouds on the right, then the left image is a good indicator of algae.
This site is an awesome visual tool we can now reference as we continue to learn about HABs in Lake Okeechobee. Technology is a powerful path for connecting to a “better water future.”
Documenting the discharges, is critical whether by air, on the ground, or from outer space.
The two videos above were taken by me over S-308 at Port Mayaca, the opening from Lake Okeechobee to the St Lucie River, and over S-80 at St Lucie Locks and Dam on Friday, July 20th, 2018. The satellite images below, my brother Todd Thurlow provided, were taken the same day.
It is clear that the blue-green algae/cyanobacteria, covering, at its height, 90% of Lake Okeechobee, has run its course and bloomed. Now, as the “flower falls,” we see what’s left.
As seen in the aerials, and what the satellite images cannot portray, is that the algae is still there just lessened. Flying out over the lake a light green algae film remains over the water, a pastel shadow of its once flourescent self.
7-20-18, light colored algae, Lake O off eastern shoreline, JTL
The seven aerials at the end of this blog post were taken by my husband, Ed, this afternoon, July 22, 2018 around 4pm. The tremendous green shock is gone, but squiggly lines of nutrient bubbles remain, and blue-green algae visibly lines the eastern shoreline to be sucked into the gates…
Will another gigantic bloom arise? Another flower to replace the dropped blooms of yesterday? Only time shall tell…
One thing is certain. Nutrient pollution (Phosphorus and Nitrogen) is destroying Florida’s waters, and unless non-point pollution, especially fertilizer runoff from the agriculture community, is addressed, faster than Florida’s Basin Management Action Plan requires- pushed out 30 or more years, we are will be living with reoccurring blooms indefinitely.
Sentinel-2 L1C, True color on 2018-07-20.jpg 1,668×1,668 pixels, courtesy of Todd Thurlow. Visit Todd’s site here: http://www.thurlowpa.com/LakeOImagery/
Ed Lippisch S-308 at Port Mayaca, the opening form Lake O to C-44 Canal and SLR, 7-22-18
Ed Lippisch 7-22-18
Ed Lippisch 7-22-18
Ed Lippisch 7-22-18
Ed Lippisch 7-22-18
Ed Lippisch 7-22-18
Ed Lippisch 7-22-18
Timely quote for thought by the late Mr Nathaniel Reed 1933-2018
“…The fact that the Department of Environmental Protection and the Everglades Foundation have at last identified every polluter in the vast Okeechobee headwaters is an astonishing feat. The sheer number of polluters is mind-boggling.
The failure to enforce the possibly unenforceable standard (best management practices) shines through the research as testament to the carelessness of our state governmental agencies about enforcing strict water quality standards within the watershed.
There is not a lake, river nor estuary in Florida that is not adversely impacted by agricultural pollution.
As one of the authors of the 1973 Clean Water Act, I attempted late in the process to include agricultural pollution in the bill, but the major congressional supporters of the pending bill felt that by adding controls on agricultural pollution the bill would fail.
Now, 54 years later, fertilizer and dairy wastes are the main contributors to the pollution of the waters of our nation. Algal blooms are all too common even on the Great Lakes.”
In my last post, I shared my brother Todd Thurlow’s “Lake Okeechobee Satellite Images 1972-2013.” Today, I am sharing his Lake Okeechobee Satellite Images 1982-2018.
Hmmm?
In 1972, I was 8 years old…
In 1982, I was 18 years old…
A lot changes in ten years, and an extra-lot changes in the 100 years we have not taken good care of our state’s largest lake; this is now affecting millions of people and the remaining wildlife we have left.
Todd told me he did not “create by hand,” as I alluded to in my last post, but rather he used a USGS website tool to do it, and then converted, and loaded to YouTube, embed, etc.
In the last video the emphasis was on an a visible algae bloom in 1979, in this “video” the dates of algae blooms are not marked, but you can see clearly blooms towards the end as we reach 2018.
Unless something drastic occurs structurally, socially, and politically, I am sorry to say that we are doomed to have more and more algae blooms in the future.
~“The consequences of ignoring ecological planning and environmental protection could be economically devastating in a way not commonly foreseen.” Environments of South Florida Present and Past, by Patrick J. Gleason 1974.
I could never do what I do without the people who help me. My husband, his pilot friends, the everyday people sending me “toxic-algae” imagery, the River Warriors community, and when it comes to striking the bull’s-eye, my science-studied-lawyer, little brother, Todd.
Just hours ago, Todd forwarded these images from satellites, Landsat 7, and Sentinel 2, clearly showing a large algae bloom photographed yesterday in Lake Okeechobee. 102 square-miles of it!
So Florida state agencies, and others…
…Do not tell me the algae comes from our river. It does not. We have been through this before….
The algae, that can become toxic, and maybe already is, starts in, and comes from the crock-pot of Lake Okeechobee. The Army Corp of Engineers should stop discharging right now. Right when the Colonel sees these images. And these images have been seen, because NASA makes these images available to the Corp.
When a satellite image like this is made public, it cannot be ignored.
The ACOE should close the gates of S-308 until DEP has tested all edges of this large bloom. And work for never discharging when there is an algae bloom in Lake Okeechobee.
Since the ACOE and SFWMD have yet to develop public satellite imagery of algal bloom development in Lake Okeechobee with NOAA during rainy season, I go to my brother Todd. Ever since we were kids, he’s loved science and technology.
I have been bugging him lately for a satellite image…
6-4-18, Jacqui : Todd do you know when last high-resolution satellite photograph was taken of lake o and how to access this photo? Thank you.
6-4-18 Todd: Should have been a Landsat 8 image on 5/21 but it is not available for some reason. The Landsat 7 image from 5/29 is so bad because of the broken instrument that is not usable. Preview here, I would have to “order” high res but not worth it.
6-5-18 Jacqui : Thanks Todd
6-6-18, Todd: Hey Jac, the European sentinel-2 satellite took a good image yesterday. I will post it to my page tonight and add sentinel to the Landsat folder. It doesn’t show anything though. The sentinel-3 satellite took an interesting chlorophyll wavelength shot showing returns in the southern lake. However, it doesn’t seem terribly accurate because the returns over time have been all over the place. I will have to study more up on those types of images.
Sentinel-2 L1C, SWIR on 2018-06-05
Sentinel-2 L1C, True color on 2018-06-05
6-6-18, Jacqui: Well thanks Todd, thankfully that must mean at least for these images the algae is not so much that it’s visible to the satellite in space but we know some is there from 1st hand. This is good news for now. Can we keep getting images? Why ACOE and SFWMD don’t have and report on regularly is ridiculous.
6-6-18, Todd: …..
6-7-18 Jacqui: Hey Todd, the Terra image that is in today do you think that is algae or a cloud east of FPL Pond? Know hard to tell w/lower res.
Todd and I will keep you posted.
For more, go to Todd’s website, look for Firm Favorites; St Lucie River Discharges; Latest Lake O Satellite Imagery:http://www.thurlowpa.com
Page 10, historic Stuart Daily News, Special Edition 1937, in celebration of the Stuart to Ft Meyers Cross State Canal courtesy Knight A. Kiplinger
We are up to page 10 in our history lesson and today’s photos are some of my favorite. The first is an aerial of the St Lucie Inlet entitled “Stuart on the St Lucie River.” Since its earliest day’s, Stuart has always been defined by its proximity to the river. Below the aerial it boast: “World Famous For its Fishing, Provides an Ocean Entrance for Small Craft.” And by today’s standards, a rather comical or un-comical plug can’t be missed: “Where the Waters of Lake Okeechobee Meet the Atlantic.”
It is also fascinating to note the shape of the south side of the St Lucie Inlet as today it has shifted and filled in. I am sharing my brother’s Time Capsule Flight used in former posts as it is so interesting and shows the various inlets of this area and land shapes as documented on various historical maps. Although today, we try to make barrier islands, beaches, and inlets permanent, by watching my brother’s video the message is clear: “the only constant is change.”
“The St Lucie River Estuary Leading to Stuart, Six Miles upriver. Here, at Sewall’s Point in the Foreground, Is the Junction of the Intracoastal Waterway and the St Lucie. Stuart Bridge in Background.”
Photo of Jupiter Island, The Stuart Daily News, 1937, courtesy Knight A. Kiplinger.
My brother, Todd Thurlow, created a new “Time Capsule Flight” to give us historic perspective into my last blog post asking a question about an aerial photograph on page 3 of a 1937 Stuart Daily News, special edition, featuring Jupiter Island’s Golf Course.
“Fill or not fill?”
This was my question!
I had written: “When I first saw this photograph, it struck me that I did not recognize the area with exposed white sand on the east side of the island. I wondered if that was a remnant fan-like formation from an ancient inlet. Then it struck me that perhaps it was fill dredged from the Indian River lagoon for the golf course – or a combination of both.”
Todd’s video flight, using historic maps from 1883, 1885, and 1940 as well as today’s Google Earth technology, answered this question.
Jacqui: “Todd so after watching your time capsule flight it appears that the Jupiter Island Golf course was a natural wetland or mangrove something? It is sticking out into Indian River Lagoon on your oldest 1800s map- so it’s not entirely dredge and filled? Right?”
Todd: “Yep. Probably was swampy like Indian River Plantation (Marriott) and filled in with dredge from the ponds or Hobe Sound but more than likely before the channel/canal was dredged by the Feds in 1935. The Jupiter Island web-site says the Golf Course was built in 1922.”
Watch Todd’s video below and see for yourself the fascinating changes over time. Good for the golfers, not so good for the birds! Mystery solved by a Time Capsule Flight! Thanks Todd!
Todd’s video Jupiter Inlet 1883, 1885, & 1940 Lake Worth to South Jupiter Narrows: (https://youtu.be/VwoAXOrtRu4)
I guess one could say the St Lucie River is getting a new year’s present in that yesterday was the last scheduled release from Lake Okeechobee by the Army Corp of Engineers. The entire situation has a similar theme to an abusive relationship where the beaten thanks their oppressor for finally halting…
Due to Temporary Flight Restrictions (TFR) because of the President’s visit to Palm Beach, it was not possible to fly south along Jupiter Island from Witham Field in Stuart, however, when the wind and runway changed my husband, Ed, was able to get a few aerials at the Crossroads of the St Lucie River and Indian River Lagoon around Sewall’s Point. No seagrass, but the water already looks better.
After being decimated in 2013; part of 2015; toxic in 2016; and experiencing a no-holds-barred discharge rate since September 20, 2017, post Irma; we will continue to fight for the EAA Reservoir’s success and a better 2018 for our St Lucie River.
We shall never, never, never, give up!
Please see links to my brother Todd Thurlow’s website for St Lucie Canal Real Time Flows S-80 Cumulative 2017 and Latest Lake O Satellite Imagery
If the discharge waters of Lake Okeechobee filled up the City of Stuart, Florida. Last Thursday, they would have reached the top of Stuart’s iconic water tower that stands at 134 feet.
Stuart, North of Monterey.
Whereas, if the ACOE’s discharge waters of Lake Okeechobee were “filling up the City of Stuart,” last Thursday, October 26, these polluted waters, would have reached the top of Stuart’s iconic 134 foot water tower…
Whereas, once again, our economy and ecology is completed devastated, and high bacteria levels in the water are exacerbated therefrom….We shall remember this day…
We shall, therefore, designate, Thursday, October 26, as “Water Tower Day” and say together: “Lake O discharges have reached the top; this must STOP!”
Stop the Discharges
Yes, to put the Lake Okeechobee discharges into perspective, last Thursday the cumulative 2017 ACOE/SFWMD discharges from S-80 passed 134 “Stuart Feet”. The Stuart water tower is 134 feet tall. See my brother Todd’s cumulative total page below:
– In the lost summer of 2013, Stuart/Martin County received 284 “Stuart Feet”, 2.1 times the height of the tower.
– In 2017, the gates did not open until September 5. So it took only 52 days to accumulate that same amount of discharges!
– In 2013, the discharges started on May 8 (with the exception of some small pulses earlier in the year). That year, it took 91 days to hit a cumulative “134 Stuart Feet” – on August 7.
In other words, the discharges have been almost twice the rate as they began in 2013. You can see this in the slope of my brother’s graphs in the web page above. This doesn’t really mean a lot though. In 2013 the discharges didn’t really begin to accelerate until mid-July. At that point, the rates of discharge were comparable to what we are getting now.
– At the current average of about 4200 cfs, we would hit the 2013 total of 284 Stuart feet in another 42 days (December 9). If they are saying the discharges could continue for months, this could happen. We could have another record year, even though the disaster didn’t start until September. Maybe they will throttle it back a little or start pulsing again so it won’t be the case. In any event, this is already another lost year…
(This blog post was based on writing and ideas by my brother and contributing blogger, Todd Thurlow, http://www.thurlowpa.com)
* I edited this post from “today” to “last Thursday.” An ever rising story. 🙂 JTL
Say No to Lake O
“Say No to Lake O,” this is one of the rallying cries of the River Kidz. If only it were as easy as just saying “no.” According my numbers-man, my brother Todd, the “St Lucie River has taken in more than 86+ billion gallons this year, enough to put Stuart under 111 feet of water. This is only enough to take 6 inches off of the lake.” The west coast is taking most of the lake level reducing water and of course they are screaming “say no to Lake O” too.
Eco-Voice, present west coast advocacy, 10/17.Realistically, with the Army Corp of Engineers reporting the Lake level at 17.07, today, it will be a few more weeks of releases to get near or under 16 feet. A safer number for the dike and for the people who live in fear of it breeching. Not to mention the 525,000 of acres of protected sugarcane… http://w3.saj.usace.army.mil/h2o/reports.htm
Black Gold, the muck soils south of Lake Okeechobee. (Photo JTL, 2014.)I do believe the authorities are getting the message, though…so keep screaming. SAY NO TO LAKE O! For everyone!
I think our water culture is changing, and the government is being forced/inspired so they can get reelected and respected…. to improve our water/rivers situation. Just yesterday, I got an email about a woman whose Bascom Palmer doctor notes she has an eye infection in her cornea very possibly from “walking the bridge,” repeatedly over the St Lucie River.
I am not making this up.
These health issues are real. More and more people are realizing this. Lake O and other canal unfiltered pollution must halt.
So it looks like the Lake Okeechobee is going down, but we are still going to get releases for while. (See the info below on my brother’s site.) Things are still bad, but they are getting better.
~Never stop screaming “Say No to Lake O,” we owe it to ourselves, and to the future.
Hydro. Lake is going down._________________________________________________________________
Great information below!
Jacqui,
It looks link the lake is coming back down. See the graph links on my Firm Favorites Page:
It’s hard believe that we have taken 86+ billion gallons this year, enough to put Stuart under 111 feet of water. But this is only enough to take 6 inches off of the lake. The west coast is taking most of the lake level reducing water.
By the way, I have a new link of my Lake O Satellite imagery page that will actively pull up the last 7 days of low res images from all three satellites: St Lucie River Discharges Latest Lake O Satellite Imagery (http://www.thurlowpa.com/LakeOImagery/) Click on the “Terra/Aqua/Suomi Last 7 days icon”.
Best regards,
Todd
Thomas H. Thurlow III THURLOW & THURLOW, P.A. 17 Martin L. King, Jr. Blvd. Suite 200 P.O. Box 106 Stuart, FL 34995-0106 Phone: (772) 287-0980 Facsimile: (772) 220-0815 Email: todd@thurlowpa.com Web: http://www.thurlowpa.com
The following is a texting conversation between my brother, Todd, and me, just over an hour ago. As you can see, Todd keeps me in real-time. Now, I wish to share with you.
Todd: Hi Jacqui, looks like it’s “balls to the wall” —like the old jet fighter saying.
Lake O is at 17 feet and rising…
Jacqui: Holy —! Didn’t Gary Goforth say the max for S-80 is 12,000 CFS? How much is this?
Todd: This is normal high-end. ~4000 cfs. In 2004-2005 it looks like they maxed at 5-6000cfs. I’ll graph against the lake stage.
Jacqui: How do u know it’s 4000? I see nothing posted 4 today on ACOE site.
Todd: S-80 hit 6,727 cfs on 10/06/2004. The lake was at 17.86 and rising it peaked at 18.02 on 10/13/04.
Hurricane Jeanne had hit days earlier on Sept. 25
Jacqui: I remember that. Bad.
Todd: Also. The 4000+ right now is instantaneous. The stats you always see are a mean for the day. Right now that are piling between 1000cfs and the high 5000s. It looks like they did almost hit 6000 earlier today.
Pulsing not piling.
Jacqui: Awful. I think it stinks that unless you know how to access all the technology, you don’t know the river is getting slaughtered until the following days. A nightmare. Thanks Todd. Goodnight.
Hurricane Irma may be gone, but her waters are not. Our now black river and the giant plume off the St Lucie Inlet attest to this. Clean rain that fell in our region during the hurricane is now filthy “stormwater” discharging, unfiltered, through manmade canals C-23, C-24, C-25, and C-44. Nature did not design the river to directly take this much water; this much water kills.
Every plume looks different, and this one is multilayered with no clear border. Sediment soup, black-brown in color, yesterday it extended out about 2/3 of a mile into a stirred up Atlantic and flowed south, in the rough waves not quite having made it to Peck’s Lake.
Since Hurricane Irma’s rains, area canals dug with no environmental foresight in the 1920s and 50s for flood control, and to facilitate agriculture and development, have been flowing straight into the river. On top of this, in anticipation of the hurricane, three days prior to IRMA the Army Corp of Engineers began discharging from Lake Okeechobee. During the hurricane they halted, and then started up again at high discharge levels reaching over (4000 cfs +/-) this past Friday, September 15th. As Lake Okeechobee rises and inflow water pours in from the north, and is blocked by the Everglades Agricultural Area in the south, we can expect more Lake O discharge on top of the canal releases themselves.
As advocates for the St Lucie River we continue the fight to expedite the building of the EAA reservoir and to create a culture to “send more water south.” In the meantime, we, and the fish and wildlife, and the once “most bio diverse estuary in North America,” suffer…
My brother Todd, has complied many other links on his website’s favorites under St Lucie River and ACOE/SFWMD: http://www.thurlowpa.com/news.htm
Post Irma flight over St Lucie River/IRL 9-17-17
SFWMD canal and basin map. C-44 canal is the canal most southerly in the image. All canals shown here discharge into the SLR/IRL.
The confluence of the St Lucie River and Indian River Lagoon at Sewall’s Point, an area once full of seagrasses and fisheries and formerly considered the heart of “the most bio diverse estuary in North America.”
Waves in plume breaking over offshore reefs; looking north to Hurchinson Island.
Southern edge of plume along Jupiter Island and Jupiter Narrows south of St Lucie Inlet.
Looking south off St Lucie Inlet.
South edge of plume looking south towards Jupiter Island.
On Halloween eve, October 30th 1979, the southwest side of the dike embankment at Florida Power & Light Company’s Martin Plant suddenly, and without warning failed catastrophically.
It was the dead of night and certainly the creatures of the nearby Barley Barber Swamp sensed more than their human masters. No person saw the incident. There were no cameras, no guards, no witnesses. It was the 1970s.
We can imagine, though, even though the final report said “not,” that for months sands had been slipping, eroding underground, perhaps led by connection to the old borrow pits dug for the railroad that came through in the 1920s.
My brother Todd’s latest spectacular time capsule flight takes us through this fateful night that by the time Halloween arrived, derailed a southbound train. The conductor reported the incident to his superiors as a “flash flood.” It was eventually realized that this flash flood was part of something much larger in scope!
Even if you know the story, the numbers are staggering…
As Todd notes, when the dike let loose, 100,000 cfs of water (cubic feet per second) blew into L-65, the canal on the edge of the FPL reservoir, and into the C-44 canal connected to the reservoir at S-53. The biggest numbers we hear these days in cfs is about 5000.
Facing west, a wave surged over the sugarcane fields and overtop US 441, traveling north seven miles in the rim canal. S-308 at Port Mayaca flowed backwards, and 4000 cfs entered Lake Okeechobee.
The finally alerted ACOE maxed S-80 at St Lucie Locks and Dam at 15,800 cfs, (over twice the highest amount of the Lost Summer of 2013 at 5700+/-). Crazy! Todd says the max for S-80 into the St Lucie River is 16,900 cfs. Not too far off were they.
Of course, these peaks would have only been for a few hours, but nonetheless, as is often the case, these kind of numbers mean “instant death for the St Lucie.”
This FPL event traveled much further north than the C-44 canal though; the last paragraph of the SFWMD 1980 report’s “failure section” notes:
“The Rim Canal reached a peak the next day (November 1) at the north end of the basin, 17 miles from the St. Lucie Canal. The flood was contained at this northerly point by the Nubbin Slough Tieback Levee along Canal 59. The maximum area flooded, was about 14,100 acres.”
What a story!
Well, it’s only history, right? But then history has a strange way of repeating itself in one form or another doesn’t it?
From the air, Barley Barber Swamp is distinctive. Like a thimble, it sticks out into Florida Power and Light’s reservoir in Indiantown, Martin County. The 6700 acre “man made lake” can hold more than 80,000 acre feet of water. It lies just north of the C-44 canal, and east of the dike from a once sprawling Lake Okeechobee. Barley Barber is the “crown jewel.”
“This jewel of a swamp” is a popular tourist destination and considered to be one of the finest remaining old-growth cypress communities in the country. In 1972, FPL purchased the swamp and surrounding lands to build their 6700 acre cooling reservoir that it operates in agreement with the South Florida Water Management District. An intake canal connects to the C-44 and S-153 to the northwest, contains and drains waters that once naturally flowed into Lake Okeechobee.
It is a wonderful thing that FPL saved the remaining 400 acre swamp! Today it is teeming with plant and wildlife species, including ancient bald cypress tress, one qualifying as the largest in the United States. My brother, Todd, notes that some estimates put that tree at 1,000 years old. The Wikipedia entry says its 88 ft. tall with a circumference of 33 ft., while the “Lady Liberty” tree in the same park as the late “Senator” is 82 ft. tall and 32.8 ft circumference – and is claimed to be 2,000 years old?
Hmmm? Maybe in south-central Florida we are really in first place!
Giant cypress tree, Barley Barber Swamp as shared by Modern Mississauga Magazine, 2016.
Cypress are valuable and majestic water trees. It’s so nice to have what’s left, but one can’t help but wonder what the swamp looked like before its ancient branches were cut for lumber, and its massive stumps burned to make way for agriculture?
Well, we can can know…almost… I asked my brother, Todd, historic map expert, if he could show us, and he has created yet another “time capsule flight” video to take us there!
Using 1940 United States Department of Agriculture aerials, a 1953 USGA topographical map, and 1974 Florida Department of Transportation map juxtaposed to Google Earth images from today, we see the swamp in all its glory stretching east with forks, like a “river of trees.” What a beautiful, beautiful swamp it must have been!
Before it was cut down, Todd calculates it at 3076 acres, or 14.81 square miles. Amazing! I wonder what animals lived there? We can imagine alligators, and owls as the images fade in and out. And then we see the swamp’s stately trees replaced by the shape of the reservoir; we see the tree stumps burning, and smoke rising the sky. An offering perhaps…
….as humans we seem determined for the theme of our lives to be “Man over Nature.” Well, sometimes we win, and sometimes we lose…
Today, Todd’s video focuses on the structure and size of the former Barley Barber Swamp, but in Part II, he will share yet another story, the 1979 catastrophic failure of the FPL reservoir that burst through its dike like a tidal wave…


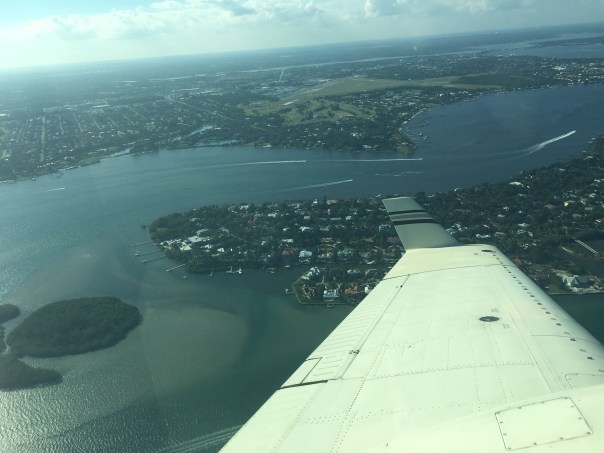


