


Since 2013, I have had a folder in my computer labeled “Best Worst Photos.” At the end of the year, I rate them and chose a “best worst day.” A contradiction in terms…
Having grown up along the St Lucie River/Indian River Lagoon there is nothing I rather do than photograph its beauty. But this is no longer always possible. Such has become my fate to photograph its demise garnering support for change. I could not do this without the support and help of my husband, Ed Lippisch.
Usually when I blog, I share one or two aerials of a series of photos; to see them all as taken in order has an effect. So today, as 2018 comes to a close, I will share all of what I consider to be our “best worst photo day” for 2018: June 24th’s massive cyanobacteria bloom in Lake Okeechobee, S-308, Port Mayaca ~the structure that the ACOE uses to discharge Lake Okeechobee water to the St Lucie River…


TWO VIDEOS
Lake O structure map SFWMD/ACOE: https://www.sfwmd.gov/sites/default/files/documents/facility_map_overview.pdf


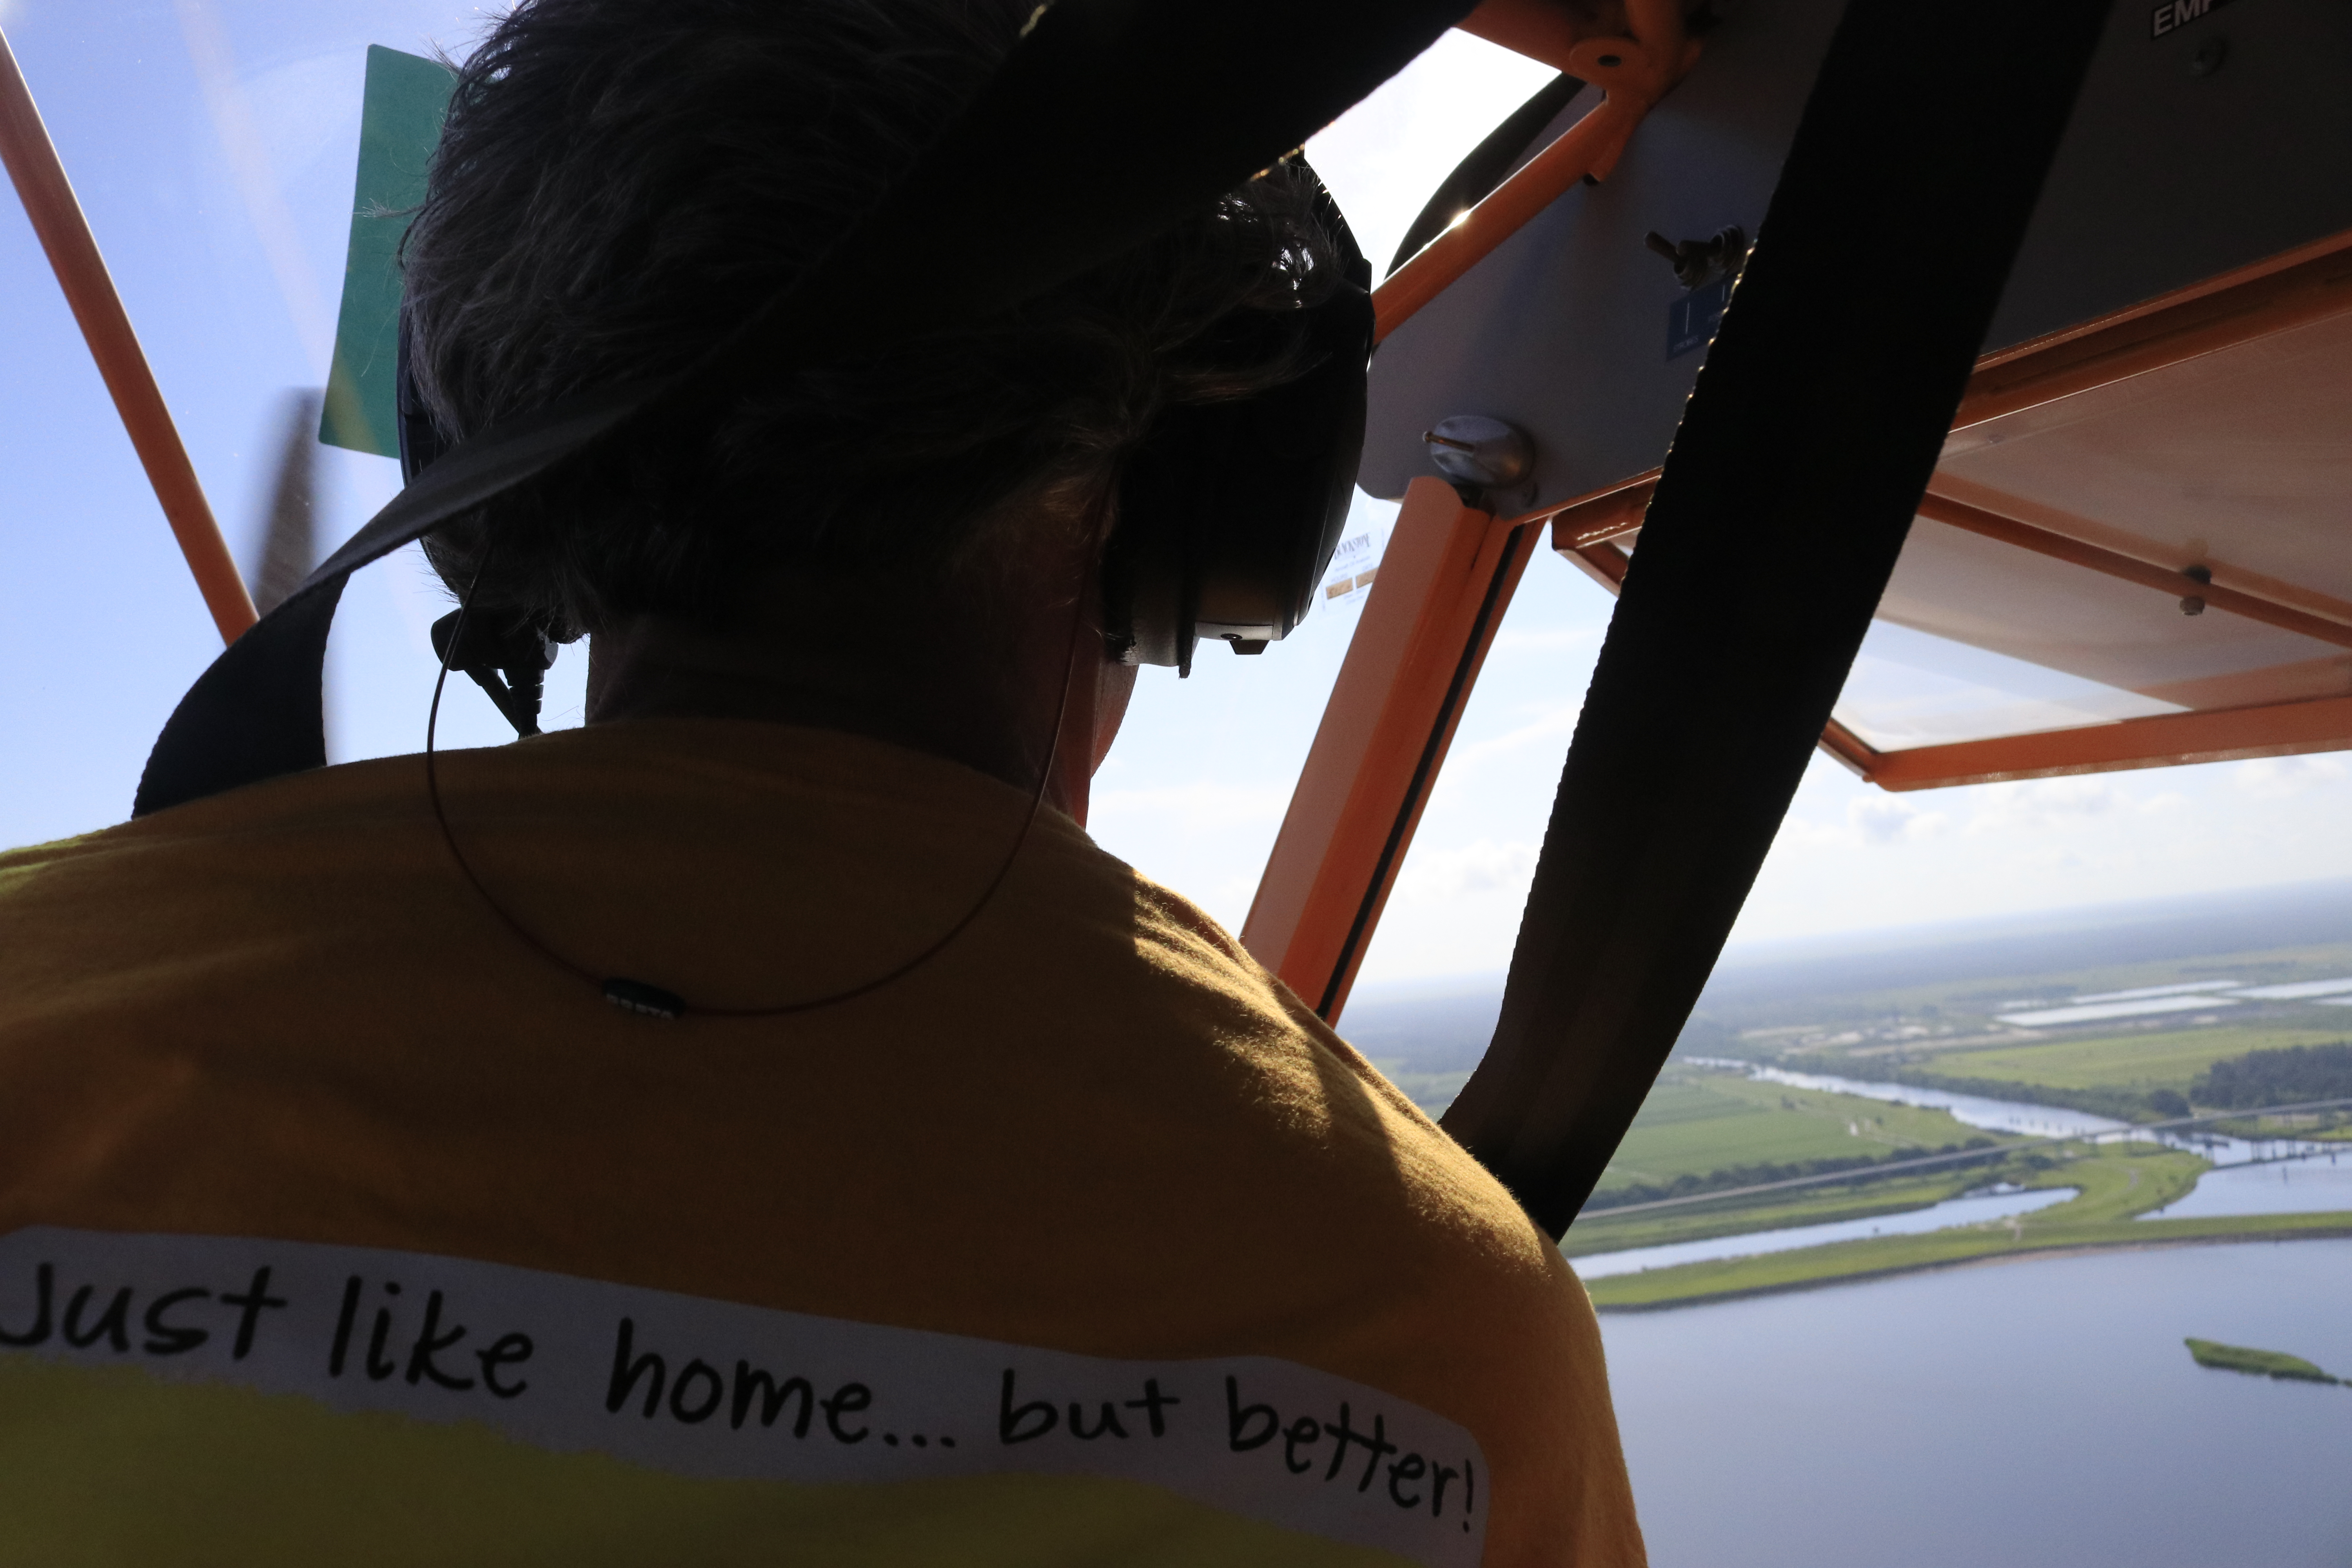
On Saturday, my husband, Ed, took my brother, Todd, up in both the Cub and the Baron to look for a the large algae bloom Ed and I had seen last Wednesday in Lake Okeechobee. I went along for the Baron ride, but the Cub only holds two.
Maybe you, like me, after listening to the news the past few days, realized there were other blooms reported, even a “small one” in Pahokee on May 20th by famed biologist Barry Rosen, of USGA. I wondered if Todd and Ed would see more blooms, other blooms…
Saturday, July 22, 2017, was much more overcast than the previous Wednesday, so the lake photos Todd took are not as bright in color, but the “southwest of Port Mayaca” bloom is definitely still there. Todd did not report any others during the trip and the GPS track shows that he and Ed went quite far north and west. (Channel 12 reported on two blooms on Lake O’s western shore…)
Before the flight, Todd also shared the most recent Landsat 8 satellite image that shows where the large “southwest of Port Mayaca” bloom is located although here too, there are a lot of clouds blocking the image…

After Wednesday’ s post, many were asking me if there were visible blooms in the St Lucie River or C-44 Canal.
The answer: “No.” From 1000 feet up, there are none visible. But there are the “bubble like nutrient swirls” that seem to proceed the blooms in some areas. (You’ll notice these in Todd’s photos and all 350+ photos are linked at end of post.)
I did notice that on Facebook a small bloom was reported at Rivers’ Landing in Palm City, and another one on rocks in the North Fork. The Caloosahatchee has indeed reported a pretty significant bloom…blooms are in the estuaries but the motherload is Lake O.
Have you seen any blooms? If so, here is the link to report algae blooms to the Department of Environmental Protection, “DEP.”
It is important to report what you see!
http://www.dep.state.fl.us/central/Home/Watershed/ReportProblem.htm
I happened to notice when I visited the DEP website that DEP states: “Blooms are naturally occurring.”
…Yes this is true; so is cancer.
However, nutrient pollution that feeds these algae blooms and is killing our estuaries, and possibly us, is entirely man-made. We know what causes it.
We must be more diligent and creative in stopping the nutrient run of from agriculture and development. “Taking measures”as noted in the DEP quote as the game plan just isn’t enough. After all, this is a war to save our Florida.

__________________________________________________________
QUOTE on DEP web page regarding algae blooms: http://www.dep.state.fl.us/water/bgalgae/
|
“There are no short term solutions to rectifying the situation; this is a naturally occurring phenomenon that the State monitors closely. However, the state is taking measures that in the long-term will reduce nutrient loading and improve water quality.” DEP, 2017 website
|
LINKS:
Weather Channel story with photo of small bloom found in Lake O at Pahokee and reported on May 20, 2017 by USGA biologist, Barry Rosen: https://weather.com/science/environment/news/florida-algae-bloom-lake-okeechobee
USGA: Tracking the Bad Guys 2017: https://www.usgs.gov/center-news/tracking-bad-guys-toxic-algal-blooms
A great book on the subject of nutrient pollution: Clean Coastal Waters, Understanding and Reducing the Effects of Nutrient Pollution: https://www.nap.edu/catalog/9812/clean-coastal-waters-understanding-and-reducing-the-effects-of-nutrient
LANDSAT 8

Photos by Todd Thurlow SLR, C-44, Lake O


See all of Todd’s photos here: http://www.thethurlows.com/LakeO_07-22-2017/

Hello Readers. Hope you are having a good summer!
Even though I am supposed to be on a “blogcation,” my husband, Ed, and I decided to fly over Lake Okeechobee this morning as yesterday Dr Susan Gray of the South Florida Water Management District reported on the Army Corp of Engineer Periodic Scientist Call that recent Landsat Satellite images had revealed significant algae in the middle of the lake- – – an area known as “LZ40.”
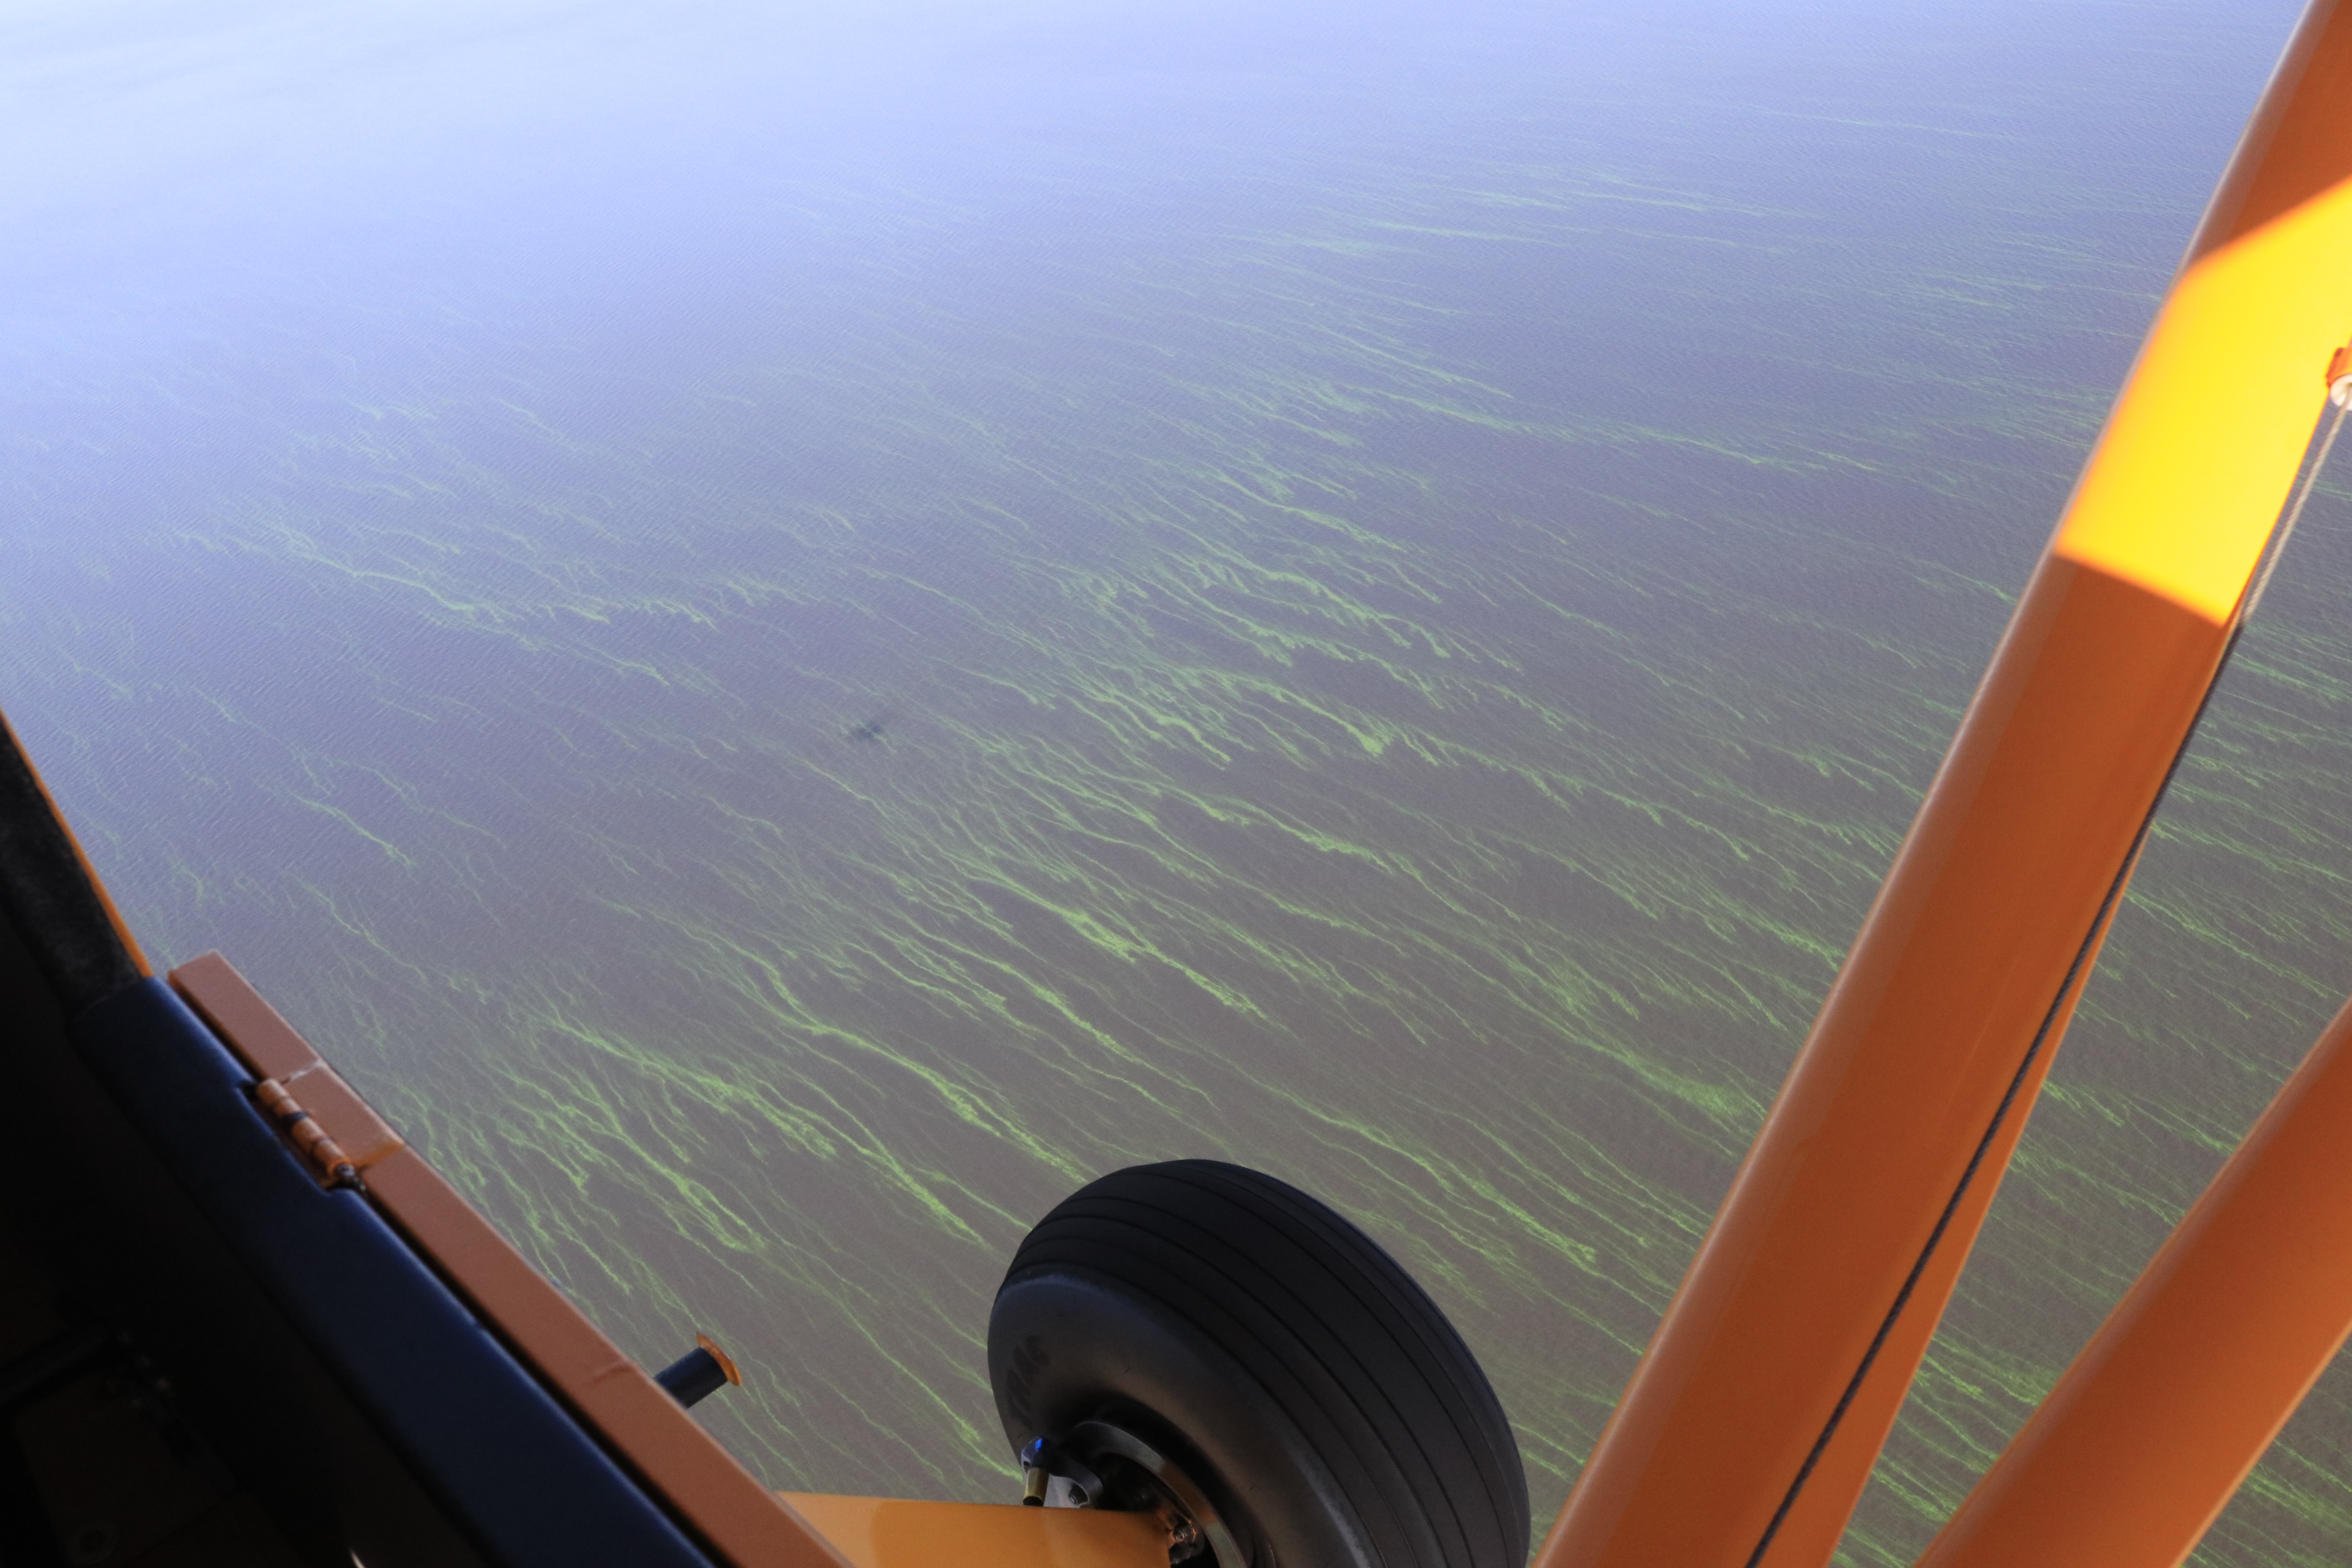
Sure enough, once Ed and I got up in the air, just a few miles west of Port Mayaca, the strings of bright green algae were visible from about 1000 feet —-looking down— up to as far as eye could see…
Very strange to be surrounded by water and bright-colored lines of algae; it resembled miles of suspended fluorescent paint. I have heard the scientists talking about how the algae comes up in the morning for sunlight and then goes back down into the water column later in the day. It is intelligent, like an animal, and knows how to hide. You have to track it….
The living bloom was quite extensive, going on for many miles. My photos do not do the color or amount justice, but do document. This is important.
Thank God the ACOE is not dumping into the St Lucie River/Indian River Lagoon this summer. Poor lake O, on the other hand, has been getting “backwards flowing” C-44 water and back-pumped water from the EAA, STAs, and WCAs. No wonder its a mess!
Thank you to the SFWMD for the heads up! We do appreciate your work. We have inherited and created “quite an animal.”
See everyone soon.
Jacqui
*STA is storm water treatment areas
* WCA is water conservation areas

SFWMD website: (https://www.sfwmd.gov)
NOTE OF INTEREST:
*Reader, Professor Geoff Norris recommends we ask NOAA to create a bulletin for Lake O like this one here for Lake Erie since basically we are “in the same boat:” I think this is a great idea. I will have to contact NOAA.


_____________________________________________________________________________


Some things change…
And some things stay about the same….
Today, I was looking though my family library of photos and saw one from 2005, the year Ed and I got married.
“Boy we looked young,” I thought…”We have really changed…”
Then I noticed these SFWMD nutrient loading maps in the same file, as they were “published” in 2005 as well. These awesome maps were shared by SFWMD’s Boyd Gunsalus, such a helpful and smart person when it comes to water.
These SFWMD maps were very helpful to me when I was first learning about phosphorous and nitrogen loading by basins and Lake Okeechobee. The lake’s cumulative pollution is even higher than the different canals/basins. I would bet these numbers have not changed much. The state’s approach with BMAPS and TMDL’s is to be appreciated but just too slow.
Well, Ed and I have clearly aged and changed… but the maps–I bet if they made new ones for 2005-2016, the numbers would look about the same. I can’t say I’m envious. We are meant to change. To get better.
___________________________________________
Maybe a scientist will chime in and let me know???
