“Until the public is able to understand how all of this stuff works, we’re never going to have accountability,” said Jacqui Thurlow-Lippisch, SFWMD Governing Board member 2019-2023. ~Article TCPalm “Florida’s BMAPs are Failing”
Literacy. It is the key to all things. Being able to read and understand allows one to SEE for oneself what works and what is broken. The Florida BMAP public process is broken. BMAP reports on “improving waterways” are painfully complicated and pollution is increasing not lessening. When the state legislature does not meet its goals dependent on the Department of Environmental Protection, the South Florida Water Management District and the Florida Department of Agriculture, politicians simply push deadlines into the future because BMAPs read like a foreign language and thus accountability by the public is impossible.
Now that will change.
Todd Thurlow, Eye on Lake O, has created “Water Data Maps” that are readable and easily show pollution levels so we can SEE the nitrogen and phosphorus killing our waterways and where it is coming from. We don’t need 15 years. We don’t need 30 years. We can see it today, for action today! Please explore the website and I will be writing more on this in the near future.
Today I share “on the water” visual reporting by my brother, Todd Thurlow. On Saturday, March 18, 2023, Todd and family took a boat ride to the popular Sandbar area just inside the St Lucie Inlet of Martin County. This is a region my husband Ed and I have been documenting since the 500 cubic foot per second discharges from Lake Okeechobee began by the Army Corp of Engineers on January 22, 2023. First there was no algae reported then there was. The ACOE has started and stopped at least three times as reported by TCPalm, but now with the weather cool the gates are again open.
For months, from the air, the historic seagrass beds have looked like a desert.
Todd’s pictures close up, on the water, show some life and give hope that by June or August there may be more lush seagrass meadows as retuned in 2022. Sprigs of seagrass, although light, are visible along with young welch, conch, and moon snails. Wading birds and sea birds can be seen feeding on and around the flats. Rays or manatees take off -hiding in sand cover. Such a beautiful place! This area and its critters are protected; be careful and thoughtful when boating here. It is an Indian River Lagoon aquatic preserve.
Ravaged by discharges from Lake Okeechobee in 2013, 2016, and 2018, the SLR/IRL does not need any Lake O water, this particularly holds true when blue green algae has been reported by the SFWMD, ACOE, FDEP, and the public.
Thank you Todd for this documentation 3-18-23 taken around 11: 50 am.
Thank you for FWC – Florida Wildlife Commission- for creating these IRL Aquatic Preserve signage to help educate and protect seagrasses. Please share! IRL A.P. 18-24 large seagrass_sgn
Todd Thurlow is the author of the website eyeonlakeo.com for “science for the everyday person.”
Images below from Todd Thurlow’s “East Ocean Blvd. & Dolphin Drive 1940, 1958 time capsule flight” reveals the drainage of Witham Field in Stuart, Florida.For some reason as I drive around, I am preoccupied with drainage. Over-drainage that is. I always remember my father’s high school farmer friend Mr Haddad saying to me: “Jacqui, we spent one-hundred years taking the water off the land and we’re going to spend one-hundred years putting it back on…”
I have been wanting to write something about Stuart’s Witham Field for a long time. I have flown out of it for years, Ed and I going up to take photographs of the St Lucie River/Indian River Lagoon. What a surprise when I finally figured out the ditch behind Ed’s hanger is part of the remains of Willoughby Creek! Aggg!
The land Witham Field sits upon was ditched and drained long ago and parts of the land the airport sits on held the headwaters of Willoughby Creek.
If you’re ever driving east past Witham Field on Monterey Road (714) at Kingswood Drive you’ll notice a fairly wide ditch. This ditch bends east, widening, and then getting skinny again, eventually going under St Lucie Boulevard, and then dumps into the St Lucie River.
-Screenshot of Google Maps showing canal along Monterey and Kingswood Drive dumping to the St Lucie River then turning right to gold course.Another canal goes all along the airport behind the houses on St Lucie Blvd. until the Sailfish Sands golf course. Curving around St Lucie Boulvard, which becomes Indian Street, one will see a restored fork or section of Willoughby Creek and next the bridge going over Willoughby Creek itself. This is the bridge where people often observe manatees.There are more ditches that are off Dixie Highway that lead back into the airport that one cannot see from the road.
-The surrounding lands, especially ponds around Willoughby Creek, once drained into Willoughby Creek. These ponds are long gone and the runoff waters have been directed into small reservoirs and ditches. Thankfully, Martin County has worked hard to improve the water quality in this area.
It remains rather amazing to look back and think on what these lands in the “middle of town” used to be. Large ponds surrounded by wetlands, scrub habitat, and certainly areas of tall sand and slash pine.
Watch my brother Todd’s time capsule flight below to view old Stuart including the lands where the Witham Field sits. Once an oasis for birds, deer, gopher turtles and other wildlife, today it seems like it was always an airport. It wasn’t.
To see the area of Witham Field go to 2:29 in video if you see it below, if not CLICK HERE.
-Ditch on Monterey (714) and Kingswood -Ditch/Canal on Kingwood -Ditch/Canal coming from Kingswood to St Lucie River. Water looks pretty gross. -Other side of St Lucie Blvd. Outfall into St Lucie River. It’s at a speed hump. -Part of restoration of Willoughby Creek on Indian Street. This goes much further back.
-Not a great photo but you see the manatee sign at bridge over Willoughby Creek on Indian Street. The manatees love it here where it is warm and they are protected.
Today’s blog post is about western Martin County Florida’s Palm City. This post includes my mother’s inspiration, my brother Todd’s time capsule flight video, and my writing.
Palm City was once narrow strips of pine flatlands interspersed with hammocks, ponds, wide prairies, sloughs, sawgrass and cypress trees. Today it is a bustling part of Martin County due to the drainage of the C-23 canal on the north, and the C-44 canal on the south. When one attempts to unravel the long history of drainage of Palm City, it is helpful to think in three connected but separate levels: local, state, and federal.
In 1919 the Palm City Drainage District was created. It was established for a local level as a special drainage district by the Florida Legislature with a lifetime of fifty years. It was primarily created to drain newly established Palm City Farms. Miles of canals and ditches were dug to drain into Bessey Creek, Dansforth Creek, and the South Fork of the St Lucie River. Some of these canals and ditches still exist today or have been incorporated into larger canals.
Digging of the St Lucie Canal in the south began around 1915 lasting into 1926. It was dug by the Everglades Drainage District, State of Florida, from the South Fork of the St Lucie River to Lake Okeechobee. After the deathly hurricane of 1928, the federal government authorized widening and deepening the St Lucie Canal to create the Okeechobee Waterway also known as the Cross State Canal from Stuart, across Lake Okeechobee, to Ft Meyers. Doing so allowed the St Lucie Canal to conveniently function as the main outlet for Lake Okeechobee’s flood waters. Later, after the great flood of 1947, the canal became part of the Central and Southern Florida Plan and renamed C-44 becoming part of the giant Central and Southern Florida Flood Control System of the Army Corp of Engineers.
The great flood of 1947 called not just for the widening and depending of the St Lucie Canal and enlargement of its structures, but the federal Flood Control Act of 1948 authorized more canals, levees, and structures to be built by the Army Corps of Engineers throughout southern and central Florida. Among the new canals were the C-23, the C-24 and C-25 canals of Martin and St Lucie counties -all discharging into the North Fork of the St Lucie River. The state asked for and supported this. The C-23 is the border between Martin and St Lucie Counties. Of course there were major unintended consequences that added to the discharges of the St Lucie Canal and the original Palm City Drainage District. This plethora of fresh, dirty water has all but killed the St Lucie River. Improving the health of the St Lucie is the goal of local, state, and federal restoration efforts today.
-Below: the federal government’s (ACOE) Central and Southern Florida Flood Control Project authorized by Congress in 1948 included C-23 on the border of Martin and St Lucie Counties, C-24, and C-25,- and enlarging the flood control structure along the St Lucie Canal. Once this system was built out it was turned over the state of Florida’s Central and Southern Flood Control District; however, the ACOE kept the St Lucie Canal now named C-44, for federal flood control. The Central and Southern Flood Control District, a Florida state agency that followed the Everglades Drainage District in 1949, became the South Florida Water Management District in 1977. -Below: A 1973 C&SFP update map, Army Corp of Engineers. Green never built thank God!
Today I continue to reflect on Hurricane Ian, Southwest Florida’s Category 4 storm of September 28, 2022. I ask the most basic of questions: “Where exactly did Ian make landfall?” This question seems simple, but it is not, and is best answered sharing a text exchange with my brother Todd after the storm.
Todd: “The National Hurricane Center Track is just connecting dots that are two hours apart — at each official update, seen below. Thus, the line does not show the wobble of the center of circulation. The second fie is the archived radar data showing the eye at 19:05 UTC (3:05pm ET). It’s a pretty good indicator of where the center made landfall.”
Jacqui: “Hmm, incredible. Looking back through my screen shots, this Weather Channel one is interesting because it shows all the shifts – those wobbles you note – and Ian clearly makes landfall at Cayo Costa not Boca Grand.”
Todd: “Yes that must have the intermediate positions so more wobble showing. My computer has been grinding radar data for about 15 minutes for a video and is 39% finished. It should spit out a radar animation from 8am to 8pm on the 28th. The colors are just the radar echo in decibels. The higher the reflection the more dense the rain.”
Jacqui: “What a terrible hit and the video makes wobbling clear. Makes me think of how fortunate we were that Cat. 5 Dorian did not continue on from the Bahamas to hit us in 2019. What a nightmare.”
Screenshot of slide-bar image: “Then and Now Images and Movies:” “Matlacha After Hurricane Ian,” eyeonlakeo.com, Todd Thurlow.
Having grown up in Florida, my brother Todd and I both developed a reverence for the natural world. Hurricane Ian made landfall in Southwest Florida on September 28, 2022. Today, I share Todd’s latest eyeonlakeo.com creation featuring jaw-dropping “then and now images and movies” of Hurricane Ian’s swollen effects on the Kissimmee, Peace, Lake Harney and St John’s rivers; the Gulf of Mexico; the intense destruction in Charlotte County’s Gulf Cove; Lee County’s once fishing village of Matlacha; and Sanibel Causeway; as well as NOAA NGS emergency response imagery. This is documentation is almost as powerful as the storm itself and the comparison images can be viewed by clicking on the illustration and then using the simple blue dot slide-bar to go back and forth. Respectfully, Todd and I submit this documentation with continued prayers for those whose lives are forever changed.
Today I am trying my hand at posting while mobile. So if the two YouTube videos I share do not come through and eyeonlakeo.com is not linked I apologize.
Many of you who follow my blog know my brother’s “Time Capsule Flights, “and his web site eyeonlake.com. Todd and I have worked together for many years documenting South Florida’s water history-past and present.
For this post, by going back and forth between present and past Google Earth images, Todd gives us a comparative view of what just was and now is. Hard to watch, but important to know. Next time it could be any of us. Our hearts are with Florida’s West Coast in the aftermath of Hurricane Ian.
In spite of Florida’s significant development, the health of estuarine seagrass is something we expect and treasure. Being the home of baby fish and wildlife, estuaries are often called the “cradle of the ocean.”
According the the USDA, “estuaries are among the most productive natural systems on earth.” Their value? Perhaps priceless. And we are losing money fast.
Today I wanted to share information presented at a Rivers Coalition meeting now posted for the St Lucie/Indian River Lagoon estuary; I will touch on four other sister estuaries as well: Caloosahathcee; Lake Worth Lagoon; Biscayne Bay; and Florida Bay. Being familiar with each, can help us advocate for the value of the greater whole.
I. St Lucie/Indian River Lagoon
Last week, my brother Todd Thurlow, shared satellite and GIS images that show a story of seagrass loss in the St Lucie River/Indian River Lagoon estuary in an area known to locals as Sailfish Flats. I have taken screen shot images of Todd’s website below. The first image was taken in 2007 and the second on 2-24-2021. In spite of yearly variations due to season, temperature, and other natural changes, I think it is clear that seagrass has declined. The real killer is that the St Lucie River/Indian River Lagoon had once attained the greatest species diversity of any estuary in North America, (Lodge, The Everglades Handbook, 4th Edition, page 175).
Right now, it appears that seagrasses have disappeared in the Sailfish Flats region. The reason? Certainly there are many including the damaging discharges from Lake Okeechobee, and canals C-44, C-23 and C-24. ~Hurricanes? Climate Change? Sea level rise? Fertilizers from local runoff? Destruction of native trees and vegetation? Earlier dredge and Fill? Septic Tanks? Dredging? Beach Renourishment? But some of these things have gone on for decades, so why now such a difference? Please share your ideas and experiences.
To see all images throughout many years visit Todd’s website eyeonlakeo.
-Seagrass loss a visual survey, Sailfish Flats, SLR/IRL, 2007 compared to 2021
II. Caloosahatchee
I am no expert in the Caloosahatchee, but it is commonly known that if it gets too saline in the upper estuary, the underwater grasses there can die. I am sharing the most recent Sanibel Captive Conservation Foundation “Caloosahatchee Conditions Report” as it shows the organization recommending 2000 cfs from the ACOE (Lake Okeechobee) but will be recommending less or none in the future.
III. Lake Worth Lagoon
Lake Worth Lagoon, once a huge freshwater lake, is now open to the sea. LWL has many issues, but sediment covering seagrasses -especially from the C-51 canal- is a big one. You can learn more at the Palm Beach County’s Environmental Resource Management website.
IV. Biscayne Bay
The South Florida Water Management had an outstanding workshop on Biscayne Bay last December. Seagrass loss was a big topic and they had just had a fish kill. You can learn more here.
V. Florida Bay
Florida Bay has endured significant seagrass loss, especially, most recently in 2015. This year due to 2020 rains, the Bay is having a very good year as recently reported by the SFMWD. (See page 24). Audubon’s Everglades Science Center is a good website to learn about issues of seagrass loss and others facing Florida Bay.
“Seagrasses? What seagrasses?” It must be “Seagrasses! What Seagrasses!”
“Thank you Jacqui! While this is bad for the East Coast, the West Coast has been inundated with nonstop discharges from Lake O. Can your brother update his Caloosahatchee chart to include 2020?” Mike Downing
Thanks to my brother, Todd, for replying to Mike’s question right away. (Chart above)
Mind you, these numbers measured from S-79 (comparable to the St Lucie’s S-80) include basin runoff and Lake Okeechobee discharges. As of 12-1-20, the brown line of 2020 is creeping higher, just under 2018, to 1,409,269 acre feet! That’s one foot of water on 1,409,269 acres of land!
If we want to see a break-out of basin and Lake O discharges to the Caloosahatchee, we can view SFWMD, Division Director of Water Resources, Lawrence Glenn’s draft slide for the upcoming, December 10, South Florida Water Management District Meeting. (See below.)
In a color coordinated way, Lawrence’s chart splits out the basin and Lake Okeechobee discharges over the course of 2020. Look at all the dark blue representing Lake O in late October, November, and December. Also, look at all the basin runoff (green and gray)For Lawrence’s entire presentation -which includes the St Lucie- click here.
As a non scientist, non-technical type, what I notice looking at Todd and Lawrence’s charts is that although there has been notable discharge in 2020, the water was released by the ACOE later in the year. This is significant.
Back to Todd’s chart:
If you want to learn even more, use my brother’s eyeonlakeoacre feet calculator to get a visual for 1,409,269 acre feet of water. 1,409,262 acre feet would put 33.66 inches of water on the land area of Lee County and 48.66 inches of water on land area of Martin County!! Mind boggling! See here or chart below.
What helps keep things in perspective for me is a map created in 2019 by the SFWMD based on the famous historic 1913 Harshberger map that makes very clear -colored in light baby blue- the water that once covered the central and southern portion of Florida. The majority of this water is now sent through the Calooshahatee and St Lucie Estuaries…
A Ten Year View, Discharges to the St Lucie Estuary
Today I share images that help tell the story of the St Lucie Estuary over the past ten years. The first image is from the website eyeonlakeo. My brother, Todd Thurlow, takes data from D-Hydro of the SFWMD and puts it into a format that the average person can understand.
The chart above shows the “S-80 spillway at St Lucie Locks’ cumulative discharges by CALENDAR YEAR, 2011-2020.”
Scientists use Water Years, May 1 of one year, through April 30 of the next year. This splits up the years making it more confusing to remember or understand. We, as people, live our lives in calendar years.
We can see by looking at Todd’s chart that 2016’s calendar year is highest overall discharge year with 842,775 acre feet (one foot of water covering one acre) of water going to the St Lucie from what is called “local runoff” (all canals and surrounding areas) as well as discharges from Lake Okeechobee.
How large is 842,775 acres? Comparatively, Martin County is 347, 520 acres. 2020 is 188,723 acre feet and climbing. We are talking tremendous amounts of water!
In descending order, we see 2016; 2013; 2017; 2018; 2015; 2020; 2012; 2014; 2019; and 2011. The brown of line of 2020 crests 2015 as when the year is completed, 2020 will more than likely be higher than 2015.
“Could you please get me a chart or graph showing discharges to the St Lucie River for 2012-2020 by month. Please present this information from January through December of each calendar year and break it out from S-80 and S-308 and also give a total combined number. Please also note for each of those calendar years, the highest level Lake Okeechobee got that year.”
To view this information, click on Charts in red below for visuals, and data in red below for numerical charts. As mentioned this information below is from the SFWMD. This compiled information provides great perspective.
I, as many, participated in yesterday’s Army Corp of Engineers‘ Periodic Scientist Call. During the course of the call, it was alluded that the ACOE may be letting up or halting Lake Okeechobee discharges to the St Lucie Estuary soon. As soon as they do, we will begin to chart calendar year 2021. All things considered, everything in me believes it will be better than 2020!
Today is October 26, these photos/videos were taken over the weekend on October 24, 2020. The first is the St Lucie River looking off the Evan’s Crary Bridge at Sewall’s Point; the second is a video of the St Lucie River taken between Rio and Stuart; and the third is a video of a brown ocean at Peck’s Lake. The St Lucie River/Indian River Lagoon and much of the east coast of South Florida have endured tremendous, repetitive downpours in 2020, causing massive “local basin runoff.” The St Lucie has been stressed for months, and since October 14, there are also discharges from Lake Okeechobee. Prior to that, there had been no Lake O discharges since March of 2019. This post is written to document this discharge era for today and for later reference.
1-Video visual water quality from boat, wide St Lucie River near Rio 10-24-20
2-Video visual water coloring, Atlantic Ocean at Peck’s Lake, south of St Lucie Inlet 10-24-20
DOCUMENTING THE DISCHARGES 2020
Map SFWMD showing canals and basins. C-44 is designed to discharge both basin and Lake O water, depending. When flowing, C-23 and C-24 are constant polluted discharges. More often than not, the St Lucie receives more polluted fresh water discharges from these canals than the river can handle.
Covid-19, an active hurricane season, and the 2020 presidential election have captured our attention, but most of know, as this Tyler Treadway Stuart News article reports, much to our dismay, due to a high rate of Lake Okeechobee rise, and after weeks of media briefings, and warnings, a reluctant ACOE started discharging to the St Lucie River on October 14th. Thankfully, for much of the time, it has been difficult due King Tides. The discharges are expected at least another week longer if not a month depending weather and rainfall from Tropical Storm Zeta. See link below from the ACOE’s most recent, 10-20-20, Periodic Scientist Call for more info.
The most comprehensive place to keep track of all this is Todd Thurlow’s website (http://eyeonlakeo.com) that provides a multitude of easily interpreted information. Check it every day, especially LIVE DATA and Satelitte NCCOS HAB images of Lake Okeechobee.
FACEBOOK UPDATES
Michael Conner, THE INDIAN RIVERKEEPER keeps an active Facebook page on Lake O discharge and other local issues and is often on the ground reporting.
I am not happy about the discharges, however, I am pleased to report that the SFWMD has created a transparent website page where one can learn all that is being doing to try to curb the harmful discharges to the estuaries. The SFWMD is working hard to send water south even during this very rainy hurricane season. And each year we must figure out how send even more water south. https://www.sfwmd.gov/content/district-actions-reduce-harmful-discharges-northern-estuaries
Also on 10-14-20 The Florida Department of Environmental Protection put out a press release: “Governor Ron DeSantis Announces Preparation for Algae Bloom Mitigation Following Announcement by Corps of Releases From Lake O.” This technology has not been needed thus far.
I can’t forget to include that October 11, 2020, right before the discharges began, Ed and I took this video documenting a significant algae bloom in the middle of Lake Okeechobee. Since that time it has been too stormy, or cloudy to go up. Usually, rain and lack of sunshine minimize visual blue-green algae blooms as can be seen on Todd’s website. The algae does remain in the water column. This image/video was shared by many news stations and posted on Facebook.
3-Large algae bloom in middle of Lake Okeechobee, 10-11-20.
Next , I would like to document Florida Oceanographic CEO, Mark Perry’s recent op-ed as it gives us pause. “Why can’t, why aren’t we able to send more water south?” We know a lot has been done, and we are grateful, however, 2020 is not 1948, we must continue to advocate for a better water future…
OP-ED MARK PERRY, PUBLISHED IN STUART NEWS, October 15, 2020
Lake Okeechobee discharges can go south now.
As the water level rises in Lake Okeechobee, the U.S. Army Corps of Engineers is considering discharges to the coastal estuaries, the St. Lucie to the east and Caloosahatchee to the west.
According to the Lake Okeechobee Regulation Schedule, the Corps considers where the lake level is at this time of year within the “operational band,” which ranges from 10.50 to 17.25 feet of elevation. Then, based on the rainfall outlook and tributary conditions, they determine “allowable Lake Okeechobee releases” to the water conservation areas and to the estuaries.
The water conservation areas (900,000 acres) are the remnant Everglades, south of the Everglades Agricultural Area (EAA) which is the 700,000 acres immediately south of the lake used primarily for growing sugarcane.
For “allowable Lake Okeechobee releases” to the estuaries, the Corps has specify flow amounts going to each estuary, which can be “up to 4,000 cubic feet per second (cfs) to the Caloosahatchee and 1,800 cfs to the St. Lucie.”
That is where they are right now with the lake at 16.02 feet elevation.
But the “allowable” releases to the water conservation areas are always “up to maximum practicable.” What does that mean? Well, they rarely talk about how much they can release to the water conservation areas, and never tell us how much should be considered to go south.
In fact, water has been flowing south into the water conservation areas all throughout this wet season, May through October.
But it is not coming from the lake.
About 955,000 acre feet (311 billion gallons) has been going into the water conservation areas from the EAA basin runoff. This means that they are keeping the EAA water table down to 10.5 feet — ideal for crops — by draining all this water through our 57,000 acres of stormwater treatment areas and into the water conservation areas — the Everglades.
Meanwhile, the Corps says they must discharge Lake Okeechobee to the estuaries because they can’t release it to the south. Well, they can — they have been doing it for months and they still are today, but it is all coming from the EAA basin runoff!
All this time, we could have been releasing lake water to the water conservation areas, and we could do the same right now instead of killing the estuaries with releases and wasting this water to tide.
But for that to happen, we need to tell the EAA to store and treat runoff on their own land so the stormwater treatment areas can be used for water flowing south from Lake Okeechobee.
The Corps and South Florida Water Management District are jointly responsible for managing water in south Florida. We need to have them focus on restoring more natural water storage and treatment north of the lake, in the 2.5 million acre watershed, so the lake doesn’t fill up so fast.
But we must also get them to flow south from the lake to the Everglades during the wet and dry seasons. We don’t have to wait for huge regional projects to be authorized and completed, we can do this now.
The lake is rising quickly because the EAA is using the capacity to send water south. Agricultural interests would like it to stay high because during the dry season, November thru April, the EAA will demand water from the Lake, about 350,000 acre feet, as water supply for their crops.
These are ideal conditions for the EAA, but not so good for the lake, the greater Everglades ecosystem and the coastal estuaries.
Mark Perry is executive director of the Florida Oceanographic Society in Stuart.
Below are Florida Oceanographic’s most recent St Lucie River/Indian River Lagoon water quality reports
Finally: During Rivers Coalition meeting 10-22-20 more expansive documentation/reporting of on-going seagrass loss/slow recovery in the St Lucie River/Indian River Lagoon was requested. It was noted that SFWMD “Ecological Reports” cover only two historical seagrass areas of the once lush and healthy Sailfish Flats.
Before Hurricane Dorian came this way, my brother, Todd, was helping me answer a question. ~One I think will be interesting to you as well…
“Where were the rapids of Lake Worth Creek?” Yes, rapids!
T41S R43E, Survey 1855 John Westcott, Surveyor General.
To answer the question, we must first recognize that Lake Worth Creek has been altered as we can see comparing the images above and below.
This change happened slowly over time, but most notably in 1894 with the completion of the Intracoastal Waterway from Jacksonville to Maimi. The Google Map below shows the Intracoastal today. The 1855 survey above shows Lake Worth Creek pre-development. In both images, it’s the area between Jupiter Inlet and Lake Worth- the historic area of Lake Worth Creek.
To learn where these rapids were located let’s read an excerpt from Palm Beach County’s MANAGEMENT PLAN FOR FRENCHMAN’S FOREST NATURAL AREA, FCT PROJECT # 96-011-P7A, June 1998.
The Frenchman’s Forest Natural Area (located right under Frechman’s Passage, JTL) is part of a broad coastal swale that was separated from the Atlantic Ocean by coastal sand ridges and from the Loxahatchee Slough by a broad pine flatwood ridge. It was part of the headwaters of the former Lake Worth Creek, a meandering blackwater creek that flowed northward to join the Loxahatchee River near its mouth at the Jupiter Inlet. The earliest accounts of the site date from the 1840s, and were from U.S. Army Topological Engineer reports made during the Second Seminole Indian War (Corbett 1993). Eighty men from Fort Jupiter moved up Lake Worth Creek in seventeen canoes. Approximately two miles north of the natural area, they reached the “rapids”, a series of muck terraces that disappeared during periods of high water, but helped hold water at a higher level in the upstream sawgrass marshes. Another series of muck terraces may have been present 0.25 miles north of the natural area. After getting past these barriers, the troops entered a large sawgrass marsh, where they pulled the canoes for a mile to a haulover path over the sand ridge separating the marsh from Lake Worth. The southeastern portion of the natural area was part of the sawgrass marsh, and the soldiers may have crossed through the site. Once they reached Lake Worth, the soldiers raided Seminole Indian villages along its shores, capturing guns and canoes. The soldiers had followed an old Indian route for traveling between Jupiter Inlet and Lake Worth. When the last Seminole Indian war ended in 1859, pioneers began to use this route for coastal travel. Charles Pierce (1970) described his family’s travel to Lake Worth by small boat via this route in 1873. He noted his father’s difficulty in finding the right channel through the sawgrass to the haulover. Pierce and his family were among the earliest permanent settlers on the shores of Lake Worth. Pierce also provided the first direct reference to the natural area, noting that the bird rookery on Pelican Island (present-day Munyon)…
Another source we can use comes from the Atlantic and Gulf Coast Canal and Okeechobee Land Company 1881 Prospectus where it documents the advantage of making the cut through Lake Worth Creek. Nine lines from the bottom it mentions the rapids: “There is a depth of five feet of water in the channel from its mouth to the rapids…”
And the last shared source is from an 1884 USGS Survey Report noting the difficulty of working through the sawgrass route from Haulover Head on Lake Worth to the Rapids of Lake Worth Creek.
Fascinating and historic information, but what about X marks the spot? Where were those rapids?
Using the above information, below (look for yellow arrow) Todd shows more specifically on a topo map from his video “Lake Worth through the Haulover and Sawgrass Route to Jupiter Inlet – 1883” showing where Lake Worth Creek’s rapids may have been located. On today’s map that is very close to Frenchman’s Passage/Frenchman’s Creek.
Next time you’re in the area give a shout out to the once rapids of the former Lake Worth Creek, a wonder of old Florida that we shouldn’t forget!
9:16am 9-16-19: I was close! My brother just texted me this: Hey Jacqui. Sorry Dorian interrupted our discussion of the Falls. It was actually near the creek called Frenchman’s Creek on the old topos not Frenchman’s Passage which is a neighborhood today about a mile and a half south and inland from the old creek/rapids. 😬
Frenchmans Creek still appears on Google maps. It is where Cypress Island Marina is today off of Palmwood Road.
My recent post about “Holding Lake Okeechobee’s Algae at Bay” got a lot of responses with a few questioning whether the algae bloom in Lake O off Port Mayaca was caused by the waters of C-44 flowing back into the lake.
I do not know the answer to this question, but I do know flights over the C-44 canal in 2019 have shown no visible algae blooms, but many in the lake with some right off Port Mayaca. Nonetheless, we know the C-44 is full of nutrient pollution.
Today I want to share a chart from my brother Todd Thurlow’s website http://eyeonlakeo.com/ as well as our back and forth on the issue of how much water has been put into Lake Okeechobee from C-44 so far this year rather than going into the St Lucie River. The ACOE can flow C-44 flow both ways…
Be sure to read “Summary of Query Results” below for the answer.
Todd: Jacqui, I changed my DBKey on my daily spreadsheet to S-308 just to see what it would spit out. See below. It looks like S-308 has sent a net 17billion gallons of C-44 basin water (over 54,000 AF) into Lake O this year. I am pretty sure that means we get a “free” 17billion gallons in our direction before it is considered “Lake Water”.
Jacqui: Todd did the ACOE start sending the C-44 canal water back to Lake O May 29th? Looking at the chart this is what I see.
Todd: There has been little flows all year as can be seen on the chart too but the big flows started on May 13 at -2042cfs. There was a pause between June 4 and July 30. Then is started again with a few days off here and there. Here is the data that is summarized in that chart.
The May 29 date that you might see (its actually May 20) is where the “Cumulative Total Discharge” graph crosses the zero axis? That is where the net flows for the year were back to zero. In other words, it took from May 13 to May 20, 8 days of westward flow, to cancel out all of the net eastward flow for the year.
SFWMD canal and basin map. C-44 can run east to the St. Lucie or west to Lake Okeechobee.
These DEP canal summaries are no longer available on-line but remain good references even though written in 2001.
Todd Thurlow gave a great presentation last evening about his website “EyeOnLakeO,” http://eyeonlakeo.com. The site is a cache of images, charts, data, videos, graphs, and mathematical conversion calculators. This information is all public, but hard to find because it is buried under layers and layers of government-agency material. Thanks to Todd, now much of this is in one place, and only a click away!
Last’s night’s presentation reviewed everything on the site, but focused mostly on “Descriptions of Satelite Imagery and Sources.” This you may have seen me post on Facebook where Todd juxtaposes the Lake Okeechobee NOAA Harmful Algae Bloom Images to Real Color Images.
You can see other subject boxes include: Florida Chlorophyll; Martin County Chlorophyll; Live Discharge Data; Historical Discharge Graphs (my favorite); Calculators and Tools (super helpful!); Satellites- Landsat 7 & 8; Terra, Aqua, Suomi Last 7 Days; Measurements (of algae blooms in Lake O); Landsat 1-4 Movies 1972-2013; Landsat 4-8 Movies 1982-2018 (compilations of satellite images over time); Lake O Surface Winds “Windy” (to see where the algae will be pushed and gather); Hurricane Matthew Video info (was 20 miles off Stuart/Cat. 4/2016); Terra/Aqua/Suomi Archives; and a movie of the Lake O Algae Bloom 2016 that Todd measured at 253 square miles being dumped into the St Lucie River at S-308…not a good year!
Todd noted all this got started with Mark Perry, CEO of Florida Oceanographic, asking Todd if he could measure the 2016 bloom. I’m so glad Mark asked!
The presentation was well received and left our heads spinning!
Todd noted during his introduction that he is not a scientist, but a lawyer and an interested citizen like the rest of us. He shared that there is a ton of information out there and that it is not the responsibility of the government to give us the information. It is our responsibility to get it ourselves. Thank God I have Todd as a brother because I don’t have the ability or the desire to mine all of this information. But he does, and we can all use it and all share it and hold our state accountable using it.
What a wonderful thing!
Please go to Todd’s website and explore, bookmark as a reference especially with summer coming: http://eyeonlakeo.com
In closing, I’d like to use this opportunity to compare the 5-18-19 NOAA image on Todd’s site with photographs of algae bloom in Lake Okeechobee taken by my husband, Ed Lippisch, just yesterday. Ed described this bloom as five miles long and a few miles wide. As with many other years, the cyanobacteria is back in the lake. But now we can watch it, and fight that it is not discharged into our river.
~Yes, it is from the air, and from outer-space, that we really can force the conversation for a better water future!
This blog post is a follow-up to my previous post: https://wp.me/p3UayJ-9Vm, entitled “Top 25 Discharge Years” to the St Lucie and Caloosahatchee . Here I wrote that the SFWMD’s DBHydro systems’ discharge dates were not the same for the St Lucie and Caloosahatchee estuaries and speculated on why. To review, the St Lucie’s dates available on DBHydro are 1953-2019, whereas the Caloosahatchee’s is 1967-2019. Thirteen years are “missing.”
Of course my brother Todd, was able to locate and give insight into those missing numbers explaining that comparisons could be found in another system, the USGS system, that actually shares information about the entire planet.
Todd has created the above charts using the USGS data for the Caloosahatchee and the DBHydro data for the St Lucie, and we can now see the 1959/1960 discharge comparison of the St Lucie and Caloosahatchee for 1959 and 1960 in the above charts and excerpts below. Cool!
St Lucie
Caloosahatchee
Delving into all this is a lot of work, and sometimes imperfect, but isn’t it great that the internet allows both the state and federal government to put all this raw data out there for anyone to analyze? Although it takes time and expertise, at the local level it is really our responsibility to individually, through non-profits, and as local governments, tap into this available data and present it in a fashion that everyone can understand, and perhaps inspire!
So now, the lost numbers of the Caloosahatchee are found revealing that the St Lucie River has the highest discharge number on record – 1960- at 3,093,488 acre feet!
Shockingly, the worst year, 1960, displays 3,093,488 acre feet of water coming through S-80 into the St Lucie River/Indian River Lagoon. For comparison, the highest year in the past decade was 2016 at 857,529 acre feet. ~A difference of 2, 235,959 acre feet.
We know now that an “acre foot” is an easy calculation, “one foot of water covering one acre of land.” 3,093,488 acre feet of water would have just about covered St Lucie, Martin, Palm Beach, and Broward counties as the acreage of these counties combined adds up to 3,293,440 acres. Hard to believe!
TT3
Even though in 1960, the lake was not yet prone to massive cyanobacteria blooms, fresh water itself is destructive to a brackish estuary, and over three million acre feet discharged into the river by, what would have been at that time, the Central and South Florida Flood Control District, (the predecessor to the South Florida Water Management District), must have wiped out just about everything.
Of course the question is: “Why such high a high number in 1960?” One would deduce, that the primary reason would be because there were three tropical storms and one hurricane that crossed over Florida during this era. According to NOAA’s Tropical Cyclone Rainfall in Florida chart: Judith, October 1959, 7.90 inches; Donna, September 1960 13.24 inches; Florence, September 1960 15.79 inches, and we do not know for the Unnamed 1959 storm.(https://www.wpc.ncep.noaa.gov/tropical/rain/tcflorida.html)
But this is conjecture…
Going back to Todd’s graph, you’ll notice that thirteen out of the twenty-five years listed had higher discharge number than 2016. Sobering, isn’t it? Staggering numbers, for a river that by Nature was never connected to Lake Okeechobee, and only a portion of the so-called C-44 Basin. We have drowned her, indeed…
Hurricanes 1959, 1960 NOAA, courtesy of Todd Thurlow.
Now for one final question.
The Caloosahatchee has data too, but only for years 1967-2019. Thus the Caloosahatchee’s highest year for discharge of its top 25 years is 2005, at 3,731,056 acre feet; followed by 2016, at 2, 950,926 acre feet and so on. Please click on the graph.
So what about the missing thirteen years of 1953-1968? Where did this water go? Did it go to the St Lucie? Was the Caloosahtchee off-line? Did it go through the Calooshahatchee but was not recorded? These are questions I cannot answer. But in any case, both rivers need a break, or they shall break themselves. History allows us to see the long-standing destruction and ecological disregard for our treasured Northern Estuaries.
S-79 Spillway on Caloosahatchee at Franklin Lock and Dam, Top 25 Discharge Calendar Years, 1967-2019, courtesy Todd Thurlow.
Basin map SFWMD. Before it was connected by canals, the St Lucie River was a large fresh water “stream” that ran into the Indian River Lagoon.
Structures along the Caloosahatchee, courtesy Melody Hunt, Research Gate. The Caloosahtchee was connected to Lake O in the late 1880s by Hamilton Disston after he blew up the waterfall rapids at Lake Hipochee and dredged on to the Lake.
S-79 Spillway Caloosahatchee at Franklin Lock and Dam, Calendar Year 2010-2019, courtesy http://eyeonlakeo.com, Todd Thurlow.
Structures along the Caloosahatchee River, courtesy Melody Hunt, Research Gate. S-79 is the gate used for purposes of this post. S-79 is comparable to the St Lucie’s S-80 at St Lucie Locks and Dam, in that it is the final structure along a channelized river thus allowing both runoff from the surrounding “basin” and water discharged from Lake Okeechobee.
Last week, I presented a blog on discharges, 2010-2019, to the St Lucie River from both the surrounding basin, and Lake Okeechobee. Although we can separate Lake O’s numbers, it is important to know just how much water, thus sediment, nitrogen and phosphorus, the estuaries are taking “at once.” I have often said the worst thing about discharges from Lake Okeechobee is that the river is already on life support -from being drowned out by basin runoff- when Lake Okeechobee is leashed open.
So called “basins” around our rivers, like everything else in South Florida, have been altered to drain more efficiently than Nature intended. Thus with “basin discharges” these rivers (St Lucie and Caloosahatchee) are already being drowned out during high rain events, and thus when Lake O’s water comes on top, well, it is the “nail in the coffin” so to speak.
I just needed to explain that before we begin….
~ So today, as in the previous post, I will be speaking about both basin and Lake O water.
Referring to my brother, Todd’s, graph at the top of the page, you’ll notice right away the destructive-discharge numbers are much larger for the Caloosahatchee, than the St Lucie, as it is much larger estuarine system.
As we can see comparing the two charts labeled “Cumulative Discharges 2010-2019” below, both the St Lucie and the Caloosahatchee’s highest year for discharges, by far, was 2016. But whereas the St Lucie received 842,000 acre feet of water, the Caloosahatchee’s water number is a whopping 2,950,926 acre feet! That would mean one foot of water on 2,950,926 acres of land.
You’ll remember from last time that “acre feet” is a very easy way to calculate. “Acre feet” means one foot of water on top of one acre of land. This 2016 Caloosahatchee 2,950,926 acre feet of water would just about cover, by one foot, Lee County, Collier County, and Hendry County – counting land and water within boundaries – as the acreage of these three counties adds up to 3, 012,450 acres.
Lee, orange; Collier, blue; and Hendry, green equals 3,012,450 acres of land so 2,950,926 acre feet of water would just about cover this area.
TT3
Again, this visual is meant to give perspective on the tremendous amount of land this amount of water would cover. Often when we hear “acre feet” we don’t put “two and two” together. Once one realizes the number of acres of land that would be covered, it is astounding!
~But then, of course! These waters used to flow naturally as sheet-flow from the Shingle Creek area up in Orange County all the way south to Florida Bay.
Continuing on, we see that in second place, although the St Lucie’s second worst year was 2013, for the Caloosahathcee it was 2017, and then 2013. The fourth worst, for both estuaries was 2018.
Please compare the charts below of both rivers to see other differences from 2010-2019. Interesting… In the future, perhaps we can ask why 2018, in fourth place, was by far the most horrific year for the Caloosahtchee. Certainly it has to do with that sediment, nitrogen and phosphorus feeding cyanobacteria. As we know, in 2018, Lake Okeechobee was 90% covered in a cyanobacteria (blue-green algae) bloom…
*Please note that the charts look similar below; look closely to see that the first is for the CALOOSAHACHEE and the second is for the ST LUCIE. Thank you Todd for these awesome visuals!
CALOOSAHATCHEE 2010-2019 basin and Lake O
ST LUCIE 2010-2019 basin and Lake O
Go to http://eyeonlakeo.com, Todd’s website for more ways to easily access and compare Calooshatchee, St Lucie and other information.
Today, I begin a series of blog posts under the title: “Destruction by the Numbers,” based on new information my brother Todd has added to his website: http://eyeonlakeo.com.
The first slide we will study is calculated under Historical Discharge Graphs for “S-80, Calendar Year 2010 to 2019.” S-80 is the Army Corp of Engineers’ structure located at the C-44 Canal that discharges water to the St Lucie River/Indian River Lagoon from two sources. First, from the basin surrounding the C-44 Canal; and second, through S-308 at Lake Okeechobee.
Todd’s chart allows us to isolate the most recent decade, 2010-2019, and see that the highest discharging year during this time was 2016 at 847,773 acre feet. 2016 was by far the worst year in recorded history for cyanobacteria blooms being discharged from Lake Okeechobee and spreading throughout the river system. There was such massive blue-green algae build-up at Bathtub Beach that the waves and shoreline were completely green.
Don’t be intimidated by the left axis’ measurement of acre feet. Acre Feet is easy to calculate as it means exactly what it says. The acreage noted, in this instance, 847,773 acres, would be covered by one foot of water.
For reference, I will use the Everglades Agricultural Area, (EAA), located underneath Lake Okeechobee that we talk about all the time. This farmed area, mostly sugarcane, is 700,000 acres. So 847,773 acre feet of water —dumped into the St Lucie River from S-80, in 2016 –would cover the entire EAA, and more, by one foot of water!
~The map below shows the EAA in a salmon color.
Back to the chart. The next worst year, following 2016, was infamous 2013, the year that became known as the “Lost Summer,” and really started the river’s revolution at 671,067 acre feet. At one foot deep, the amount of water discharged would just fit inside the boundaries of the 7000,000 acres of the Everglades Agricultural Area. It is interesting to note that 2017, a year not often mentioned, closely followed with 661,000 acre feet.
2018, a horrible water year, fresh in our memories, actually came in fourth at 402,116 acre feet! Obviously timing and temperature are factors too.
~2010, 2015, 2012, 2014, 2019, and 2011 follow. Of course 2019 is not even finished. It will be interesting to see where it ends up.
As we would have guessed, 2016’s toxic algae health hazard was the highest destruction by the numbers year in the past decade. But what we would never have estimated is how much water was discharged to the St Lucie River/Indian River Lagoon through S-80 in the 1950s and 60s. This number will truly blow your mind. But we’ll save that for the next “Destruction by the Numbers.”
The EAA is labeled and shown in a salmon color. It is approximately 700,000 acres.
S-80 is located along the C-44 Canal that connects Lake Okeechobee to the South Fork of the St Lucie River. Maps courtesy of the SFWMD.
The red line shows the historic flow (in both directions depending on water levels) of the Loxahatchee Slough. Courtesy of Todd Thurlow, “Time Capsule Flights.”
Today we continue our journey of the Loxahatchee Slough, once part of southwest headwaters of today’s “Wild and Scenic,” but also water-anemic, You will see that the Loxahatchee River is located in both Martin and Palm Beach counties. My brother, Todd Thurlow’s “Time Capsule Flight” guide-posts are below to give reference during your awesome flight of this area.
Again, as in some of Todd’s other videos, you will see that humankind has developed lands “right in the middle of a river.” Certainly we would have done things differently today!
For instance, the red line in the video and photo above shows the “Southern Path From the Everglades to the Loxahatchee Slough” using 1949-1950 USGS Topo maps. Today, this once “water wonderland” is completely developed, and channelized, shutting off the once intermittent, bi-directional flow, depending on rain levels and locations… to the Loxahatchee River.
It is kind of sad that most of us are completely unaware that this giant slough was once a flourishing “fork” of the Loxahatchee River. It took me awhile to figure it out. They should teach this stuff in school. Please watch Todd’s video below. You will be in awe!
In this video you will see:
0:00 1958 USGS 1:250K Topo Quad of Palm Beach and neighboring counties
0:05 I added the red line to the map showing the path of low lands between Loxahatchee Slough and the Everglades
0:08 Eight 1949 and 1950 1:24K USGS Topo maps
0:25 Fade away to a current aerial showing the red line and flying…
— north, from the intersection of State Road 7 (US441) and Old Hammock Way (just north of The Mall at Wellington Green)
— 0:30 across the West Palm Beach Canal
— 0:33 to the south end of Loxahatchee Slough (Behind Renaissance Charter School / Okeechobee Rd & Benoist Farms Rd)
0:46 Fly up the C-18 Canal, which now splits and drains to Loxahatchee Slough (C-18/Corbett Basin)
0:59 Turnpike and I-95 interchanges at Indiantown Rd. (SR706)
If one looks up the Loxahatchee River today there is hardly a mention of the once great southwest arm of the river, it is just a long skinny canal, ~the photo not even showing the large partially remaining Loxahatchee Slough now amputated from the river by development. https://loxahatcheeriver.org/river/about-river/
Water Catchment Area is how the Loxahatchee Slough show up on maps today. JTL
West Palm Beach Canal 1940 Aerials and 1958 Topo, Todd Thurlow
You will see:
0:06 1940 USDA Aerial Index of Palm Beach County
0:20 Eight 1949 and 1950 1:24K USGS Topo maps
0:45 Pinner Island (now known as Ibis Isle)
1:01 1940 USDA Aerial – West Palm Beach Canal outlet to Lake Worth
1:40 Lake Clarke area where the Palm Beach Canal now crosses under I-95
– The road “s” turning over the canal is actually the Seaboard Air Line Railroad (now CSX)
– The Florida East Coast Railway is 0.6 miles to the east (the next canal crossing downstream)
1:54 Lake Clarke – on the 1950 Palm Beach USDA Topo
2:54 Morrison Field Airbase (later renamed Palm Beach International Airport).
See: http://www.pbchistoryonline.org/page/…
3:37 SFWMD Offices south (left) of the canal across from the airport
4:11 Wide fade-in of 1940 USDA Aerial Index – ponds and bogs of western Palm Beach County
4:21 The northern end of what is now the Loxahatchee National Wildlife Refuge
(aka WCA1 – Water Conservation Area 1)
4:41 1958 USGS 1:250K Topo Quad showing western Palm Beach County
4:49 Twenty Mile Bend
5:05 Eastern portions of the Everglades Agricultural Area (EAA)
5:46 Canal Point at the western end of the Palm Beach Canal
____________________________________
Palm Beach County is a fascinating place, especially, as in 1925, Martin County was born of it. We are connected, as is everything in this water-world of South Florida.
Today, I feature another incredible “Time Capsule Flight” by my brother, Todd Thurlow. I have recently been studying Palm Beach County and Todd’s flights help me understand what was, what is, and would can be. Palm Beach County is interesting as unlike Martin County, it has been developed very far west into the historic Everglades.
When I made a big deal out of this, my mother gave me a book published in 2000 entitled OUR CENTURY, a conglomeration of articles by the Palm Beach Post. A historian, my mother smiled saying, “Jacqui, Palm Beach County always planned on going west…”
The first article I came upon was about Louis Perini, the father of “Westward Expansion.” Eliot Kleinberg writes: “In the mid 1950s West Palm Beach was only a mile wide. But a single land deal set off a westward land rush now limited only by the Everglades…”
And to the Everglades it certainly went!
To learn some canals while were at it, you’ll see that Lake Okeechobee is connected to the historic West Palm Beach Canal, which is connected to the C-51 Canal, which in turn drains the C-51 Basins to the Lake Worth through Structure-155. Like the C-44 Canal, both lake water and basin water can be transported through the C-51 canal damaging the water quality in Lake Worth ~Sound familiar? Very similar to the plight of the St Lucie/Indian River Lagoon. Tremendous amounts of precious fresh water wasted to tide, destroying ecological habitat and property values along the way. We must do better!
In any case, it is an amazing thing to really see that we are living in what once was indeed a beautiful marshy swamp.
Enjoy Todd’s flight “West Palm Beach 1940 Aerials and 1958 Topo;” it’s time-travel into Florida’s past and into her future. Again here is the video.
Lake Worth, fading 1958 topo map to 1940 US Ag Dept. aerials ~outlet of C-51 to Lake Worth. Looking west to 20 Mile Bend going north then west again as West Palm Beach Canal leading to Lake Okeechobee. Todd Thurlow
USGS 1958 Quad Western Martin and St.Lucie, slide Todd Thurlow, Time -Capsule Flights
Today, I present, yet another incredible Time-Capsule Flight by my brother Todd Thurlow. (https://jacquithurlowlippisch.com/todd-thurlows-time-capsule-flights/). This flight takes us on a tour over the Everglades, the Everglades Agricultural Area, Loxahatchee Slough, Allapattah Flats, Ten Mile Creek, and the St Johns River Marsh, fading in and out, so one can see what the landscape/waterscape looked like in 1958 using USGA topographical maps compared to today’s Google Earth maps.
What is most striking for me, is how undeveloped, how undrained, much of the land was in 1958, not really that long ago… 61 years ago. For reference, my husband, Ed, is 62 years young!
More than we can image has happened to South Florida since 1958…
For instance, when Todd flies by notice how little sugarcane and other crop production was taking place in the Everglades Agricultural Area just south of Lake Okeechobee compared to today. Now there are about 525,000 acres of sugarcane, back then, there appears to have been fewer than 50,000 acres of sugarcane in acreage.
Everglades National Park had been in place since 1947, but look at the difference in Whitewater Bay, as well as Taylor and Shark River Slough; and what about Florida Bay?
The Loxahatchee Slough region, near Jupiter, in Palm Beach County? Holy moley, notice how the once magnificent slough was made smaller by development encroaching from every direction, eventually leaving “Grassy Waters” at the southern end – as the sole water supply, via rainfall for all of West Palm Beach…
When Todd travels north over Marin, St Lucie, and the southern edge of Indian River County, perhaps the biggest shock for me endures, as I grew up in this area ~(For reference, I’m 55 years old 🙂
You’ll see that on the USGA map, southern Indian River, St Lucie, and Martin counties are shown in wavy blue as a gigantic marsh, at certain times of year, FULL of clean water!!!! Crazy! Since 1958 these lands have been drained (Ten Mile Creek) that was hydrologically connected to the marsh, through canals C-23, C-24 and C-25; and the waters of the St Johns “Stick Marsh,”( the headwaters of the St Johns River), a north flowing river, are now also drained south into the St Lucie River. Agriculture fields and nearby highways cover those most of those stick marsh lands today.
And the central larger marsh? “Allattah Flats,” also known as “Allpattah Marsh,” or in old military Indian war maps, “Alpatiokee Swamp? Well, the City of Port St Lucie, with over 250,000 residents, and acres of ailing greening orange groves, and more agricultural fields fill these areas today.
Just unbelievable, isn’t it?
Talk about “taking control of one’s environment. “Kind of cool, but I’d say we have really over done it, considering that now our waters, critical for life itself, are almost entirely impaired.
It is my wish that as the residents of Florida push their governments to work for cleaner water, and restore some of these lands, that we all keep in mind the history ofwhat the lands were, working with Mother Nature, not against her.
Todd’s Time Capsule Flights are an invaluable tool in recognizing how much human determination has changed these lands, and how a modern-day determination can restore them. Please click on below and enjoy! Thank you Todd!
An Incredible Flight! 1958 USGS Quads, the Everglades, Loxahatchee Slough, Allapattah Flats, and St. Johns River Marsh, by Todd Thurlow
1958 USGS Quads of the Everglades, Loxahatchee Slough, Allapattah Flats, and St. Johns River Marsh
This time capsule flight overlays three 1958 USGS Quadrangle Maps of southeast Florida from Florida Bay to the St. Johns River Marsh in Indian River County. You will see the following places: 0:30 Whitewater Bay 0:39 Shark River 1:44 The Everglades Agricultural Area (EAA) 2:20 Loxahatchee Slough 3:15 Allapattah Flats 3:35 Tenmile Creek 4:03 St. Johns River Marsh
Overlay of 1883 USCGS Map over Google Earth, Todd Thurlow.
Today’s post is super cool. My brother, Todd Thurlow, Time Capsule Flights, made a fly over of Lake Worth over the Haulover and Sawgrass Route to Jupiter Inlet using 1883 USCGS maps. His inspiration? Marty Baum’s recent comment on “The Gale of 1878, Ten Mile Creek.”
An excerpt from Marty’s retelling of his great-great grandfather, Hannibal D. Pierce, referred to as “Father” below, reads:
“…A few days after the storm Father reached home in a skiff borrowed from Mr. Rogers, the lone settler at the haulover. The last hurricane having raised the water in the sawgrass to an extreme height and good northeast wind blowing, Father decided to try the sawgrass route from Jupiter to the lake. He found the swamp like a great open lake, and had no difficulty in its navigation in the Creole; he landed at the haulover only a few hours after leaving Jupiter. Here he had to leave the Creole until help could be found to haul her over the three hundred yards of hill and dale to the lake. Borrowing the skiff of Mr. Rogers, he rowed it to his home a distance of twenty miles…”
What Todd’s video allows us to see is that, indeed, in the old days, after a gale, one could sail from Jupiter to Lake Worth, east and west of today’s U.S. 1, south through a sawgrass river! The sawgrass river today? High rise building, shopping malls, and gated communities….
I find this absolutely amazing, and a bit strange. 🙂
Please enjoy the video below!
Marty’s comment and the post the “Gale of 1878, Ten Mile Creek” is reposted for reference.
This time capsule flight shows the 1883 USCGS Maps from the south end of Lake Worth over the following areas:
0:44 The homestead of Hannibal Dillingham Pierce (father of barefoot mailman Charlie Pierce)
0:46 Hypoluxo Island
2:07 The old Lake Worth Inlet (note the 3D image of the Palm Beach Marriott Singer Island Beach Resort on that spot!)
3:08 The Haulover between the north end of Lake Worth and the Sawgrass Route
4:55 Jupiter Lighthouse
5:18 The old Jupiter Inlet (about 1/3 mile or 630 yards south of the current inlet)
I am a serious student of this, and the next storm that year. Hannibal D. Pierce, my GG Grandfather back at the homestead on Hypoluxo Island having served a couple years as Keeper at Orange Grove HOR. had recovered a longboat from the Providentia wreck Feb 1878. He sloop rigged it and took it on its maiden voyage to Titusville. Charles W. Pierce; On Wings of the Wind, unpublished manuscript.
Cheap enough some would say, but there were some settlers who could not afford to spend any money buying nuts to plant; they needed what money they had to buy food and clothes. These people did not plant any coconuts from the wreck of the Providencia. But Hammon and Lainheart opened their hearts to Father after he bought 200 nuts for himself, 200 for Cecil Upton, and seven hundred for Captain Armour; they gave him the Providencia’s longboat. This boat was a heavy built round bottom boat, twenty feet long and six wide. …
When Father got the Providencia’s longboat home, (Hypoluxo Island, today, under the Manalapan Club) he hauled it out at his east landing and planned to make her into a sloop. Uncle Will and Mr. [Ruben] Pease, who were good carpenters, helped with the work of putting in a centerboard and half decking her forward and along the sides. When rigged with a jib and a leg-o-mutton mainsail she made a pretty good sa
It was the first week of September that Father announced his intention of making a trip to Titusville in his new boat, the Creole, for much needed supplies. … When Father had been gone about two weeks there came a hurricane. It was not a very bad one, but it lasted five days. A few days after the storm, the seas were calm and we looked for Father to return. But he did not show up and the weather became stormy again and there was no news from up river in all that time. No one came to the lake so there was no news of storm damage from up Indian River, nor any news from Father, and the family on Hypoluxo Island was worried and anxious.
We kept on worrying and wondering as week after week went by and no word from Father or the Creole. I spent a good part of each day, when not hunting or fishing, in the top of an old rubber tree that stood on the west shore of the island south of the landing, with the old long spyglass resting over a limb I scanned closely the lake to the northward. While the magnifying power of the old telescope brought distant islands and shorelines into plain view, it did not show that which I most longed to see – Father’s boat coming home.
One day as I climbed to my customary perch in the tree I was overjoyed to see a sail far up the lake. But a minute’s scrutiny with the spyglass caused my sudden joy to vanish; it was not Father’s boat, but a much smaller craft. It was a very small boat that had come from up river by way of the sawgrass route; they brought a letter from Father, who was at Jupiter waiting for a smooth sea to make the outside run to the lake. We were certainly pleased to hear that he was safe and well and so near home. But days and days went by and the wind continued to blow hard from off the ocean and then there came another hurricane, which lasted only a day and one night, but was most severe; the worst we had experienced since 1876. The wind was from the east-northeast on the first day and most of the following night, and how it did blow and rain. The rain was the most tremendous any of the settlers had ever seen before or since. The rain drove in through the sides of the house until the entire inside was afloat; boards had to be laid on the floor so Mother could attend to her work without wading. About two o’clock in the morning the wind shifted to the southeast and about an hour later began to slacken just a little. Up to this time it had been impossible for us to sleep on account of the roar of wind and rain and of the possibility the house might be blown down. When the wind shifted there was some protection afforded by a hammock to the southeast of the house, and knowing by the change of the wind that the hardest had passed, we “turned in,” as the sailors call going to bed.
In the morning a scene of desolation met our gaze when we went to the door and looked out. Coconut trees blown down or their leaves whipped to threads, leaves and limbs scattered all over, bananas all flat on the ground, and not a whole tree or plant anywhere; and the lake – it was near five feet higher than before the storm. The whole back country was flooded by the September blow and now this had caused it to rise beyond all bounds. It flowed over the low spot in the spruce ridge to the north of Bradley’s through the pine woods into Lake Worth. And up across from the inlet it flowed into the lake from the back swamp in such a volume it created a large deep creek.
A few days after the storm Father reached home in a skiff borrowed from Mr. Rogers, the lone settler at the haulover. The last hurricane having raised the water in the sawgrass to an extreme height and good northeast wind blowing, Father decided to try the sawgrass route from Jupiter to the lake. He found the swamp like a great open lake, and had no difficulty in its navigation in the Creole; he landed at the haulover only a few hours after leaving Jupiter. Here he had to leave the Creole until help could be found to haul her over the three hundred yards of hill and dale to the lake. Borrowing the skiff of Mr. Rogers, he rowed it to his home a distance of twenty miles.
It was a week or so later that the tram road was built at the haulover, and the Creole was the first freight hauled by the new road from the swamp to the lake, and when she again rode anchor near her home dock, eight weeks had elapsed since her departure for Titusville.”
I tell this story in the first person AS my Grandfather. The trip took nearly months to complete. As an aside, Emily Lagow (she MET Jim Bell who she later married on this trip) was but a day behind my Grandfather in Captain Abbotts trade boaton its first trip down the lagoon boat and rode the hurricane out anchored near Gilbert’s Bar HOR. Gramps was at Jupiter Light. Em Lagow even stopped and visited the Faber Brothers at Rockledge where my Gramps had weathered the 5 day storm while suffering the flu. Here is Em Lagow Bell’s account; From My Pioneer Days the above booklet Sandy shared with Jacqui;
“We went on to the House of Refuge at Peck’s Lake, on the way to Jupiter. “We got the sails all down, for the clouds were black, and about four in the afternoon it began to rain and blow so that the spray came over on the boat, but we were in a good harbor and it was fierce all night, and lasted 24 hours. We were all right. That was my first experience of gales in Florida. I was so scared I couldn’t lie down or sleep till it was over.
We started for Jupiter and arrived at noon, so glad to get ashore to walk around. ”
My Gramps had left that morning up Lake Worth Creek to Mr. Rogers mentioned above. Jacquie, I transcribed this document years ago and not only have the story, but I indexed it also. Yours for the asking. Cheers!
My brother, Todd, has programmed a way to present a running comparative of satellite imagery in an easy way for all to understand. These images are a revolutionary tool for the St Lucie River movement and for the state of Florida. They help us to understand, and put us in a better position to ask for change as we are up to date and we know how things work. And although experimental, the concept is on track. Make this link a permanent part of your Lake Okeechobee tool kit. Read here:
In my last post, I shared my brother Todd Thurlow’s “Lake Okeechobee Satellite Images 1972-2013.” Today, I am sharing his Lake Okeechobee Satellite Images 1982-2018.
Hmmm?
In 1972, I was 8 years old…
In 1982, I was 18 years old…
A lot changes in ten years, and an extra-lot changes in the 100 years we have not taken good care of our state’s largest lake; this is now affecting millions of people and the remaining wildlife we have left.
Todd told me he did not “create by hand,” as I alluded to in my last post, but rather he used a USGS website tool to do it, and then converted, and loaded to YouTube, embed, etc.
In the last video the emphasis was on an a visible algae bloom in 1979, in this “video” the dates of algae blooms are not marked, but you can see clearly blooms towards the end as we reach 2018.
Unless something drastic occurs structurally, socially, and politically, I am sorry to say that we are doomed to have more and more algae blooms in the future.
~“The consequences of ignoring ecological planning and environmental protection could be economically devastating in a way not commonly foreseen.” Environments of South Florida Present and Past, by Patrick J. Gleason 1974.
Present Lake O algae bloom, as first publicly reported June 2nd, has grown to approximately 253 square miles. Although larger, this bloom appears less dense from space than either the June 24th or July 2nd 2016 images – that measured approximately 239 square miles. Image courtesy of Todd Thurlow, 6-20-18. See other satellite images here: http://www.thurlowpa.com/LakeOImagery/
The algae in Lake Okeechobee is Mother Nature’s political checkmate, the time in chess in which the King cannot escape…
Thank you to Department of Environmental Protection Secretary, Noah Valenstein, whose Emergency Order directed by Governor Rick Scott, announced yesterday, will implement an array of new actions to move more clean water south into the conservation areas and away from the estuaries.
Sending algae that is potentially toxic to the communities of the St Lucie River and the Caloosahatchee is political suicide even for the Army Corp, an entity that is basically untouchable, like a King.
But since the state is legally in charge of water quality, not the Corp, the order comes from Florida’s Executive Branch as they, became aware of the seriousness of the problem. The Corp has reported they were lessening discharge amount anyway, however, they did not recognize the health threat of the algae…
Nobody wants to purposefully poison the estuaries, but the Federal Government and the State of Florida does when algae, potentially toxic, is sent through gates connected to Lake Okeechobee. We are all in a difficult situation, a chess game whose rules are outdated and were created years ago…
And even if there is “limited capacity” to move water south, it can be done. “Something” is “everything” in this water game of chess. We must take what we can get, check the King, and then go back for more – the goal to close the gates forever. “Checkmate.”
In my opinion, this emergency order is a real move that will send more water south and help reinforce a “send water south,” political culture that all Florida must embrace!
God Save the Queen, our one and only, “Mother-Nature.”
(I have updated this post due to spelling errors, etc.. 6-24-18. Sorry. I, like everyone, am exhausted. JTL)
I could never do what I do without the people who help me. My husband, his pilot friends, the everyday people sending me “toxic-algae” imagery, the River Warriors community, and when it comes to striking the bull’s-eye, my science-studied-lawyer, little brother, Todd.
Just hours ago, Todd forwarded these images from satellites, Landsat 7, and Sentinel 2, clearly showing a large algae bloom photographed yesterday in Lake Okeechobee. 102 square-miles of it!
So Florida state agencies, and others…
…Do not tell me the algae comes from our river. It does not. We have been through this before….
The algae, that can become toxic, and maybe already is, starts in, and comes from the crock-pot of Lake Okeechobee. The Army Corp of Engineers should stop discharging right now. Right when the Colonel sees these images. And these images have been seen, because NASA makes these images available to the Corp.
When a satellite image like this is made public, it cannot be ignored.
The ACOE should close the gates of S-308 until DEP has tested all edges of this large bloom. And work for never discharging when there is an algae bloom in Lake Okeechobee.
I woke up to seeing sunshine through the window. I looked at my phone. My brother’s text read: “S-308 just jumped to 1484 cfs and its climbing.”
(Go to St Lucie River for reports: http://www.thurlowpa.com/news.htm)
In Sewall’s Point, today is the first morning in three weeks that it hasn’t been raining, or just about to. My porches have been slick with moisture and leaves. The frogs in my pond are so loud at night I have to put in ear-plugs. My husband and I laugh saying you can count sheep, but there is no sleep!
In spite of all of this and the fact that the ACOE has been discharging from C-44 canal basin since around May 16, and the St Lucie River already looks like hell, it is still disappointing and heart-wrenching when they formally “open the gates.” ~To Lake Okeechobee that is…
In spite of the history, or knowing why they do it, it just seems so wrong that little St Lucie has to take basically one-third of the crap water for the state. Sorry and I know my mother will not like that word, but its the truth. Thank God for Joe Negron and his work last year as President of the Florida Senate and resurrecting the EAA Reservoir. And curse to any new Governor who does not help it be fulfilled.
The natural drainage basin of the St Lucie River shown in GREEN below was much smaller than it is today. The introduction of four man-made drainage canals dramatically altered its size and the drainage patterns. This primarily being C-44, the canal connected to Lake Okeechobee (bottom). One can see from the map image that C-44 Basin and of course Lake O’s water, the most effective assassins, were never part of the St Lucie Basin as were not Port St Lucie’s C-23, C-24, and C-25 system. These canals have killed our river!
The EAA Reservoir must be built, and in time, more water must move south to Florida Bay. We shall be fixed or compensated or a combination of both for our now noxious-reality. We will not accept this fate. Who knows what this summer shall bring. But one thing is for sure, this life along the St Lucie, is now toxic.
Drainage changes to the SLR. Green is the original watershed. Yellow and pink have been added since ca.1920. (St Lucie River Initiative’s Report to Congress 1994.)
A lone Great Egret looks for fish along a putrid looking, foam filled river. All images taken yesterday, 5-31-18 at Ernest Lyons Bridge. JTL
Thank you to ACOE for the following information and press conference yesterday.
Lake O water management slide_20180531: this slide shows lake levels comparatively. The lake is now high going into hurricane season, starting June 1st, ironically today. The lake is managed as a reservoir for agriculture.
Email 5-31-18
All,
The U.S. Army Corps of Engineers (USACE) Jacksonville District will start releasing water from Lake Okeechobee this weekend as part of its effort to manage rising water levels.
The discharges are scheduled to begin Friday (June 1). The target flow for the Caloosahatchee Estuary is 4,000 cubic feet per second (cfs) as measured at Moore Haven Lock (S-77) located in the southwest part of the lake. The target flow for the St. Lucie Estuary is 1,800 cfs as measured at St. Lucie Lock (S-80) near Stuart. Additional runoff from rain in the St. Lucie basins could occasionally result in flows that exceeds the target.
“Historic rain across the region since the middle of May has caused the lake to rise more than a foot,” said Col. Jason Kirk, Jacksonville District commander. “We have to be prepared for additional water that could result from a tropical system. The lake today is above the stage when Irma struck in September, which eventually caused the water level to exceed 17 feet. A similar storm could take the lake to higher levels.”
Today, the lake stage is 14.08 feet, up 1.25 feet from its 2018 low which occurred May 13. The lake is currently in the Operational Low Sub-Band as defined by the 2008 Lake Okeechobee Regulation Schedule (LORS), but within one foot of the Intermediate Sub-Band. Under current conditions, LORS authorizes USACE to discharge up to 4,000 cfs to the Caloosahatchee (measured at S-77) and up to 1,800 cfs to the St. Lucie (measured at S-80).
“Forecasts indicate more rain is on the way in the coming week,” said Kirk. “Additionally, long-range predictions indicate increasing probabilities of above-average precipitation for the rest of the wet season. We must start aggressively managing the water level to create storage for additional rain in the coming wet season.”
Photo of Jupiter Island, The Stuart Daily News, 1937, courtesy Knight A. Kiplinger.
My brother, Todd Thurlow, created a new “Time Capsule Flight” to give us historic perspective into my last blog post asking a question about an aerial photograph on page 3 of a 1937 Stuart Daily News, special edition, featuring Jupiter Island’s Golf Course.
“Fill or not fill?”
This was my question!
I had written: “When I first saw this photograph, it struck me that I did not recognize the area with exposed white sand on the east side of the island. I wondered if that was a remnant fan-like formation from an ancient inlet. Then it struck me that perhaps it was fill dredged from the Indian River lagoon for the golf course – or a combination of both.”
Todd’s video flight, using historic maps from 1883, 1885, and 1940 as well as today’s Google Earth technology, answered this question.
Jacqui: “Todd so after watching your time capsule flight it appears that the Jupiter Island Golf course was a natural wetland or mangrove something? It is sticking out into Indian River Lagoon on your oldest 1800s map- so it’s not entirely dredge and filled? Right?”
Todd: “Yep. Probably was swampy like Indian River Plantation (Marriott) and filled in with dredge from the ponds or Hobe Sound but more than likely before the channel/canal was dredged by the Feds in 1935. The Jupiter Island web-site says the Golf Course was built in 1922.”
Watch Todd’s video below and see for yourself the fascinating changes over time. Good for the golfers, not so good for the birds! Mystery solved by a Time Capsule Flight! Thanks Todd!
Todd’s video Jupiter Inlet 1883, 1885, & 1940 Lake Worth to South Jupiter Narrows: (https://youtu.be/VwoAXOrtRu4)
If the discharge waters of Lake Okeechobee filled up the City of Stuart, Florida. Last Thursday, they would have reached the top of Stuart’s iconic water tower that stands at 134 feet.
Stuart, North of Monterey.
Whereas, if the ACOE’s discharge waters of Lake Okeechobee were “filling up the City of Stuart,” last Thursday, October 26, these polluted waters, would have reached the top of Stuart’s iconic 134 foot water tower…
Whereas, once again, our economy and ecology is completed devastated, and high bacteria levels in the water are exacerbated therefrom….We shall remember this day…
We shall, therefore, designate, Thursday, October 26, as “Water Tower Day” and say together: “Lake O discharges have reached the top; this must STOP!”
Stop the Discharges
Yes, to put the Lake Okeechobee discharges into perspective, last Thursday the cumulative 2017 ACOE/SFWMD discharges from S-80 passed 134 “Stuart Feet”. The Stuart water tower is 134 feet tall. See my brother Todd’s cumulative total page below:
– In the lost summer of 2013, Stuart/Martin County received 284 “Stuart Feet”, 2.1 times the height of the tower.
– In 2017, the gates did not open until September 5. So it took only 52 days to accumulate that same amount of discharges!
– In 2013, the discharges started on May 8 (with the exception of some small pulses earlier in the year). That year, it took 91 days to hit a cumulative “134 Stuart Feet” – on August 7.
In other words, the discharges have been almost twice the rate as they began in 2013. You can see this in the slope of my brother’s graphs in the web page above. This doesn’t really mean a lot though. In 2013 the discharges didn’t really begin to accelerate until mid-July. At that point, the rates of discharge were comparable to what we are getting now.
– At the current average of about 4200 cfs, we would hit the 2013 total of 284 Stuart feet in another 42 days (December 9). If they are saying the discharges could continue for months, this could happen. We could have another record year, even though the disaster didn’t start until September. Maybe they will throttle it back a little or start pulsing again so it won’t be the case. In any event, this is already another lost year…
(This blog post was based on writing and ideas by my brother and contributing blogger, Todd Thurlow, http://www.thurlowpa.com)
* I edited this post from “today” to “last Thursday.” An ever rising story. 🙂 JTL
The following is a texting conversation between my brother, Todd, and me, just over an hour ago. As you can see, Todd keeps me in real-time. Now, I wish to share with you.
Todd: Hi Jacqui, looks like it’s “balls to the wall” —like the old jet fighter saying.
Lake O is at 17 feet and rising…
Jacqui: Holy —! Didn’t Gary Goforth say the max for S-80 is 12,000 CFS? How much is this?
Todd: This is normal high-end. ~4000 cfs. In 2004-2005 it looks like they maxed at 5-6000cfs. I’ll graph against the lake stage.
Jacqui: How do u know it’s 4000? I see nothing posted 4 today on ACOE site.
Todd: S-80 hit 6,727 cfs on 10/06/2004. The lake was at 17.86 and rising it peaked at 18.02 on 10/13/04.
Hurricane Jeanne had hit days earlier on Sept. 25
Jacqui: I remember that. Bad.
Todd: Also. The 4000+ right now is instantaneous. The stats you always see are a mean for the day. Right now that are piling between 1000cfs and the high 5000s. It looks like they did almost hit 6000 earlier today.
Pulsing not piling.
Jacqui: Awful. I think it stinks that unless you know how to access all the technology, you don’t know the river is getting slaughtered until the following days. A nightmare. Thanks Todd. Goodnight.
Aurthur Ruhnke, post hurricane 1949. Archives of Sandra Thurlow.
The following is a follow-up to my recent post “Our Most Powerful Hurricane,” about the Hurricane of 1949 that devastated Stuart, Florida. It proved to be very popular and my brother Todd relayed more notes that I would like to include. The original post can be found at the bottom of the page.
Hurricane season runs from June 1st through November 30th.
Paths of hurricanes 28, 33, and 49, shared by Todd Thurlow.
Notes:
Jacqui,
Attached is the National Weather Bureau 1949 year-end summary of the hurricane season. It is very interesting to read.
MONTHLY WEATHER REVIEW 339 NORTH ATLANTIC HURRICANES AND TROPICAL DISTURBANCES OF 1949, Richmond T. Zoch
It’s hard to believe that the official reports still reflect a Cat 4 storm at 135mph for the “49 storm with the higher wind speeds being reported. That storm sounds more like a Cat5. The ’28, ’33 and ’49 storms took almost identical paths. See http://bit.ly/2fy4hww
Quotes from the attached report: “The strongest wind occurred, as usual, some distance to the right of the center in the vicinity of Jupiter and Stuart, Florida. The anemometer failed at Jupiter Lighthouse after reaching a velocity of 153 m.p.h. The observer reported that winds were somewhat stronger thereafter, but he felt unable to make a reliable estimate of the peak strength.”
“The water of the lake rose 12 feet or more at places on the southeast and east side of the lake, but the levees held and there was no flooding from the lake.”
Sandbar, St Lucie River/Indian River Lagoon, Memorial Day Weekend, 5-29-17, Todd Thurlow.
Today I am comparing and contrasting photos of the St Lucie River/Indian River Lagoon in May of 2016 to photos in 2017. A Lake O dump year to a non-Lake O dump year. “A picture speaks a thousand words”…maybe more.
Jacqui
________________________
Photos of the Sandbar at the confluence of the St Lucie River and Indian River Lagoon this Memorial Day weekend, 2017. Clear, clean water, although meadows of seagrass in Sailfish Flats has not yet returned.
Today’s blog post, created by my brother, Todd Thurlow, just totally blows my mind. His time-capsule flight through images of Google Earth, historic maps from 1850 and 1940, and an aerial from 1958, takes us on a journey through the extensive pond-land/wetland that used to be the area of Downtown Stuart and beyond. Today we all live here, most of us not even realizing what the land once was…this wetland now “magically” drains into the St Lucie River.
In Todd’s video you can see that Stuart Middle School actually is now sitting where an old pond used to be; there were ponds expanding and contracting with the rains in today’s Memorial Park; there were ponds in the areas of today’s County Courthouse; there were ponds scattered over today’s airport, Witham Field; there were extensive ponds along East Ocean Boulevard and Dolphin as featured in last Friday’s popular blog post. Yes, there little ponds just about everywhere!
Sometimes we think the wetlands are “out west” and they are, but years ago they were also here. I have to say am guilty of this too. When I came home after university in 1986 and just about everything was developed, once again, amnesia! Look, after you watch Todd’s video, and notice the drainage canals around Monterey Blvd., St Lucie Blvd, back by Kingswoods Condo, and on the edges of Witham Field and there are many more. Of course like the grates and drains in every parking lot, these canals drain into our ailing St Lucie River. Lake Okeechobee is the big toxic hammer but there is local destruction too…
She describes a 1958 aerial photograph that hangs in my law office. The photo is from my parent’s “Thurlow/Ruhnke” collection. I had used the photo for a Google Earth presentation for Stuart Heritage on May 8, 2012. http://www.stuartheritagemuseum.com/
This is a recording of maps and photographs used for part of that presentation: 1850s Government Land Office Plats, 1940 USDA aerials and the 1958 Thurlow/Ruhnke photo.
There is no sound or text overlays but here are a few features to note:
0:50 –What was called the “Stuart Middle School Pond”. We jumped in that pond on the last day of school to celebrate graduating from 8th grade. A few years ago the pond was filled in to make room for a new building.
1:00 – The end of Fourth Street (what is now called East Ocean Blvd). East Ocean Blvd. ended at the intersection of St. Lucie Blvd/ Oriole Ave. on the left (north) side and Dolphin Drive on the right (south) before it was extended to the “Bridges to the Sea”.
1:14 – The oblique aerial described in Jacqui’s blog. Note the building in the bottom right corner. That is the Broadway Service Center which still stands today. See https://goo.gl/iODQwU
1:47 –The Evan’s Crary Bridge (aka the Ten Cent Bridge) under construction in the background
2:24 – 1940 flyover of Dolphin Drive. Note the single building in the middle of nowhere. That residence is still standing on the corner of SE 6th Street and Flamingo Ave. According to the Martin County Property Appraiser, it was built in 1925, years before the photo was taken.
2:30 –The 1940 view before our current airport. The previous Krueger Airport was off of East Ocean Blvd. Dolphin Drive continued all the way from East Ocean Blvd. to St. Lucie Blvd. by the river. If you have ever taken the “back exit” from the Stuart Air Show onto St. Lucie Blvd, that still existing right-of-way is what used to be the other end of Dolphin Drive.
~Todd Thurlow
Thomas H. Thurlow III
“Time Capsule Flights,” created by my brother, Todd Thurlow, has been a shared favorite on my blog since 2014. In these remarkable videos, Todd uses his legal and historical knowledge to create a living collage juxtaposing historic and modern-day images to achieve dramatic insights into watershed and land use changes in Florida over the past hundred years. These videos are a must for anyone wishing to understand our state’s history or working to restore its waters and lands in the future. You can access all of Todd’s videos here: http://maps.thethurlows.com.
1940s Dept. of Ag. aerials Martin Co. Dark areas are ponds/wetlands.
Comparison of 1883 historic map and Google Earth image 2017, Ft Lauderdale’s New River Inlet
Today I am sharing two creations of my brother, Todd Thurlow. Entitled “Ft Lauderdale House of Refuge/Life Saving Station,” and “Short Version,”they were originally for my mother, Sandra Henderson Thurlow and Timothy Dring’s “Image of America, U.S. Life Savings Service” book presentation at the Elliott Museum.
For me, Todd’s videos are mind-boggling as they bear witness to how much and how fast we humans can change the environment. Like an army of ants, we organize; we build; we destroy; we create…
By comparing and contrasting Google Earth maps of today with historic maps from 1883, 1887, and 1935, Todd’s “time capsule flight,” takes us through time and space to see the shifting sands of the multiple New River Inlets; Lake Mabel that morphed into Port Everglades; remnants of the forgotten Middle River that spread and contracted into new canals and developments; and of course, for mom, House of Refuge #4, that once rested north of a New River Inlet that today we can see is completely filled in, while beach-goers relax in reclining chairs like nothing ever happened!
Maybe one day we humans can use all this energy and ability to really fix our waters that have been destroyed during all this construction? Wouldn’t that be a dramatic video?
In closing, in the early 1900s, the New River… that was believed by the Seminoles to once be an underground river that collapsed and the Great Spirit revealed during an earthquake… was selected by modern-day humans as the “natural channel” to connect two of the largest drainage canals from Lake Okeechobee to the Atlantic Coast, the North New River/South New River, and the Miami.


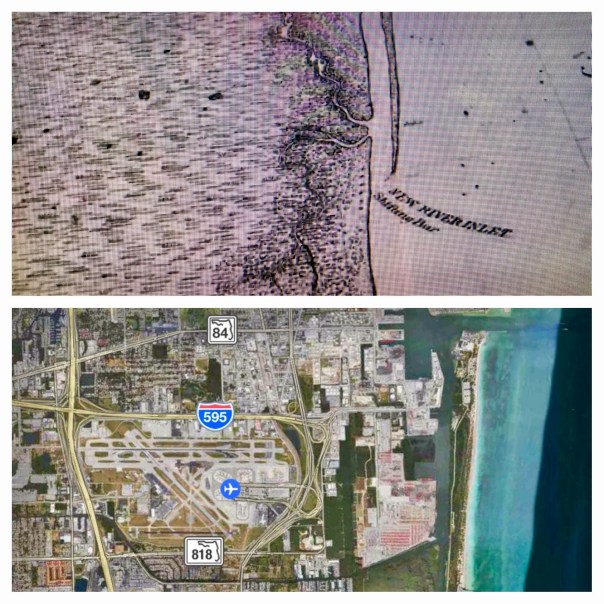


