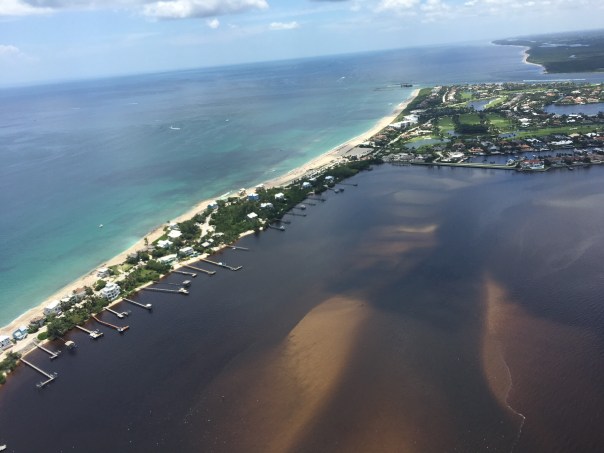
 Everglades National Park, JTL
Sometimes the history of the Everglades is really confusing. Why, with all of the environmental advocacy, since the 1970s, does the health of our environment remain crippled? One way to simplify it is to think in terms of before and after the 1947 U.S. Central and South Florida Plan. Of course there is extensive history before 1947, but it was after 1947 that things in South Florida’s water world became culturalized, compartmentalized, and legally defined. Before we talk about this 1947 Central and South Florida Plan, let’s review some important highlights pre-1947.
1. Hamilton Disston begins the drainage of Lake Okeechobee (1881)
2. Governor Napoleon Broward hires U.S.D.A. scientist James Wright who determines that “eight canals would indeed drain 1,850,000 acres of swampland” (1904)
3. The U.S. Congress’ Rivers and Harbors Act includes significant funds to deepen the manmade Hamilton Disston connection of the Calooshahatchee River to Lake Okeechobee (ca.1910)
4. The scandal of James Wright (from #2 above) who was deemed “a fraud” for the failure of the land to drain as expected ~causing the slump in swampy real estate sales (1914)
5. The resurgence of confidence in sales and a 1920s real estate boom fueled by advances in soil science, and the success of agricultural start-ups located in Moore Haven, Belle Glade, and Clewiston south of Lake Okeechobee
6. Land in a defined “Everglades Drainage District” more fully being systematically cut into sections for development with canals draining agricultural fertilizers and other chemicals into the waters of the state (1924)
6. Two very powerful hurricanes causing thousands of deaths and the destruction of property, and thus the state’s “call for a higher dike” (1926 and 1928)
7. The state’s reaction to the hurricanes, the 1929 establishment of the “Okeechobee Flood Control District” for the “Everglades Drainage District” as well as the Federal Government’s Army Corp of Engineers taking over “field operations”around Lake Okeechobee ~including the building of a thirty-five foot earthen dike and ingeniously using navigation funding to build the cross-state-canal, connecting the Caloosahatchee and the St Lucie Estuaries to Lake Okeechobee ~conveniently working as discharge-escapes through those estuaries when “necessary”

So, as we can see, a lot happened pre-1947, but it was what happened after, were things really changed…
In 1947 it rained and rained, and there were two hurricanes. From Orlando to Florida Bay the agricultural and developed lands, that had been built in drained, once marshy, swampy areas, really flooded, and in some places a foot of water sat for months. There was great economic loss.

The crying cow booklet, above, was sent to every member of the U.S. Congress.
To fight Florida’s destructive “flood waters” the 1948 U.S. Congress adopted legislation for the CENTRAL AND SOUTH FLORIDA PROJECT, a twenty year flood plan from Orlando to Florida Bay that included the formal creation and protection of the Everglades Agricultural Area south of Lake O, the Water Conservation Areas, intertwined with thousands of miles of canals and structures to control the once headwaters and River of Grass. HOUSE DOCUMENT 643 – 80TH CONGRESS (00570762xBA9D6)

Next, mirroring the same terminology the United States Government had used (the Central and South Florid Project) the state of Florida created the “Central and South Florida Flood Control District” to manage that CENTRAL and SOUTH FLORIDA PROJECT. A bit confusing huh? A tongue twister. And in a way one could say, at that time, the Central and South Florida Project and the Central and South Florida Flood Control District “became one.” The overall goal above all other things was flood control. And this marriage of the Central and South Florida Project and the Central and South Florida Flood Control District was successful at controlling the waters, but it also killed the natural environment, thus Florida herself.
This embedded cultural philosophy of “flood control only” was challenged in 1972 with the birth of the national environmental movement, and a consciousness that the natural system that supported Florida’s tourism, quality of life, agriculture, not to mention valuable wildlife, was in tremendous decline.
As Florida matured came Governor Claude Kirk, a republican, in 1968, who was advised by environmentalist Nathaniel Reed. Then came Governor Reubin Askew, a democrat. The Florida Legislature, seeing the destruction of the state’s natural resources, passed a very important piece of legislation, the “Florida Water Resources Act,” today’s Chapter 373 in Florida Statures. (http://www.leg.state.fl.us/statutes/index.cfm?App_mode=Display_Statute&URL=0300-0399/0373/0373ContentsIndex.html)
This law created five Florida water management districts with expanded responsibilities for regional water resources management including environmental protection not just flood control.
Accordingly, the Central and South Florida Flood Control District changed its name, but not its heart, becoming the South Florida Water Management District, we know today…(https://www.sfwmd.gov)
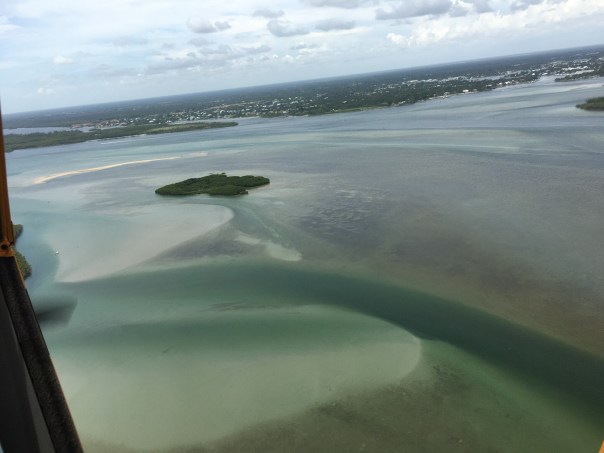
 Everglades National Park, JTL
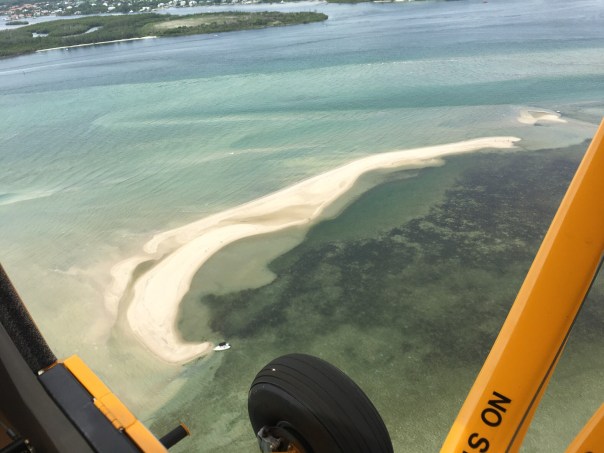


 Recently, at Rivers Coalition Defense Fund meeting, president Kevin Henderson brought along the old River League’s briefcase. It had been stored away for many decades in an aging house in Stuart. In case you have not heard of them, “The River League” worked tirelessly in the 50s and 60s to stop the expanding destruction of our rivers by the Florida Flood Control District (today’s South Florid Water Management District) and the Army Corp of Engineers.


