I, as many, have seen and received multiple algae reports via Facebook, text, and through the tremendous reporting of Tyler Treadway of the Stuart News. Now, I am encouraging everyone to take the time, and it doesn’t take much, to report their algae sightings in the St Lucie River/Indian River Lagoon to the Florida Department of Environmental Protection, (DEP).
It was Mike Connor who reminded me to do this, after my husband Ed accidentally spotted the algae lines by plane off Port Mayaca ~in Lake Okeechobee~ on June 2nd, the day after the ACOE started discharging.
At first I thought, “I’m too busy for that…” and then I realized of course I need to report to DEP because then the state is obligated to document and to test it for toxcidity.
Better yet, if everyone who is reporting via social media and text called DEP, there would be so many test sites for DEP to test, it would exhaust their resources.
Oh well…
Since our resources are gone, this is only fair.
As they say: “All is fair in love in war.”
Please report algae sightings; see link below.
If you can’t figure it out this unclear website, call the Governor’s office: 850-488-7146 or Noah Valenstein the head of DEP: 850-245-2118.
A new day could dawn for Florida, should Constitution Revision Commission proposal #24 go on the 2018 ballot. This ballot initiative would allow the electorate to vote for a “Commissioner of Environmental Protection.”
I sponsored this idea, an idea brought to the CRC’s attention by two speakers during the public hearing process, as well as by public proposal #700012, submitted by Mr. Gamez.
Formally expressed Proposal #24 reads:
“A proposal to amend Sections 3 and 4 of Article IV and create a new section in Article XII of the State Constitution to establish the office of Commissioner of Environmental Protection as a statewide elected officer, to provide duties of the commissioner, and to include the commissioner as a member of the Cabinet.”
Why do I support this idea? Because it is my job as a commissioner to get some of the thousands of public ideas before the CRC, and because I believe the “time is now” for the Environment to have a seat at the table with other cabinet positions.
Yes, environmental protection of natural resources must rise to the top of state priorities just as the state’s oldest and number two economic driver, agriculture, has. Our Natural Resources must be represented in the Florida Cabinet. This year, the Florida Chamber reports that Florida’s population, now at 20,000,000 will reach 26,000,000 by 2030, in just twelve years! It is tourism that is Florida’s number one economic driver. Much of this success is based on the beauty and quality of our beaches, rivers, and springs, and natural lands. We all know, growing incidences of algae blooms in lakes, springs, and rivers, some in areas of natural lands, is not good for tourism.
Let’s look at Florida government’s present hierarchy having to do with natural resources and discuss why it should be changed. The state’s present organizational chart shows a Commissioner of Agriculture as a cabinet position just under and to the right the Governor; a Fish and Wildlife Commission, and a Department of Environmental Protection, as executive agencies under the executive branch of the Governor; and the Water Management Districts in the lowest tier as local government. Interestingly, the Water Management Districts are attached by a dotted line to the Department of Environmental Protection noting at “unique relationship.” This is qualified by the following sentence: “Water management districts have individual governing boards but the Department of Environmental Protection may exercise general supervisory authority over water management districts (s. 373.026(7), Florida Statutes).”
The Fish and Wildlife Commission much more independent, but the Water Management Districts are not. Because Water Management Districts levy taxes from citizens as a special district one must be cognizant so that they not become “arm of the state.” But what would be even worse would be if the Water Management Districts were not answering to the people they tax…
Hmmmm?
It is time to have a “lead agency.” An agency that can answer to the people.
Let’s discuss leadership. Right now there is no clear environmental protection leader. For instance, in my opinion, for a citizen trying to get answers about why our environment is falling apart the Water Management Districts are pointing in one direction; the Department of Water Quality for the Commissioner of Agriculture’s Best Management Practices is pointing in another; and because the present Department of Environmental Protection is at the whim of politics of every new administration; they are weak, and afraid to lead. With every new governor the pendulum swings. The DEP is unable to fulfill its mission as the state’s lead agency of environmental protection.
And all the while our environment keeps falling apart…
On a personal note, for years, here in South Florida, I complained about the demise of our St Lucie River/Indian River Lagoon and surrounding environment and pushed for more action on behalf of the South Florida Water Management District. After years of head nods, I was finally told by a Governing Board member that the District’s number one priority is not water quality, but flood control and that I should be speaking to DEP.
“Why didn’t you tell me that earlier,” I exclaimed.
When I contacted Department of Environmental Protection their response was lackadaisical noting that many entities of the state oversee water quality and environmental issues. For instance, Best Management Practices for Agriculture, and the complicated DEP Basin Management Action Plans/Total Maximal Daily Loads in coordination with the Water Management Districts, and all local governments including cities, counties, villages…
“But who is in charge?” I asked? “The St Lucie River has been labeled “impaired” by your agency since 2002. Why was it allowed to get that bad in the first place and why is it continuing to get worse?”
Again I asked, ” Who is in charge?”
There was silence…
I thought to myself, “No wonder the Department of Environmental Protection is sometimes referred to as the agency of “Don’t Expect Protection.” No wonder every year more of the state’s waters are reported as “impaired.” No wonder D.E.P., Agriculture, and the Water Districts collude to extend the Basin Management Action Plan deadlines instead of getting more serious about the detrimental ramifications of non-point pollution for the people.
Enough is enough. The time is now to give voters the opportunity to vote for a Commissioner of Environmental Protection and finally have a seat at the table.
This homemade chart shows a Commissioner of Environmental Protection being created from the present Dept. of En. Pro.
Proposal #24
 The commissioner of environmental protection shall have
   63  supervision of matters pertaining to environmental protection
   64  that the Department of Environmental Protection or its successor
   65  agency and water management districts are required or authorized
   66  by law to implement and administer.
Jacqui Thurlow-Lippisch is a commissioner on the 2017/18 Constitution Revision Commissioner; *this proposal will go before the Executive Committee sometime in December or January. If it gets through that committee it will have to make it through both General Provisions and Ethics and Elections. You can support or voice concerns about this proposal by first writing the Executive here: https://flcrc.gov/Committees/EX/
Recent pictures of our Florida environment that are NOT good for tourist!
Alan Youngblood, Florida Springs, -when too much water is taken from the aquifer by permitted users it affects the health of Florida’s springs, 2013.St Lucie River, toxic algae bloom brought into river from discharges from Lake Okeechobee. Best Management Practices and Basin Management Action Plans are not working fast enough. Tourism suffered in Martin County by millions of dollars in lost revenue and health issues for local citizens. 2016, JTLAlgae pouring in from Lake Okeechobee to St Lucie River at S-80—this water comes mostly from polluted Central Florida waters; obviously DEP’s environmental protection is not working. 2016.
In 1998 the Constitutional Revision Commission proposed a rewrite of Article IV, Section IV of the Florida Constitution that reduced the Florida Cabinet from six elected officials to three. Effective January 7, 2003, the Florida Cabinet consists of the Attorney General, the Chief Financial Officer and the Commissioner of Agriculture. The Cabinet offices of Secretary of State and Commissioner of Education became appointed offices and their respective agencies became the responsibility of the Governor. The revised constitution also created a new State Board of Education with seven members appointed by the Governor to oversee the Department of Education. The Cabinet offices of Treasurer and Comptroller were merged into the new position of Chief Financial Officer who serves as agency head for the newly created Department of Financial Services.
This 1925 Florida News Real Estate Investor’s Guide, reminds us exactly how developers saw Florida in 1925, “as the greatest real estate development in the world!”
Sure, Florida remains perhaps “the greatest real estate development in the world,” unless of course, our waters are, “now and then,” filled with toxic algae.
Let’s hope that the Florida Memory Project’s future timeline will not reflect that our generation allowed the destruction of the greatest real estate market in the world because we thought we had more time that we really did…
Department of Environmental Protection: http://www.dep.state.fl.us/water/watersheds/bmap.htm
Florida Department of Agriculture, Best Management Practices: http://www.freshfromflorida.com/Business-Services/Water/Agricultural-Best-Management-Practices
Public image, human waste to biosolids-fertilizer, 2017
Today is June 1st, the beginning of the fertilizer ban in Martin County, especially Sewall’s Point that goes through November.
It was Mr Gary Roderick who worked for Martin County that first taught me about Biosolids, or “fertilizer” made from all of our human waste. It was Gary who taught me about the business of spreading this on the lands, the state basically paying farmers to do so, and how no matter how hard we all worked, no matter a reservoir and water sent south or not, the truth of the matter is that we just keep over-nutrifying and polluting the land and thus our waters just as fast as we can try to fix them.
On Sunday , May 27th, 2017 TCPalm ran an article by Lucas Daprile, part of an outstanding series they are doing on this issues. The article begins: “The state plans to allow a massive farm (Sunbreak Farms) on the St Lucie/Indian River County line to annually fertilize its cornfields with 80,000 tons of compost comprised of one-fourth treated human waste.”
Chances are the Department of Environmental Protection will approve this because “it’s safe”…as they have for decades.
This waste-made-fertilizer should be shipped and sold to areas outside of the state that do not have the nutrient issues we do in here Florida –not spread in watersheds that drain into Lake Okeechobee and the Indian River Lagoon.
Drowning in our human excrement? You’ve got to be kidding me.
_____________________________________________
St Lucie County Commission Meeting on this issue “Sunbreak Farm’s Permit”
6pm, June 6th, 2017, 23000 Virginia Ave, 3rd Floor, Ft Pierce, Florida
Useful links/and some articles where Gary Roderick is quoted:
“Wastewater treatment plants (WWTPs) in the United States generate approximately
7 million dry tons of biosolids each year. Since biosolids are rich in plant nutrients, farmers, landscapers, and homeowners use about 50 percent of the annual production of biosolids as fertilizer for plants. Biosolids must meet standards for nutrient, metal, and pathogen content before it can be used to fertilize plants and to improve the quality of soil. Because a variety of pharmaceuticals and other household chemicals have been found in the wastewater discharged from WWTPs, questions have been raised about the presence of these chemicals in biosolids. To help answer the questions the scientists purchased or obtained nine different commercially or publicly available biosolids and analyzed them for 87 organic chemicals found in cleaners, personal care products, pharmaceuticals, and other products.” USGS
Toxic Algae bloom washes up along the shoreline, St Lucie River, Riverside Drive, Stuart, Florida. (Photo Jenny Flaugh, 7-13)
5-7-17: Hutchinson Island along the Atlantic Ocean and confluence of the St Lucie River/Indian River Lagoon, blue waters, seagrass not yet revived from 2013 and 2016 Lake O discharges. Photo Ed LippischMy husband’s flight yesterday over the Atlantic Ocean, St Lucie Inlet, and St Lucie River/Indian River Lagoon is beautiful. But look carefully and you will see a light-colored brownish plume at the mouth of the St Luice Inlet entering the ocean. Finally after months of drought, it has begun raining. And when it rains… (mind you C-44 connecting the St Lucie River to Lake Okeechobee is closed now) the re-directed run-off of waters from canals C-23, and C-24 of course still flow into our St Luice River/Indian River Lagoon.
These canals organized and built during the 1950s and 60s are part of the Central and South Florida Flood Project that the Army Corp built following the hurricane and extensive south Florida flooding of 1949. The run-off waters from these canals and the local watershed are what you see in today’s video.
As damaging as C-23 and C-24 are (they too must be reworked and redirected) they are not the damaging discharges from Lake Okeechobee that throw the St Lucie over the brink as in 2013 and especially 2016 when toxic algae covered extensive portions of the entire St Lucie.
Rio, St Lucie River, Jeff Tucker, toxic algae
…
…
3
Shoreline of Sewall’s Point, Tracy Barnes 6-25-16
…
(Photo mosaic from 2016 shows various photos by Dr Scott Kuhns, Rebecca Fatzinger, (wildlife) JTL/Ed Lippisch, pilot Dave Stone and others.)
In spite of the light brown plume, the short video flight from Jensen to Peck’s Lake shows blue waters near the inlet and mouth of the estuary as it should be, not black water. If Governor Scott does not veto the budget, the reservoir in years to come will help offset the Lake Okeechobee destruction and open the way to truly “send the water south.” #ThankyouJoeNegron
This is very exciting, but believe me, this is no time to let down your guard, as the fight for control of Florida’s waters has really just begun.
Reef system off Sailfish point is covered in black water, sediment, and nutrient pollution when Lake O is discharging. Here after months of drought, and finally some rains we can see the reefs. 5-7-17, Photo Ed LippischMap SFWMD showing canals and basins. Note S-308 or structure s-308 at Lake O and S-80 down the C-44 canal AKA the St Lucie Canal. Both of these structures have to open to allow water to flow into the C-44 canal to the St Lucie River, Indian River Lagoon. All canals are destructive to the St Lucie/IRL yet it is C-44’s Lake O that puts the St Lucie system in complete and total overload.DEP C-23:http://www.dep.state.fl.us/southeast/ecosum/ecosums/c23.pdf
Landsat satellite photo of Lake Okeechobee 7-26-16.
I believe in not being dependent on the federal or state government, but what recently happened along the St Lucie River is ridiculous…
In the months following the June 29th, 2016 “State of Emergency”and toxic algae bloom invasion of the St Lucie River, one thing is clear. Our federal and state governments did not look out for Martin County’s best interests, instead knowlingly discharging toxic algae from the lake into the communities along the St Lucie River— with out so much as “public-peep”— until real tragedy and helath risks had struck. Then suddenly, it was like: “Oh my, where did all this algae come from?”
Well, it happened knowingly because the state and federal government (ACOE/SFWMD/ DEP/ Florida Dept of Health) knew Lake Okeechobee was not “popping” here and there with a few algae blooms as is often the case, but rather was”covered in the stuff.”
By July 2nd commonly distributed government satellite images, like the one above, were showing over 200 square miles of algae bloom that obviously had to grow over time to attain such prominance.
Anyway…the least “they” could have done was to have given the public fair warning to be careful and ready as is standard operating proceedure during a drought when wild-fire conditions are present.
But they did not.
Instead, the Department of Environmental Protection quietly took its tests, reporting to the District and the Army Corp– at their leisure— the few results they attained…They should have warned the county government of more than a bloom here and there. They should have told everyone that a dangerous situation was getting ready to occur. But they did not. Maybe they thought it wouldn’t happen? I doubt it. This is true negligence considering the first duty of government is health, saftey and welfare of the people it levies taxes from…
Thus today, I am sharing a brief exchange between my very technically-savvy brother, attorney, Todd Thurlow, and me, from earlier this week. Todd’s shared images will help us look out for ourselves. Thankfully, the recent Landsat satellite images of Lake Okeechobee, for now, look much clearer of algae than just a few months ago.
The link below the exchange will allow you see the satellite images of the lake over time, dates are also present:
Jacqui: Do the satellite images show any more algae in the lake? J
Todd: I might see some in the southwest quadrant but not definitive. As mentioned before, unfortunately, Landsat 7 has a broken instrument that causes the black lines on the image.
Front page Stuart News 5-27-16 by Tyler Treadway.….
Today I have posted pictures from the front page of the Stuart News, and I am also providing Dr Gary Goforth’s “Lake Event Update” for May 2016. This report gives an update on nutrient, sediment, and polluting fresh water loads into the St Lucie Estuary from Lake Okeechobee. Numbers from Lake O are at/or close to “Lost Summer “2013 levels now.
Today, the ACOE reports Lake Okeechobee at 14.38 feet – a very high level going into hurricane/rainy season beginning June 1st.
Thus the Army Corp of Engineers and the South Florida Water Management District, with the knowledge of other state agencies and entities such as the Dept. of Environmental Protection, the Florida Department of Health, the Florida Legislature, and the Governor will be opening the flood gates to begin releasing more water from the lake today.
Cyanobacteria of toxic levels (as determined by the World Health Organization) is now reported in the lake and canals leading to the St Lucie River/Indian River Lagoon. This is a fresh water bloom and as the estuary becomes more fresh from lake releases the bloom will be able to survive throughout the river and estuary. I do not understand how this is legal in spite of the safety issues of the dike. The federal government in cooperation with our state government is knowingly releasing toxic algae into our waterways –Worse than a third world country.
SLR/IRL conditions report, Dr Gary Goforth 5-26-16 http://garygoforth.net With poor water quality conditions in the Lake, the nutrient and sediment loads to the River/Estuary have already exceeded the 2013 Lake event. Feeding the bloom …
Since January 30, 2016: Nitrogen – more than 1.6 million pounds Phosphorus – more than 190,000 pounds Sediment – more than 34 million pounds
Average flow – more than a billion gallons per day …
Dr Gary Goforth has been kind enough to update his “Flows South Comparison”report. I posted his previous one just this week on 2-22-16. His most recent comparison is included below in slide format. Please click on the slides to enlarge and view information.
The numbers are staggering.
At this point, more than 171,000 acre feet (55.99 billion gallons) of Lake Okeechobee water (blackwater) has been dumped to the river/estuary during just the first 26 days of the 2016 Lake releases; this is equal to 41% of the entire 2013 releases and 16% of the 1997/98 El Nino event. …
We are in for a very difficult, long year of discharges for our St Lucie River/Indian River Lagoon; and they have more than likely “just begun.” We must remain updated, educated, and vocal —and documenting–take photos share what you see. Last night I was told there are dead fish in the area of Sailfish Marina. If you see such a thing take a photo and post it or send it to me with location etc….(jthurlow@me.com) Also continue contacting our state and federal partners and advocating that land be purchased south of the lake to offset these type of events. We shall and are turning this Titanic.
…..Dead pelican floating in discharge water, recent photo from Jupiter Island’s, photo credit: The Guardians.
These aerial photos were taken around 4PM by my husband, Ed Lippisch, this past Sunday, 2-21-16. They show the Lake Okeechobee/area canals’ plume moving south along Jupiter Island over nearshore reefs. There are photos of the exclusive neighborhood, Sailfish Point, at the mouth of the St Lucie Inlet as well.
High levels of Lake Okeechobee and canal discharge water (7000 cfs +/- at S-80) continue to decimate the seagrasses, oysters, fish, and bird life of the St Lucie River/Indian River Lagoon. Our reef communities and property values are also affected.
Unfortunately, even with unprecedented state and federal actions of the South Florida Water Management District and the Army Corp of Engineers to “move water south” from the Water Conservation Areas to Everglades National Park, there is presently no end in sight for the northern estuaries.
There has to be a better way. “Finishing the projects” is not enough….
Over the weekend at my niece Julia’s lacrosse game I ran into a former fellow commissioner, and long time Martin County resident, Dr Paul Schoppe.
“Hey Jacqui,” he said. “I was just thinking about you…”
“Oh really, ” I replied.
“Yes. I was thinking about you when I went down to my dock and saw a dead Snook floating in the foamy dark water….. What are we doing about this river…..?”
Yesterday, I received a call from a Sewall’s Point resident informing me of a phone call he got from a friend in real estate. The friend was photographing the water at his listing on the St Lucie River and forwarding the photos saying: “I hope the buyers don’t cancel when they see the water. They are doing their walk through today.”
At Publix, that evening, I ran into an old-timer of Stuart. He said to me: “Jacqui of course there have been releases from the lake for years…the difference now is that the water is so polluted….”
Flooding on South Sewall’s Point and Riverview Rd. where I live. On 7-17-15 after a major storm event, super moon and high tides the water was very high. This water has never completely receded. Over the past years the high waters and high tides seem to be occurring more frequently. Not just every 50 or 100 year flood. (Photo JTL)South Sewall’s Point JTL 2014.Aerial public image.
River water from the IRL and groundwater coming up through the grates…
The “tides of change” are coming to Martin County. In some places they are already here. As a member of the Florida League of Cites, over the past years I have met officials from counties south of ours in Palm Beach, Broward, Miami-Dade and Monroe who have formal and open departments within their governments to plan for and deal with sea level rise or “nuisance flooding.” It doesn’t matter what you call it, or what caused it, when it’s happening in your city. You just want it gone…
We in Martin County, we talk about rising tides, but not really. It is something for those people “down there….”
I think we need to bring the conversation up here.
I live in Sewall’s Point, a peninsula in Martin County, surrounded by the St Lucie River/Indian River Lagoon. I have lived here since 1974. After graduating from college I left but did return years later to the beautiful peninsula to marry and buy a house with my husband in 2005. Ed, my husband, lived on South Sewall’s Point Road prior to our marriage, my parents still live here, as does my sister, so I have witnessed and heard about many water/weather events over the years in our fair town.
….….…
I have noticed that since Superstorm Sandy in 2012, even though she did not hit here, the waters in my area of Sewall’s Point seem to be consistently higher. Yes super moons, full moons, high tides, rains certainly have a lot to do with these events, but do they have everything to do with it? Certain hurricanes are documented to cause changes to flooding etc indefinitely—as out in the ocean things have shifted. We may not see the shift, but things have changed and it affects us on land…(http://www.livescience.com/24380-hurricane-sandy-status-data.html)
I don’t know, I am just speculating as I see a changes. It’s hard not to wonder when you see see water on the street almost every day…For the past four years our street has flooded consistently for long periods of time. Even with an outfall fixed there are issues. This time our road has been under various levels of water on and off for a couple of months, before the rain event as well. I have been documenting this in photos and emails for our town and for my neighbors.
The first photo in this blog is flood water from a rain event. The rest is river water. Yes river water that has come up through the grates and up through the ground into our neighborhood.
At first I was driving through the water when it was low…then my husband made me hose off the bottom of my car. Not fun. Since then I have gone one block over to Pineapple….So every day I drive one block over to exit my street.
The past couple of days it seems the water is receding, but if you look closely, you can still see it “high” right under the grate. Vegetation in the area will be and is already dying from the salt water. What will happen to the road?
Yes we that live here know where the flood zones are and cannot feign ignorance, nonetheless, this cannot be ignored..My advice? We must start a conversation with the Department of Environmental Protection and all local governments. We must face reality because she is knocking, right at our front door!
This is an excellent article from the Florida Keys shared with me on the subject:
Flooding advice: Learn to cope
BY Charlotte Twine Free Press Staff
KEY LARGO — Residents of Twin Lakes, withstanding 14 days of floods as of press time, have a nickname for their bayside neighborhood, according to Narelle Prew, who has lived on Adams Drive for 20 years.
“We call it Little Venice. On the street, it becomes a canal,” she said.
Twin Lakes isn’t the only Key Largo neighborhood that is currently flooded during the recent spate of higher-than-normal tides.
Emilie Stewart lives on North Blackwell Lane in Stillwright Point. “The water came 7 feet into my driveway. And Sexton Way and Stillwright Way are both totally under, and Center Lane,” she said.
On the 13th day of flooding, Emilie Stewart posted on Facebook a photo of her street completely underwater with the words, “The flood waters are rising!!!! Cannot believe this!”
Some residents are making their frustration public. Frank Garces, who lives in the Twin Lakes neighborhood and bought his house in May, has created a Facebook page called Key Largo Community Swamp.
In the “About” section, it says, “This page is to promote awareness about the long-time, ongoing flooding problem on Shaw Drive, Crane St. and Adams Drive.” Garces has posted many photos showing the conditions he and his neighbors have been living in.
“At the worst, it was over 15 inches,” Garces told the Free Press. “The water is finally starting to recede. I still have to drive through 5 inches of water. It floods when it rains, but that doesn’t concern me — it goes away in two days. This saltwater issue is more of a problem. It turns our street into a canal.”
In Twin Lakes and Stillwright Point, garbage and mail service has been continuous. But residents worry particularly about the damage that the saltwater is doing to their cars.
“People in my neighborhood are driving through the water, and I’m saying, ‘Oh my God,’” Stewart said. “I’m choosing to keep my cars parked. I walk to Winn-Dixie with a backpack for necessities.”
But for people who have to drive to work, the matter is more complicated than simply footing it to the local store. Garces and his wife, Stephanie Russo, have no choice but to drive through the saltwater in front of their home.
“I’ve got a big Ram diesel truck that can do it,” Garces said. “My wife has a two-door coupe that can’t do it. We rented her a truck from Enterprise to use to drive through the water.”
But driving your car through saltwater, which makes most mechanics cringe at the thought, isn’t the only problem from the flooding.
“The mosquitoes are out of control,” said Garces. “The wake from UPS trucks knocks over garbage cans, and garbage floats down the street. I don’t pay taxes to drive my car through canals and put up with stink and mosquitoes and garbage. That’s not right.”
Prew agrees.
“Our whole neighborhood is actually sinking, we were built on a marsh,” she said. “It shouldn’t have been allowed to be built the way it was. The county approved the neighborhood to be built, and the county should maintain it.”
The Free Press asked Monroe County Commissioner Sylvia Murphy to respond to Prew’s comments.
“This is true, it’s an old neighborhood. Yes, we did,” said Murphy, referring to the fact that the county approved the neighborhood. “At least one of the roads in there is a private road, the rest are county.”
Murphy, however, said solutions to the problem are limited.
“We’re surrounded by saltwater. Saltwater is what’s coming up in the street. There is nowhere for the saltwater to go, which is why it’s on the streets,” she said. “The county is not going to pump out the saltwater because there is nowhere to pump it to.”
Taking the high road
But residents question whether the county could raise the roads to prevent the flooding.
“The concern here is that the roads are low,” Garces said.
“Raising the roads would costs millions and millions of dollars,” Murphy said. “And to raise the road blocks water. Where would the water go? The water has to go somewhere, and that’s for the engineers to figure out. Just because you block it doesn’t mean it’s going to sit in the bay. It’s going to come on the land somewhere. And then those people are jeopardized.”
Judith Clarke, engineering director for Monroe County, said permitting and environmental changes present challenges.
“Unfortunately, potential physical modifications that may be made are not simple,” she told the Free Press. “Street grates allow water to drain by gravity, but with sea level rise, the water elevation is above the road and water comes up through some structures rather than draining into them.
“Construction on roads that are directly adjacent to the open water is subject to permitting through South Florida Water Management District and, depending on the proposed course of action, potentially the U.S. Army Corps of Engineers.”
For now, the county appears to be in studying mode.
“The county has embarked on the climate change adaptation study to develop a strategy to address climate change impacts in the county, a part of which is developing a strategy and criteria to adapt county roadways,” Clarke said.
Not a simple process
Rhonda Haag, sustainability director for Monroe County, said the county has been conducting modeling of several areas of the county for the past 18 months to determine what can be expected for saltwater inundation into neighborhoods, to identify potential road segments at risk of sea level rise, and to review the various infrastructure of the county and utilities. This effort is wrapping up in the next two months.
“It does not address how to address the flooding issues, only what are the flooding issues,” she said. “When this information is presented to our commissioners, there will be recommendations for how to proceed for the next steps. It is not a simple process.”
So why is the water lingering so long in these neighborhoods — 14 days as of press time?
“This was an event where the moon, autumnal equinox and weather all converged at one time to create an extremely high tide,” Haag said. “It’s not often the autumnal equinox falls at the same time as a full moon, but this year it did. The moon was also at its perigee, or the closest point to the Earth for the year. Experts were anticipating a somewhat higher tide due to these conditions. However, the storms and hurricane last week also contributed to the issue by driving strong westerly winds into Key Largo, thereby stacking up the water. Instead of the tidal waters receding with the tide, the westerly winds kept pushing the water in. Therefore, when the next high tide arrived, it stacked on the existing water that hadn’t fully receded.”
But some residents of the impacted neighborhoods say flooding there has been getting worse, rare confluence of circumstances or not.
“This time is probably the worst we’ve ever seen it. I don’t recall having this problem 20 years ago. I notice it more now. The last 10 years have been bad,” Prew said.
Haag didn’t dispute that perception.
“The general level of the sea is rising, so this will contribute to more tidal flooding, called ‘nuisance flooding,’ in the future,” said Haag, who added that Key Largo residents have been calling her to complain about flooding.
Clarke said county staff has received calls about flooding from residents in all parts of the county.
On the radar
Island of Key Largo Federation of Homeowners Association President Dottie Moses, who lives in the bayside Sunset Waterways neighborhood, said the concerns about flooding are on her group’s radar. She said the federation is also in a fact-finding phase.
“In the county there is an effort to raise the 35-foot height limit of homes in order to raise the base flood elevation of homes. We are still exploring the situation,” she said. “Traditionally, the federation is against raising the height limit. With the sea level rise, it has become a bigger discussion.
“I haven’t had the chance to ask homeowners how things are going since this incident. I know how things are going on Facebook and in my immediate neighborhood. We’ll be having a general membership meeting [Wednesday, Oct. 14], and I’ll ask how things are going.”
Garces just wants a solution.
“In no way, shape or form, I’m not slamming anyone in particular,” he said. “Rhonda met with us — she drove her car through saltwater to meet with my wife at our house. Judith called my wife. I just want them to come up with a solution for us.”
And, as he noted on day 14, “Water is getting deeper again today.”
For now, Haag recommended that residents help the county’s research.
“Please take photos of the high tidal waters, and email them to me, identifying the date taken and street,” she said. Her email is Haag-Rhonda@MonroeCounty-FL.Gov<mailto:Haag-Rhonda@MonroeCounty-FL.Gov>. “The county is assembling a database of photos of tidal flooding areas that will help us to identify problem areas and therefore plan for the future on how to respond to these areas.”
And as for what flood-area residents should do with their cars, Haag said, “This would be up to each resident.”
Meanwhile, if Murphy were one of those residents, she said, “What I would do is I would park my car on high ground, I would put on a pair of boat shoes, and I would walk home through the water. I sure would not drive my car through the saltwater. I would take off my high heel shoes, put on my boat shoes and get down to it.
Muck from the SLR/IRL region. Muck holds pesticides and other chemical residue. Public photo.
When I got up this morning, I saw a Facebook post by Delta Gamma sorority sister, Katie Schwader. Katie, who runs a page entitled “Love Your Neighbor,” had posted: “As September wraps up, I encourage all to join the Support Peyton McCaughey Facebook page. ” (https://www.facebook.com/PeytonRecovery?fref=ts)
According to TC Palm reporter Paul Ivice: “...the three-bedroom house was fumigated for termites by Terminix in August 2014, but the termites returned. “Under the direction of Terminix, the home was re-tented and fumigated” on Aug. 14 by Sunland…Zythor was used..Sunland didn’t use the proper dosage…and “didn’t properly ventilate what was pumped into the home to kill the termites…”
Now this 10 year old child is “not able to walk, or even lift his own head,” according to Ed Gribben Jr., the brother of mother and Martin County Hight School assistant principal, Lori Ann McCaughey.
Is there any greater nightmare than this? I cannot imagine…We all must support this family.
Family photo of Peyton Mc Caughey as shared on the Facebook page for his families’ fundraiser.
Chemicals and pesticides are very dangerous. And many of them are lurking in our river…
Image from USGA DEP report SLR pesticide contamination, 2003.Cover of USGS/DEP Report, 2003.
High levels of pesticides also exist in areas of our St Lucie River/Indian River Lagoon, and many of us are not even aware of this. Most of the chemicals end up in the sediment or “muck” at the bottom of the river, so even if issues of contamination are addressed, the river bottom remains poisonous.
The following is an excerpt from a the “Water Resources Investigations Report Occurrence and Distribution of Pesticides in the St Lucie River Watershed” prepared by A.C. Lietz, of the US Geological Survey, in cooperation with the Florida Department of Environmental Protection, in 2003. I wonder how much has changed in just over ten years? I could not find a follow-up report.
An excerpt reads:
“The St. Lucie River watershed is a valuable estuarine eco- system and resource in south- central Florida. The watershed has undergone extensive changes over the last century because of anthropogenic activities. These activities have resulted in a complex urban and agricultural drainage network that facilitates the transport of contaminants, including pesticides, to the primary canals and then to the estuary. Historical data indicate that aquatic life criteria for selected pesticides have been exceeded. To address this concern, a reconnaissance was conducted to assess the occurrence and distribution of selected pesticides within the St. Lucie River watershed.” –A.C. Lietz, USGA, 2003
If you take a look at this write-up, you will see the pesticide contamination and locations listed, and the “BMPs,” Best Management Practices, recommended to correct the situation. These pesticides have killed and distorted many fish and other species that used to live at the bottom of this area of the river. As the river bottom remains full of chemicals and grasses can’t grow, many animals and fish never came back. Some that remain have been reported sick and malformed.
The second publication we should all be familiar with is the 1995 DEP report “Pesticide Contamination in 10 Mile Creek” by Gregory A. Graves and Douglas G. Stone. This report is about the agricultural contamination of Ten Mile Creek, the headwaters of the north fork of the St Lucie River, in St Lucie County—- this creek runs south into Martin County. Believe it or not, the North Fork of the St Lucie River is a state designated “aquatic preserve.”
An aquatic preserve! Sometimes things just don’t make sense, do they?
Conclusion from report:
” Fourteen separate pesticides were detected in the water and sediment of Ten Mile Creek, several at concentrations exceeding applicable water quality standards. Some of these concentrations appear to be the highest found anywhere in Florida surface waters (Storet). ….The true scope of the adverse impact upon the resident biota may be underestimated due to unobserved events. Ten Mile Creek is classified by the State of Florida as Class III waters. As such, these waters are presumed suitable for “recreation, propagation. (FAC 62-302.530). The contamination and resultant biological impairment documented constitutes a loss of Class III function for Ten Mile Creek waters.”
(This link below was removed by the Florida Dept of Environmental Protection in 2016. When I asked why they said they were archiving. At least I saved a quote. This info should always be made available to the public JTL)
How was the situation resolved? The report states:
“Several State of Florida biological and chemical water quality standards were violated. Recommendations include application of best management practices (BMP), review of pesticide use within the basin, regional water management and expanded study of the implications of pesticides entering the North Fork St .Lucie River OFW. (Outstanding Florida Waters). A cooperative panel including local agricultural concerns is recommended to resolve this situation with minimal conflict.”
That’s nice they resolved this terrible situation with “minimal conflict,”but I do hope the situation has been resolved; I would like to get my hands on a follow-up report that is easy to access on-line…
Miami-Dade sewage treatment report, photo 2014.Sign in Polk County, public photo.
Years ago when I started trying to learn about the issues facing the St Lucie River/Indian River Lagoon, Gary Roderick, who worked for Martin County, started educating me. One of the first things he shared was the term “biosolids,” or “residuals,” which I learned were other words for “treated sewage leftovers….” or as the state used to call it: “domestic wastewater residuals.”
The state of Florida actually changed the name it used with the public beginning in 2010. Why? Probably because the state would prefer the public doesn’t wish to engage in a conversation about “how it is being fertilized,” and how its waters are being poisoned by the public’s own “poop.”
Perhaps I am exaggerating, but it is worth thinking about….talk about “one big circle!”
To make a long story short, prior to the 1970s, in many cities and counties, sewage went directly into the water–rivers, lakes, and the ocean. In some places this still occurs….However, in the 1970s the federal government passed laws requiring this practice to halt, and states had to change their ways. This is good. But the outcome of this, many years of biosolids’ land application, may have reached a saturation point we can no longer tolerate—- as our waters receive too much nitrogen, phosphorus, and other pollutants as it is.
The other question to seriously consider is: “Does the pressure to get rid of human waste, and any money being made in transportation and application, incentivize the process or skew the law?
Yes, we know the Florida Department of Environmental Protection “checks” this and laws are slowly getting tougher, but does the Dept of Agriculture and DEP really have the good of our state waters at heart or are they more motivated by business?
Internet photo, public. Sewage treatment plant.Public photo biosolids’ land application.
To repeat myself, in case your jaw has dropped, after the EPA’s 1970s requirement, state water treatment plants started beginning the expensive process of adapting their plants, refining the sewage, and creating “fertilizer.” This comes in different forms like AA, and A, and B but that is too confusing to go into right now.
What is important, is that this refined sludge was/is produced, and “cleaned,” (although many metals and prescription drug residuals cannot be removed) and then shipped in trucks to various counties throughout Florida. Sometimes we buy biosolids from other states—then these biosolids, almost 100,000 dry tons a year, are spread on the land to “enrich the soil.”
In fact from what I’m told sometimes land owners are paid to put it on their land. Hmmmm?
I guess we have to get rid of it. This is true. And it is a problem. So much and growning! But where does it go after it is spread on the land? During rain events, it flows right back into our waterways. From Orlando to Lake Okeechobee to us…Kind of a disgusting thought, isn’t it?
Thankfully, since 2013 there is a special protection zone for the watersheds of the St Lucie River/IRL and Lake Okeechobee, but from what I have read, the practice of applying “biosolids” or refined human waste sludge, has not stopped completely. Our waterways are still impacted from upstream by this practice.
So when I really ponder all of this on a personal level, it means I worked tremendously hard with the commission in the Town of Sewall’s Point to pass a fertilizer ordinance in 2010 to protect our rivers, and all the while, the (blank) is just flowing right back in…..
2009 map, the last year made available. Where Class AA biosolids are distributed and manufactured. Key below.(via Gary Roderick, source Biosolids in Fl 2009, DEP 2010.)Key to above.DEP chart breakdown 2014.Public photo of sewage treatment for biosolids.
(7) For application sites located in geographic areas that have been identified by statute or rule of the Department as being subject to restrictions on phosphorus loadings (such as the Everglades Protection Area as set forth in Section 373.4592, F.S., the Lake Okeechobee watershed as set forth in Section 373.4595, F.S., Lake Apopka as set forth in Section 373.461, F.S., and the Green Swamp Area as set forth in Section 380.0551, F.S.), the NMP shall:
(a) Base application rates on the phosphorus needs of the crop; and
(b) Address measures that will be used to minimize or prevent water quality impacts that could result from biosolids application areas to surface waters.
The NMP for a proposed site located within the Lake Okeechobee, St. Lucie River, or Caloosahatchee River watersheds, shall also include the demonstration required by subsections 62-640.400(11) and (12), F.A.C., as applicable. Any permit issued based on such a demonstration shall require monitoring and record keeping to ensure that the demonstration continues to be valid for the duration of the permit. Documentation of compliance with the demonstration shall be submitted as part of the site annual summary submitted under paragraph 62-640.650(5)(d), F.A.C.
Summary of Biosolids Use and Disposal
In 2013, approximately 178,511 dry tons of Class AA biosolids products were distributed and marketed in Florida, approximately 97,880 dry tons of Class B biosolids were land applied to sites in Florida, and an estimated 111,923 dry tons of biosolids were disposed of in landfills. Compared to 2012, this represents a 16 percent decrease in Class AA biosolids products distributed and marketed, a 10 percent decrease in land application, and no change in the quantity of biosolids sent to landfills. Although it would appear there was a decrease in biosolids generated in Florida in 2013, these estimated quantities of biosolids and biosolids products used or disposed by Florida and out-of-state facilities differ from the estimated quantities of raw biosolids generated by Florida facilities. Charts are provided in this report to illustrate these differences. There is no indication the quantity of raw biosolids generated by Florida facilities decreased in 2013.
EPA http://water.epa.gov/polwaste/wastewater/treatment/biosolids/genqa.cfm
3) Why do we have biosolids?
We have biosolids as a result of the wastewater treatment process. Water treatment technology has made our water safer for recreation and seafood harvesting. Thirty years ago, thousands of American cities dumped their raw sewage directly into the nation’s rivers, lakes, and bays. Through regulation of this dumping, local governments now required to treat wastewater and to make the decision whether to recycle biosolids as fertilizer, incinerate it, or bury it in a landfill.
Mr Reginald Waters with black bears killed on Hutchinson Island, around 1930. (Photo credit Sandra Thurlow, Sewall’s Point,” A History of a Peninsular Community on Florida’s Treasure Coast”/Reginald Waters Rice)Photo from my mother: Bill Pitchford’s “last bear.”
A friend of mine, Mrs Mary Chapman, once described Stuart News reporter, Ed Killer, as “the only reporter in America who got her to read the sports page.” I feel the same way. Ed Killer’s past Sunday article entitled: “Bearing Down for the Bear Hunt,” was quite the read, and I have been thinking about it the past few days.
Bears….to think that they used to live right here in along the waters of the St Lucie River and Indian River Lagoon, and now there are none.
Today I thought I’d share a photo I have shared before, but it is certainly worth dusting off and bringing out of the archives again.
The above photos are from my mother’s book, “Sewall’s Point,” and shows Mr Reginald Waters with multiple black bears he killed on Hutchinson Island, a mother and two cubs, around 1918. The other is the “last bear shot on Hutchinson Island, 1926.” Historian, Alice Luckhardt, wrote a comprehensive piece on these black bears that once roamed our region. Here is an excerpt from a recent vignette:
“At one time, Florida black bears existed in fairly large numbers along the ocean coast between Jupiter and Fort Pierce, living in and among the mangroves and feeding on palmetto fruits and turtle eggs buried in the beach sand. However, as more people began settling the area, bears became unwelcome guests, and many were hunted and killed by early pioneers.
By the 1920s and early ’30s there were still a few wild black bears in the area. They found a tasty delight in honey and bee larvae from the numerous beehives in operation on Hutchinson Island at that time.
Jensen resident William Pitchford felt the only solution was to hunt down the bear that had been raiding his bee hives during the summer of 1931. Pitchford first thought to capture the bear using a steel trap he set out over several nights near the hives. The bear, however, was too smart to fall for that trap, avoiding it each night and still getting into the honey, destroying several hives.
Determined to end the bear’s raids, Pitchford, with the assistance of a neighbor, Vincent Wortham Sr., laid in wait one Saturday night, Aug. 8, 1931, with weapons in hand. As hoped, in the darkness of night, the bear appeared and the men turned on their flashlights. Pitchford immediately fired three times using his 303 Savage rifle, and Wortham fired his 32-20 Smith and Wesson revolver twice at the animal. The seriously wounded bear managed to scramble a short distance away before the two men later found him dead near the Pickerton farm. They managed to bring the 200-pound animal back to Jensen where photos documented the event, as this marked the last bear killed on Hutchinson Island.”
So, quite sad as far as I am concerned that we killed all the bears here. Let’s figure out how FWC, the Florida Wildlife Commission, the agency making the laws on bear hunting today “works.” —How do they fit into Florida government? How were they able to determine it is OK to shoot bears this season? For one thing FWC is not “under the governor,” a situation many state agencies would “kill for.” Oh, no pun intended… 🙂
Also, I must state that the structure of the agency is confusing like everything else in government.
There is “US Fish and Wildlife,” a federal agency, and then there is FWC, or the Florida Wildlife Commission, a state agency. One will also hear this same agency referred to as Florida Fish and Wildlife Conservation Commission. Why I am not sure. So Florida Wildlife Commission (FWC) and Florida Fish and Wildlife Conservation Commission (FFWCC) are the same thing. If anyone knows more about this please let me know….
In 2004 the agency, FWC. was restructured by an act of the Florida Legislature:
This excerpt below explains:
“The FWC was established with a headquarter in Tallahassee, the state capital on July 1, 1999 after an amendment to the Florida Constitution approved in 1998. The FWC resulted from a merger between the former offices of the Marine Fisheries Commission, Division of Marine Resources and Division of Law Enforcement of the Florida Department of Environmental Protection (DEP}, and all of the employees and Commissioners of the former Game and Fresh Water Fish Commission.
The Florida Department of Environmental Protection (DEP) serves as the environmental regulatory agency for the state, enforcing environmental legislation regarding air and water quality, for example. In 2004, the Florida Legislature approved a reorganization of the FWC that integrated parts of the Division of Wildlife, Division of Freshwater Fisheries, and the Florida Marine Research Institute to create the ‘Fish and Wildlife Research Institute’ (FWRI) in St. Petersburg, Florida.It has over 600 employees. As of 2014 FWC had over 2,000 full-time employees, maintained the FWRI, five regional offices, and 73 field offices across the state.”
FWC commission 2015Organizational Chart FWC 2015Organizational Chart DEP
Looking at the structure one can see that the commissioners are at the top of FWC chart and the “people” are over the governor for DEP chart….
Hmmmm?
If the bears had a seat at the table, I wonder where they would be?
Black bear sitting at a picnic table, a popular image on Facebook, 2014.
____________________________________
Full note from my historian mother when she sent the “last bear” photo:
“Jacqui, Here is a photograph of Bill Pitchford’s “last bear” that Alice Luckhart wrote about. I have a file on the Waters family who lived in Walton on Indian River Drive. The photograph of Russell Waters with the mother bear and two cubs had “1918” written on it. I am glad Ed Killer’s article explain that hunters will not be allowed to kill a mother with cubs. Reginal Waters Rice who supplied the photograph said his uncle Russell felt very bad about killing “the three bears.” Mom
Sunrise over Florida’s “Waters of the State,” SLR/IRL region.
The more I learn about water, “the more I learn what I don’t know”…Federal laws….state laws…and local governments living with the “sins of the fathers,” —just trying to keep up…
Because I taught eighth and ninth grade for so many years, it is my training to try to break down complicated information, so that it can be understood on a basic level and shared. Obviously, I am no expert on water law so please chime in!
Today’s lesson? CLASSIFICATION OF FLORIDA SURFACE WATERS
Classifications and designated uses of water by the state of Florida are required by the Clean Water Act of the United States. “The act requires that the surface waters of each state be classified according to “designated uses.” Florida has six classes with associated designated uses, which are arranged in order of degree of protection required.” DEP
Classification, Waters of the State, FAQ Fl. Dept. of Environmental Protection, 2012.
Class III Fish Consumption, Recreation, Propagation and Maintenance of a Health, Well-Balanced, Population of Fish and Wildlife
Class III-Limited the same Class III but “with limited physical/habitat conditions…
Class IV Agriculture Water Supplies
Class V Navigation, Utility and Industrial Use.
I wonder what category the St Lucie River/ Indian River Lagoon falls under? This is not easy to find on-line. Let’s guess….Look at the chart above closely….
What do you think?
My guess would be Class III-Limited, but I don’t know. I could not find it “for sure” on-line.
Looking at the chart and reading the DEP website, it sounds like all waters of the state of Florida are “Class III” regular “unless otherwise specified….”
—–Finding a simple list of class designations for waters of the state is not easy. This download is what I found and it does not make sense.
Now to complicate the issue, certain classes of water that are listed as Class III or otherwise can also be listed separately as “Outstanding Waters of the State,” or as “Aquatic Preserves.” How can this be?
—–For instance, the North Fork of the St Lucie River is listed as an “Aquatic Preserve” and “Outstanding Water” of the State. Also the Indian River Lagoon has parts, including parts in St Lucie and Martin Counties, that are also Aquatic Preserves. This doesn’t make sense to me. These bodies of water have been designated as “protected” since the 70s but they are not protected with canals dumping pollution into them. We all see that!
SFWMD canal and basin map.C-24 dumps pollution into North Fork of SLR, C-23 dumps into main area of SLR, C-44 dumps into South Fork, and C-25 into IRL near Ft Pierce. The North Fork of the SLR and parts of the IRL are Aquatic Preserves/and or Outstanding Florida Waters…..this makes no sense.Aquatic Preserves of the IRL as shown in DEP’s IRL Management Plan draft June 2014.
Now I am going to share some photos of the Southern Indian River Lagoon, (an Aquatic Preserve), that my husband, Ed, took last Sunday, September 13th. The photos are of the C-25 canal which is dumping into the Indian River Lagoon in Ft Pierce. I don’t know about you, but I don’t think it makes sense to dump pollution into an aquatic preserve, no matter what class the waters are.
To be fair, I must mention that I recently received an email from Mr Glenn Henderson, the senior grants writer for St Lucie County. He noted that a blog reader sent him the shocking photographs of C-25 recently published. Mr Henderson noted that he and others are working together with the St Lucie Issues Team to get a grant from the state for the San Lucie storm water detention project. The San Lucie is an old subdivision that has dirt roads, few swales and no structures to hold stormwater — and it’s less than a mile from the IRL. This is one of the many things running into the lagoon.
Thank you Glenn and everyone! And the state? “Let’s get back to class!”
Algae fills C-25 as this water is dumped into the IRL in Ft Pierce, an aquatic preserve. (Photo Ed Lippisch 9-13-15)C-25 9-13-15 (EL)C-25 9-13-15 (EL)C-25 9-13-15 (EL)
Fresh water plume flowing past Sailfish Point at St Lucie Inlet 9-3-15. (Ed Lippisch)
Fresh water plumes flowing out of estuaries into the ocean are, of course, noted all over the world. There are even accounts from early Florida pioneers in the 1800s documenting such phenomenon. The difference with the “freshwater plumes” in our area of the St Lucie River/Indian River Lagoon, is that the watershed has been radically altered over time to take on more than its fair share of water and the plumes are not just sediment and organic material but often toxic.
As we are aware, canals C-44, C-23, C-24, and C-25 expanded the watershed of the SLR/IRL by more than five times its God-given capacity, plus in the case of C-44 the overflow waters of Lake Okeechobee. Yes we live in a “swamp.” But our South Florida swamp has been over-drained.
Drainage changes to the SLR. Green is the original watershed. Yellow and pink have been added since ca.1920. (St Lucie River Initiative’s Report to Congress 1994.)
Today I will share photos my husband Ed Lippisch took on September 3rd, and September 7th, 2015, and then contrast then with a few taken in September of 2013 during the “Lost Summer.” My point being, even our rain plumes, like “now,” are not natural to our watershed as the watershed has been expanded so much. Add Lake Okeechobee to it, and a really bad summer like 2013, and the plumes are visibly “different.”
Of course lighting and timing have a lot to do with a photograph.
A photograph is an image in time; it is not necessary “scientific,” but no one can say, a picture doesn’t “speak a thousand words.”
9-3-15 SL Inlet.9-3-15. SL Inlet.9-3-15 Close up freshwater plume exiting SL Inlet.
_______________________________________________
9-7-15 By Over Stuart Harbor looking north towards the North Fork. Plume seeming to be coming from South Fork, C-44. (bottom brown) (Ed Lippisch)Over Rocky Point looking to Sewall’s Point, 9-7-15.SL Inlet near Jupiter Narrow’s opening 9-7-15.Sailfish Flats between Sewall’s Point and Sailfish Point 9-7-15.Sailfish Flats…9-7-15.Sewall’s Point storm approaching, 9-17-15.SLR near Willoughby Creek a polluting outfall into river, water from Airport and surrounding area….This is just on the west side of South Sewall’s Point, 9-7-15.
_______________________________________
Map. Sewall’s Point is the peninsula. Inlet is to east. (Google maps) 2013.Plume in 2013, during the LOST SUMMER along Jupiter Island coming form SLI.C-23, C-24 , C-44 and mostly Lake O.9-13 St Lucie Inlet with plume exiting…JTL C-23, C-23, C-244 and mostly Lake O.Plume in 9-13 coming form C-23, C-24, C-44 and mostly Lake O. (JTL)
Leon Abood served as the chair of the Rivers Coalition for 17 years. (1998-2015)
Today and will share some history, and today I will honor Mr Leon Abood, who has led the Rivers Coalition of Martin County for the past seventeen years…
In 1998 a terrible thing was happening. An uncanny number of fish in the St Lucie River had lesions, and for the very first time, numerous algae blooms were being reported the river. The ACOE and SFWMD had been releasing fresh water from Lake Okeechobee into the estuary for a longer period of time than “typical” due to high rains and high water levels in Lake Okeechobee; this had occurred before, but this time something was different. Really different.
“Fish with lesions? Disgusting. And those poor fish! What’s going on?”
RC handout 2005.
Fishermen were confused and furious; the public was just learning the extent of the problems in their beloved St Lucie River; and real estate agents were desperate because they could not sell houses. All were watching the economic vitality of Martin County and its essential natural system (that brought residents here in the first place) collapse.
The standing motto of the day became: ENOUGH IS ENOUGH!
Agencies as usual declared uncertainty of why the fish were so sickly, everyone looking at everyone else…In time, very quietly, studies did verify that high levels of fresh water in brackish systems allow a bacteria to grow that promotes lesions, as a fish’s delicate slime coat is compromised….It was Lake Okeechobee exacerbated by the other canals….
This is taken into account today before decisions are made…When possible, “pulse releases” became more common rather than giant long-lasting slugs of water into the system….
As far as “the river,” other groups had been fighting for the St Lucie River/Southern Indian River Lagoon since the 1950s, but now it was time for “business!”
In a fit of fury and desperation, the Realtor Association, on May 12th, 1998, formed the “Rivers Coalition.” The group was built from the earlier formed El Nino Task Force and focused on group rather than individual membership.
Founding members in 1998 included the St Lucie River Initiative, the Realtor Association of Martin County; Stuart/Martin Chamber of Commerce; Treasure Coast Builders Association; Martin County Conservation alliance; Economic Council; Florida Oceanographic Society; Marine Industries Association; Audubon of Florida; Audubon of Florida; and the Martin County Farm Bureau.
Leisoned fish St Lucie River, 1998, From FWC, RC files.Photograph of fish from SLR 1998, DEP C-44. See link above to read about this.
Leon has led the coalition through the horrors of fish lesions, toxic algae blooms, releases from Lake Okeechobee and area canals, along with Mr Karl Wickstrom–a law-suit against the federal government, and has been the face and front man of the river for a confused and desperate public. His calm and authoritative demeanor gives people confidence. He is a true leader, calm when surrounded by controversy and sharks at every turn.
Leon’s goal has always been that all stakeholders are to take part: business, environmental, and residential…. and to bring information forward for the public so they can make “logical and intelligent decisions about what is going on.” He has helped achieve this important goal. —And without information and discussion there is no change…
Quote
Since 1998, the Rivers Coalition has grown and evolved but always remained a consistent “voice for the river.” Without the voice the Rivers Coalition, our river situation would not have the statewide recognition and there would not be the pressure on government to fix the problems.
We all know, it is a problem of monumental proportion, TO MOVE WATER SOUTH and not through our estuary, that will take generations. Knowing this, Leon Abood gave the first “go ahead” to support the River Kidz in 2011 so they could one day “take the baton.”
River Kidz listen to Mr Abood at St Lucie Locks and Dam protest of Lake O. 2014.(Photo Darrell Brand)Leon Abood holds map of South Florida. Rally/protest St Lucie Locks and Dam 2103. (Photo Darrell Brand)
Please read more about Leon Abood and the accomplishments of the Rivers Coalition below on Rivers Coalition link.
Leadership for the future will be made soon. Leon will not walk-away until he has given his blessing and guided new leadership. After 17 years of investing heart and soul it’s not as easy as “passing the baton,” and the River Kidz are just a tad too young. We are going to need some leaders just a bit older….:) He has a few in mind…
Why is he leaving?
After 17 years, he is tired. And Leon simply wishes to spend more time with his wife Georgia, a well-known artist; they love to travel to Europe specifically Paris and Italy. What do they say in real estate? In life too, “Time is of the Essence….”
Thank you Leon, you will never be replaced, and you will always be remembered!
Know the Rivers Coalition will have a rebirth with you always at its side.
Today I will try to provide some insights for every day people trying to figure out what a basin management action plan is, why we have one, and how we are doing so far….
Before we begin, we must first note that in 2002 the state of Florida declared the St Lucie River “impaired.” Impaired as in “its health”— with too much nitrogen and phosphorus and other pollutants from fertilizer and other sources that run off agricultural and developed lands…If you want, you can read the 2002 report below.
Today we hear more about BMAPs (Basin Management Action Plans) and TMDLS (Total Maximum Daily Loads) than the original impairment report, but we must be aware that the only reason we have a BMAP is because the river is “impaired.” A BMAP is put in place by the state to “fix” impaired water bodies.
Our Martin County/St Lucie St Lucie River (SLR) impairment is compounded by the fact that the watershed has been heavily altered over the past 100 years. The Everglades Agricultural Area (EAA) south of Lake Okeechobee blocks the natural flow of Lake O. water going south to the Everglades; therefore the “overflow” waters of Lake Okeechobee are released into the St Lucie.
On top of that are canals C-23, C-24, C-25 that go way out west expanding the St Lucie River’s basin, draining parts of Okeechobee and St Lucie counties and even waters of the St John’s River that used to go north once located near Vero! Road runoff, marinas, agriculture, our yards, tributaries, non-functioning septic tanks, and other things all add up to create a pollution cocktail encouraging toxic algae blooms that kill seagrasses and wildlife and lower our property values for the entire area.
According to the St Lucie River Initiative our canals expanded the “flow” into the St Lucie River by as much as five times what Nature intended. See map below. The BMAP doesn’t really deal with this problem; it does not try to reroute these canals, it rather tries to “better the situation” we are in now as far as water inputs.
Drainage changes to the SLR. Green is the original watershed. Yellow and pink have been added since ca.1920. (St Lucie River Initiative’s Report to Congress 1994.)
So with that in mind, let’s get back to the state of Florida’s created Basin Management Action Plans implementing “total maximum daily loads” (TMDLs) for nitrogen and phosphorus. “Everyone” is part of lowering their loads to the river through building projects that help lower loads and implementing Best Management Practices for fertilizer etc…. Everyone in the basin that is. (Not Lake O- They have their own plan). Not everyone is an equal polluter but everyone tries to lower their load.
The stakeholders agreeing to do projects and implement Best Management Practices to lower their inputs are:
Agriculture
City of Fort Pierce
City of Port St. Lucie
City of Stuart
FDOT District
Hobe St. Lucie Conservancy District
Martin County
North St. Lucie River Water Control District (NSLRWCD) 10
Pal Mar WCD
St. Lucie County
Town of Sewall’s Point
Troup-Indiantown WCD
These stakeholders work together with the help of DEP, the Department of Environmental Protection, and others to lower their measured inputs of Nitrogen and Phosphorus into the river over a period of fifteen years, in five-year increments beginning in 2013. The draft report now is just reviewing the first two years of the first five years. We have a long way to go….
This slide of the summary report provides some overall insights. You can see the load originally compared to now and how far they have to go together to achieve the first increment.
DEP chart for SLR BMAP. (Draft 2015)
1.1 Summary of Accomplishments
Table 3 summarizes the projects completed during the second annual BMAP reporting period. These resulted in an estimated reduction of 118,163.3 lbs/yr of TN and 26,998.8 lbs/yr of TP. The reductions are in addition to those projects given credit before BMAP adoption. Therefore, the total reductions to date are 595,952.0 lbs/yr of TN and 157,540.8 lbs/yr of TP, which are greater than the required reductions in the first BMAP iteration of 316,024.2 lbs/yr of TN and 121,250 lbs/yr of TP. These reductions, in addition to those shown as completed in the BMAP, are 56.6% of the required TN reductions and 39.0% of the required TP reductions of the Phase I BMAP.
The progress towards the TMDL TN and TP load reductions in the St. Lucie River and Estuary Basin are shown in Figure 2 and Figure 3, respectively. The first bar in these figures shows the baseline load for stormwater runoff. The second bar shows the current estimated loading with the implementation of projects. The third bar shows the total allocation for stormwater runoff to meet the TMDLs. The line shows the target for the first BMAP iteration. (DRAFT REPORT)
____________________________________
So the St Lucie River BMAP is making “pretty good” progress according to the report. I imagine there is still a lot to improve. It is a process. We are learning….
These programs are definitely a major “participatory decision-making process” to be commended. I cannot imagine what it takes to coordinate this effort! It would be a nightmare actually. I rather just reroute the canals!
In closing we must note the Indian River Lagoon of which the St Lucie River is a tributary, has a BMAP, but it is for the central and northern lagoon not the southern lagoon where we are in Martin County. I don’t quite understand this. The river does not seem healthy in this area either.
Maybe one day soon the southern IRL will soon have its own BMAP too? A very complex process for two very sick rivers…A process we should all try to understand and help with too.(DEP BMAPS http://www.dep.state.fl.us/Water/watersheds/bmap.htm)
Florida BMAPs DEP.Close upList of Florida’s impaired water bodies and BMAPS.
*According to the Department of Environmental Protection: a BMAP is a “blueprint” for restoring impaired waters by reducing pollutant loadings to meet the allowable loadings established in a Total Maximum Daily Load (TMDL). It represents a comprehensive set of strategies–permit limits on wastewater facilities, urban and agricultural best management practices, conservation programs, financial assistance and revenue generating activities, etc.–designed to implement the pollutant reductions established by the TMDL. These broad-based plans are developed with local stakeholders–they rely on local input and local commitment–and they are adopted by Secretarial Order to be enforceable.
*Also for the first five years of the fifteen years the BMAP will take place, the stakeholders are getting extra credit because their SLR BMAP” credit includes storm water management strategies and projects that have been put in place since 2000 or will be implemented during the first five years of implementation June 2013-June 2018).”
I am adding a comment from Dr Gary Goforth to this blog post at 1:00 PM 8-13-15. I think his professional insights are helpful even to the lay person; he did attend the BMAP meeting yesterday; and he is a regular contributor to my blog. Thank you Gary. (http://garygoforth.net)
3-18-15 at 7:17 AM Gary Goforth commented on 2015 Annual Update, St Lucie River and Estuary Basin Management Action Plan, SLR/IRL
Inside cover of the Draft 2015 SLR BMAP Report. I …
Hi Jacqui
I am very familiar with the TMDLs and BMAP for the St. Lucie River Basin. I attended the BMAP progress meeting yesterday along with Mark Perry and others. There were nice updates by Diane Hughes and her counterpart in St Lucie County on construction and operation of what should be good, effective projects for reducing nutrient loads to the St. Lucie River and Estuary. It is clear that local communities and others are working hard to reduce nutrient loading.
However that’s where the good news ended.
While the progress report leads the public to believe that great strides have been made by landowners in cleaning up their stormwater pollution, unfortunately the BMAP process and progress reporting is seriously flawed and present an overly optimistic assessment of the region’s water quality, and the progress made towards achieving the desired endpoint. I expressed this opinion to FDEP, FDACS and SFWMD staff at the meeting yesterday, with the following support:
1. The nutrient loading data in the progress report are not real (measured data), rather they are a combination of potential load reduction estimates superimposed on simulated data. No where in the progress report will you find the observed amount of nitrogen or phosphorus that actually entered the St. Lucie River and Estuary during 2015. As was discussed at the meeting, FDEP does not plan to bring real data into the progress reports until 2017.
a. The real data show a very different story, for example, phosphorus loading from the C-44 Basin (excluding Lake releases) has increased more than 50% from the 1996-2005 Base Period.
b. Until real data are shown, there can be no assessment of how well the BMAP program is working, and no mid-stream corrections will be made.
c. The majority of load reductions are attributed to agricultural land uses as a result of BMPs. However, FDACS and FDEP staff acknowledged that they have not yet documented the actual effectiveness of any ag BMP in the region – they repeatedly stated they were short on staff.
2. The progress report (and the BMAP) ignores the nutrient and sediment load from Lake Okeechobee discharges. In the 2015 reporting period, the assessment ignores over 400,000 pounds of nitrogen and 47,000 pounds of phosphorus that entered the River and Estuary from the Lake. And don’t expect future reports to reflect this loading – the BMAP process will continue to ignore loading from Lake Okeechobee, assuming instead that the Lake will achieve its own TMDL (another sad subject altogether).
3. The nutrient loads for the BMAP base period are not the actual loads that occurred in each of the basins – instead it is a simulated load that differs up to 25 percent from the observed load. Without an accurate base period load, true progress cannot be assessed.
I could go on for a while; I made many more suggestions how to improve the process and will follow up with written comments to the FDEP.
Perhaps the greatest tragedy that is constantly playing out in our declining St Lucie River/Indian River Lagoon is the tremendous sediment infill covering its once white sands, seagrasses, and benthic communities. This began heavily in the 1920s with the connection of the St Lucie Canal (C-44) connecting Lake Okeechobee to the South Fork of the St Lucie River, and then increased in the 1950s and beyond with the construction of canals C-23, C-24 and C-25.
It must also be noted that the St Lucie River/SIRL underwent great changes when the St Lucie Inlet was opened permanently by local pioneers at the encouragement of Capt Henry Sewall in 1892. (Historian, Sandra Henderson Thurlow) Prior to that time, the Southern Indian River Lagoon and St Lucie River had been “fresh” —-fresh and brackish waters and their communities of plants and animals “came and went” with nature’s opening and closing of the “Gilbert’s Bar Inlet” over thousands of years….
Since 1892 the St Lucie River has been a permanent brackish water “estuary…” and until the opening of the St Lucie Canal was teeming with fish and wildlife and considered the “most bio-diverse estuary in North America.” (Gilmore 1974)
Anyway, today we have a very special guest, and one of my favorite people in the world, Dr Gary Goforth, to share with us information on 2015 sediment statistics entering the St Lucie River from C-44, our most damaging canal. (DEP 2001:(http://www.dep.state.fl.us/southeast/ecosum/ecosums/C-44%20Canal%20.pdf)
Dr Goforth recently sent out an email, and I ask him if I could share the information; he agreed. He states:
“The pollutant that has been consistently left out of discussions is the sediment load to the estuaries from Lake Okeechobee – over 2 million pounds to the St. Lucie River and Estuary in 2015 alone; almost 4 million pounds to the Caloosahatchee Estuary.” (Dr Gary Goforth)
Isn’t that awful? “We” are filling the river in….smothering it.
The slides Dr Goforth included are the following:
Flows and loads for the period January 1, 2015-May 31, 2015. (Dr Gary Goforth 2015)
Please click on image above to read the numbers. Mind boggling!
This second and complicated image below shows “flows” into the estuaries from Lake O into the St Lucie, Caloosahatchee, and to the Everglades Agricultural Area. Generally speaking, the Army Corp of Engineers in discussions with the South Florida Water Management District, began releasing into the St Lucie River January 16, 2015 until late May/early June. About 3 weeks ago.
Flows between January 1 and May 31, 2015. All flows in acre feet and subject to revision. (Dr Gary Goforth,, 2015)
Recently our river waters have looked very beautiful and blue near Sewall’s Point and the Southern Indian River Lagoon and water quality reports have been more favorable. Nonetheless the river, especially in the South Fork and wide St Lucie River, is absolutely impaired as there is not much flushing of these areas and the sediment infill is tremendous. The seagrasses around Sewall’s Point and Sailfish remain sparse and algae covered when viewed by airplane. Blue waters does not mean the estuary is not suffering!
Months ago I wrote a blog, that is linked below, focusing on south Sewall’s Point’s river bottom infill history, and depths that have gone from 19, 15, and 14 feet in 1906, to 4, 8, and 7 in 2014—and looking on the Stuart side, north of Hell’s Gate, the 1906 map shows 10, 8 and 12 feet and a 2014 NOAA map reads 2; 3; and 4 feet!
Insane….so many changes!
Our government has filled and dredged our precious river…elements of this inputting sediment become MUCK…..
I’ll end with this:
The River Kidz say it best, although my mother didn’t approve of the tone: 🙂
River Kidz “Get the Muck Out” campaign, 2014.
__________________________________________
For interest, I am going to include two more images Dr Goforth included in his email on sediment loading; please click on image to see details.
Thank you Dr Gary Goforth for sharing you expertise on the science of the St Lucie River/Indian River Lagoon, Lake Okeechobee and Everglades. Please check out Dr Goforth’s website here:((http://garygoforth.net))
Lake Releases to the South. (Dr Gary Goforth, 2015)Lake Releases to STAs (Storm Water Treatment Areas) (Dr Gary Goforth, 2015)
Anyway, today I will once again to try to boil-down some fancy government terms to help you understand what our state is doing to try to fix the “impaired waters of the state…” such as our St Lucie River and Indian River Lagoon. I will focus on a report about “what is impeding its progress.” This report will be discussed at the Treasure Coast Regional Planning Council on 6-19-15.
“Impediments to Implementation of the Indian River Lagoon Basin Management Action Plans” by the East Central Florida Regional Planning Council and the Treasure Coast Regional Planning Council was prepared with technical assistance from the Florida Department of Economic Opportunity, 5-27-15.
For a full copy of this report please contact Mr Michael Busha at mbusha@tcrpc.org
Here we go:
The Background section of the report notes:” …In the past century the IRL has been affected by many activities including the creation of inlets, dredging of navigational channels, impoundment of mangroves for mosquito control, shoreline development, and alteration of the watershed basins draining into the lagoon. Today water quality the single most important issue impacting the lagoon. The decline in water quality is attributed to an increase in nutrient input, sedimentation, turbidity, atmospheric deposition, nutrient releases from legacy muck deposits, and changes in salinity due to freshwater discharges. The issue is complex because the impact comes from a variety of sources, including non point sources of stromwater entering the lagoon through major canals systems as well as through smaller creeks, tributaries, and individual outfall structures.”
State BMAP 2015. TCRPC
Here I must state something not noted in the report in case you don’t know: Not until a water body is declared as “impaired” does it get the help of the state creating a Basin Management Action Plan through the implementation of TMDLs—-or the determination of Total Maximum Daily Loads.
I wrote something in the past about this and likened a “total maximum daily load” to a “maximum daily allowance of cigarettes that one is allowed to smoke before one gets cancer…..a “total daily maximum daily load” of phosphorus and or nitrogen is what the government is talking about with the river. How much it can take before it gets sick/impaired.
Phosphorus and nitrogen come from different sources; I always note fertilizer as an example because it is written right there on the bag, and fertilizer from farming and people’s yards is a huge source of the LOAD of phosphorus and nitrogen going into our St Lucie River/Indian River Lagoon….
Right now all our water bodies get too much nutrient pollution (too many cigarettes) so now the government is figuring out how to cut back slowly over time….the problem is the river may die while we are “trying to kick the habit…”
Now, back to the official document: There are currently 20 adopted BMAPs in Florida. Portions of the IRL are addressed by four of the adopted BMAPs. They are North IRL; Banana River: Central IRL; St Lucie River and Estuary.
IRL BMAPs 2015.
Each plan varies but has the same goal: to lessen nutrient pollution, to improve water quality, and whether the plan says it or not, to increase sea grasses….The plans outline specific project that are expected to provide load reductions of phosphorus and nitrogen. All plans are implemented in 5 year periods spread out over 15 years. Plans can be many things, turning dirt, holding water, implementing best management practices not to allow runoff….
Polluted runoff causes impairment…
The St Lucie River was determined as “impaired” in 2002. (Report at end of blog.)
The SLR/IRL BMAP was adopted in 2013. So to figure out how this plan will work….in 2018 the state will have a goal for load reduction; then again in 2023; and then again in 2028. Each time period the load numbers should be going down, and if they are not, cities, counties, and other stakeholders, like agriculture, and other polluters, should be in trouble if there is not a reduction in loads. DEP oversees all of this.
Kind of confusing isn’t it? And I am not sure my dates are correct, but hopefully you get the idea….Perfect science? No. But at least there is a plan…I just wish they’d get us off the cigarettes faster. Like make us go “cold turkey.”
The report list the following impediments the BMAPs.
1. Inadequate Funding….
2. Nutrient Load from Muck not Addressed. (Muck holds nutrients so when it get stirred up from winds or storms it is “re-released…” (Second hand smoke….)
3. Nutrient Loads from ground water are not being addressed. (Groundwater comes up from the ground as tides rise and bring nutrients like from septic tanks into the river and lagoon—gross.)
4. No Incentive for Stormwater Management. I am not really sure about this one but obviously it has to do with incentives; seems like the government could help create incentives if we would reward clean water….(inventions, lessen people’s taxes if they achieve clean water “loads.”) Hey doesn’t the Dept of Economic Opportunity do stuff like this?
5. Incomplete water quality data. Collecting data is expensive. Maybe high school kids could get credit if they did it…..and let’s face it: WE KNOW the WATER’S DIRTY. Focus on the source and stop acting like we don’t know where all this nutrient pollution is coming from!
6. Inadequate Water Quality Monitoring. Same thing as above. Figure it out. Guess….
7. Unequal treatment of public and private entities, agriculture, and water control. This is complicated, but basically in my opinion the Right to Farm Act puts less stringent standards on agriculture to prove they are lessening loads than on municipalities and counties. BMPs vs NPDS (Best Management Practices vs. National Pollutant Discharge Elimination System…)This is a huge problem. Ag has to enter the 21st century. All ag. Best Management Practices are “voluntary.” This is not enough!
8. Onerous conditions attached to BMAP projects
9. Inadequate technology to meet TMDL goals
10. BMAPS are based on flawed TMDLs
11. Trends in nutrient loading from atmosphere not being considered. (Phosphorus and nitrogen come in from rains and winds from as far away as the Europe, Africa and other nations polluting too…
12. Legacy Loading in Lake Okeechobee. THIS IS MY FAVORITE. How can surrounding governments and stakeholders be held responsible for lowering loads when periodic releases from Lake O through the C-44 canal pollute the water as fast as we can clean it up? For instance this year the ACOE and SFWMD have released into the estuary since January 16th and just stopped three weeks ago…MAJOR SECOND HAND SMOKE!!!!!!
13. Lack of Operations Monitoring
14. Load allocation process is not consistent between BMAPs. This has to do with undeveloped land being removed from the maps as nutrient reductions are not required on those lands…
There is a lot more to the report but that is a summary.
This whole process of BMAPS and TMDLs is confusing, but I wanted to at least give you an idea of the report. We must remember not to be too negative for the state workers implementing the BMAP. Negativity will not inspire more work, it will inspire less. Also it is not their fault. Fault lies in leadership.
Rather that telling businesses, citizens, and most of all agriculture to QUIT SMOKING, leadership —-and this is going back many years and includes Democrats and Republicans—is basically paying for our rehab over a period of 15 to 35 years.
Florida’s waters do not have time for rehab. They must be fixed today. Tough love is really the only answer.
Image created of structure S-80 along C-44 canal. ACOE web cam and Doc Snook, 2013.Ca. 1920s, looking west one sees the straight C-44 canal then known as the St Lucie Canal, and its connection to the South Fork of the St Lucie River. (Aerial Thurlow Archives)Looking west towards Lake Okeechobee above the C-44 canal over S-80 structure, St Lucie Locks and Dam, connecting Lake Okeechobee to the South Fork of the St Lucie River. (Photo Jacqui Thurlow-Lippisch and Ed Lippisch, 2013.)
I share a video today that I believe to be my most “insightful” blog post since I began writing in 2013. The video above by my brother, Todd, who is an expert in historic map overlays merged with images from today’s Google Earth, communicates and educates in a manner no one map or document could do independently.
The video’s journey shows exactly where the C-44 canal was connected to the South Fork of the St Lucie River. An historic Hanson Grant map reveals the “Halpatiokee River, meaning “alligator river;” with a basis in multiple Indian languages. Because the St Lucie Inlet was not opened, the forks and river were “fresh,” thus alligators lived there. Then flying over a 1910 plat map of St Lucie Inlet Farms, you will see the South Fork of the St Lucie River mapped out. As the image changes over “time” you will see the construction of the C-44 canal, and how it was built right through the middle of South Fork’s north-western prong. In fact, those prongs today on the northerly side, are “gone” as sections 32 and 33 show. Those lands today are agriculture fields. As the journey continues, in the developed areas of St Lucie Farms you will see a very large lake “disappear” near section 25. I find all of this fascinating and kind of depressing… My brother said it best: “Wealth created at the expense of the environment…” Maybe we could create more wealth today going in the opposite direction?
The canal was built by the Everglades Flood Control District and later the Army Corp of Engineers, at the request of the state of Florida and Stuart Chamber of Commerce head Capt. Stanley Kitching and other “leaders.” (From conversation with historian Sandra Thurlow).
According to the Department of Environmental Protection’s Eco-Summary from 2000, the C-44 canal was begun in 1916 and completed in 1924. The document states:
“Next to the permanent opening of the St Lucie Inlet which changed the St Lucie River from a freshwater river to a brackish estuary, the construction of the C-44 has had the greatest impact on the St Lucie Estuary….Records show people have been complaining since the 1950s and there are numerous problem associated with the C-44 Canal…
UThe article discusses the prevalence of fish lesions due to too much fresh water, sediment smothering benthic communities, seagrass destruction, and the continued heavy nutrient and pesticide loading from agriculture and development in light of a tremendously enlarged basin coupled with massive periodic releases from Lake Okeechobee. (http://www.dep.state.fl.us/southeast/ecosum/ecosums/C-44%20Canal%20.pdf)
The DEP Eco Summary also states: The canal..“was originally designed to enter Manatee Pocket instead of the South Fork of the St Lucie River. ”
Hmmm?
IInteresting isn’t it… to ponder what would have been different if the canal had gone through the Manatee Pocket instead? Certainly the St Lucie River would have been spared but the Pocket, near shore reefs, and inlet surrounding perhaps full of even more contaminated silt and high impact nutrients. Best of all the canal would have never been built but that reality we cannot change…or can we?
Most important today is to know where we have come from so we can redirect where we are. Please take a look at the very short video, put your thinking cap on, and let’s get the state, federal and local governments delivering on what they have documented as problematic for Florida’s waters since the 1970s. Only the people will change this problem, not the government.
Left side of map shows C-44 canal’s abrupt diversion north towards a branch of the South Fork of the SLR. Original plans had the canal continuing its easterly direction to connect with the Manatee Pocket. (DEP Eco Summary/Google Maps 2015.)Another aerial, ca 1920s, looking at the area of connection of C-44 and South Fork. (Thurlow Archives.)
If there is one thing I have learned in my seven-year stint in local government, it is that for the public, the structure of government and how it works is unclear. In my opinion, this happens due to many reasons, but first and foremost is because government as a whole is terrible at being open and explaining itself, perhaps preferring to function behind a shroud of confusion. Also, governments’ sense of responsibility to communicate with the public is often nonexistent or skewed at best… plus communicating is expensive…This situation is compounded by the fact that every year there are new laws, and every few years new elected officials coming in….so the public is constantly having to “catch up.”
To make a point, let me give a simple example from the Town of Sewall’s Point, where I live and am a town commissioner. Prior to 2006 the town did not have a full-time town manager. In 2006 the town charter was amended by the commission creating a manager/commission form of government as opposed to commissioners being in charge of different departments. I was elected in 2008. For years, many citizens did not know this change had occurred, and their expectations were functioning off the old system and their expectations were not met. They came into the commission meetings very upset. The town did not “advertise” the charter changes. I was too new to really understand what was going on….it took me a year or so to figure it out, and the public—
People are too busy trying to live their lives, raise their children, and “put bread on the table,” to follow every move of government be it local, state or federal. Add to this that government itself is a terrible communicator, and what happens? The mechanisms are not in place for government to work….This is how I see it anyway. The answer? Better communication and learning to understand how things work.
A few months ago when the South Florida Water Management District was ignoring a desperate and pleading public that had come before them begging for the purchase of the US Sugar Option Lands through Amendment 1 monies, to help save the St Lucie River/Indian River Lagoon and Calooshatchee, I drove to West Palm Beach and met with high level officials. They were very nice but it was a frustrating meeting. Basically I asked them, “What are you doing?” “Why are you acting like this?”
The answer?
“Commissioner, you know the power isn’t in our hands anymore anyway…”
“What do you mean?” I inquired.
A conversation around the table ensured:
SFWMD: “Well after the debacle that occurred 2008-2010 with then Governor Charlie Christ, the recession, and the attempted buyout of all of US Sugar’s lands, basically a water district was trying to purchase a corporation…..the Florida Legislature got fed up. So later, in section 373.556 of Florida Statutes, the Florida Legislature made sure the District would never be in a position to do that again….Significant legislative changes have occurred related to water management budgeting with substantial ramification for Water Management District land transactions. In 2013, Senate Bill 1986 provided that certain District land transaction should be subject to the scrutiny of the Legislative Budget Commission. As this bill renewed the authority of the Governor to approve or disapprove the SFWMD budget, as with all water management budgets of the state, we can no longer do things we have done in the past like oversee giant land purchases using the monies from our ad-valorem taxes…There is a lot more to it but that’s the main difference now. You are talking to the wrong people….”
I stood there just staring…..”I didn’t know this gentlemen, so how do you expect the public to know this ? Are you telling me, the SFWMD has no power to purchase those Sugar Lands?”
“I am telling you the legislature is in charge of the budget and we don’t have enough money to buy the lands, and couldn’t without their approval….”
“So why don’t you explain that to the public?” I asked.
Stares….
Long awkward silence….
The reply was more or less: “It’s best not to get involved in such a discussion…..”
I lectured them on the importance of communication and education and said they certainly still have influence even if they say they “do not” …..but this did go over particularly well… the meeting ended. I shook their hands. I felt like an idiot. I drove home.
Since that time I have been trying to learn more…..So I read about the history of the Water Management Districts in Florida.
Florida’s five water managements districts map DEP.
To me it seems that originally when the water management districts were created in the 1970s they were allowed to levy taxes from the public in order to be an independent entity of water knowledgeable citizens advising the governor as to how best manage water resources. Also, the Dept of Environmental Protection was just evolving at this time so when the water districts were formed they did not work “under” or “beside” the DEP like today.
Over time, the laws have changed and our water management districts have become an arm of the governor and his or her people in the state legislature. The SFWMD is and has been losing its power. Especially since 2013. This loss of influence has politicized the structure of Florida’s water management districts to a level that “the people” no longer have a voice locally with their districts, and they don’t know they are now expected to go to their state legislature; and even if they did, their local delegation is one in hundreds in that structure that would need to be convinced to change water policy (for land purchase south of Lake Okeechobee for the health of the estuaries, for instance.)
I have learned too through this journey that really today about ten people run our state: Right now it is our governor, Rick Scott: cabinet members, Adam Putnam, Dept of Agriculture; Pam Bondi, Attorney General; Jeff Atwater, Chief Financial Officer; “leadership,” Speaker of the House: Steve Crisafulli; President of the Senate, Andy Gardiner; and the committee heads of the senate and the house which are only a few “tapped” people. (People who have agreed to conform or are smart enough to walk the razors’ edge.)”Leadership” keeps all elected officials in line by allowing them, or not allowing them, to be on, or to chair, certain committees, or by allowing, or not allowing their bills “to be heard”… also by discouraging new candidates from running for office if this is against “leaderships’ master-plan.” This behavior is worse in the republican party than the democratic party, but they are all encouraging conformity rather than leadership.
So how can we best communicate with our government?
Hmmmm?
Let’s keep educating ourselves, and can anyone say “revolution?”
Become a toxic algae detective!Dirty Water Kills. River Kidz art archives.DEP Algal bloom report to agencies and elected officials. (5-18-15, DEP 2015)
WRITTEN FOR THE RIVER KIDZ, but FOR ADULTS TOO!
I do love government, or I wouldn’t be involved in it, nonetheless, it has many faults. One of its greatest, in my opinion, is making information easy and accessible to the public. Whether this is a strategy, or just a failure of most government-systems, is up for debate.
Anyway, today, in the world of “government information on toxic algae,” I wanted to cut through the plethora of information found layers-down-inside-websites you probably don’t even know about and share are few links in case you have any interest in becoming a toxic algae detective. I believe through documenting toxic algae blooms, we will eventually be able to trace them back to their owners….those who dump high levels of nutrients into our waterways while fertilizing their fields and lawns, either not using “high-standard best management practices” or simply just not really caring about water quality like they should….
River Kidz toxic algae deceives track down algae blooms and report them. (River Kidz art)
HOW TO BECOME A TOXIC ALGAE DETECTIVE
Tell your parents what you want to do….. 🙂 Then—-
1. Be on the lookout flourescnent green in the water. But it could be also brown, red, or blue yucky or strange looking water, usually in found during summer when its hot.
2. If you see something suspicious, take a photograph on your phone and post it to the River Kidz or Rivers Coalition Facebook pages or my Facebook page; these pages are public.
3. Don’t touch it! It could be toxic!
4. Because you are dealing with “old people,” its best to call, not text…. 🙂 It’s worth it!
For local documentation call Dr. Vincent Ecomio at Florida Oeanographic: 772-225-0505 or email him at vencomio@floridaocean.org. Be sure to tell whoever answers the phone how important it is that they take a message, documenting your name, detailed location of bloom, your phone, and email address. Ask for someone to call you back and tell you what the level of toxicity was, if it was, after a sample is taken and tested by the state. Ask if they can help you to interpret the data. Write down your findings. Keep a record. (http://www.floridaocean.org)
5. For state documentation, call the Department of Environmental Protection too. Trying to find the right number to call is like trying to find a needle in a haystack so let’s use one in nearby Ft Pierce: 772-467-5500.
6. Wait for a call back if you leave a message…again, tell your parents what you are doing.
7. If no one calls you back in two hours, call again and repeat the process. Once they talk to you, ask how you can find out how the testing went for the bloom to find out how toxic it was…
8. Go back and check on the bloom; report and post your findings. Did it move? Change color? What do you think could have caused this? Go on line and read about what can happen to algae blooms over time.
Maybe you want to start your own neighborhood website? Or share your clues and findings with at school or a community meeting? Whatever you do—-
NOW YOU ARE NOW A TOXIC ALGAE DETECTIVE! Pat yourself on the back. You are helping to create a better water future for our St Lucie River/Indian River Lagoon!
The links below are very helpful.
The first one is from the Florida Department of Health and is informational. The second allows you to trace the history of blooms reported anywhere in the state. Just enter “St Lucie River…” The third is a DEP informational piece that in my opinion “waters down” toxic algae blooms and their sources, but does provide excellent information and contact numbers.
Congratulations, thanks again for helping to save our river, for us, the fish, the birds, and the animals; hope to see you detectives on the water!
Artist Julia Kelly’s beautiful artwork in the River Kidz workbooks features the animals of the SLR/IRL staring Marty the Manatee, 2014/15.River Kidz art archives.
Toxic algae bloom at the gates of S-308 Port Mayaca, Lake Okeechobee, 4-28-15.(JTL)
The word is out. There have been sightings of bright green, toxic-looking algae in Palm City, just two weeks after the Army Corp of Engineers, with the blessing of state agencies, began releasing toxic waters from Lake Okeechobee. Such has been the fate for many years for our St Lucie River/Indian River Lagoon, but now we’re “on it.”
As we continue to document this issue, we can draw the line on abuses from Lake Okeechobee, and promote change within the law.
What is the procedure for our government to “dump toxic algae” anyway?
Well, at this point according to my research, the process goes something like this:
–the South Florida Water Management District test water quality at various locations in Lake Okeechobee; if they see a substantial algae bloom, they contact the Department of Environmental Protection, DEP, a state agency, who then test for toxins; if the bloom is toxic, the DEP then contacts the Florida Department of Health who together with DEP is responsible for communicating with others such as the Florida Wildlife Commission, local governments, the public and the Army Corp of Engineers. Then if the bloom is not too much of a health hazard…the blessing is given to the ACOE to dump.
How quaint…what teamwork, don’t you think?
I think our state and federal agencies have dumped many times with out us really understanding what was happening and we thought the algae was coming just from our own watershed….certainly the problems of our own, over-enlarged watershed exacerbate the situation, but there is no question the microcystis species of algae comes from the lake and that the lake has poisoned our estuary over the years so the bacteria/algae is latent in the fresher areas of our river now, at all times….
Anyway, as we have seen this round of releases, the ACOE and the state agencies decided on May 1st to release the toxic algae into the St Lucie River even after a call regarding the toxic algae from Senator Joe Negron, and inquiries from Congressman Patrick Murphy’s office. After great study, and determining the bloom was toxic, but not “too toxic,” the various state agencies determined the salinity in the St Lucie River would “break up the bloom,” a freshwater bloom known as microcystis that can only grow in the lake. So then the ACOE opened the gates.
For two weeks the fresh waters of Lake Okeechobee have flowed through S-308 and S-80 into the C-44 canal into the St Lucie River….
S-80 at St Lucie Locks and Dam, photo by Dr Scott Kunhs, 2013.
And as our estuary becomes fresh, losing salinity due to these freshwater releases, the microcystis species of algae can now grow and reproduce in the river. In 2013, the river was so fresh that even at the Crossroads of the St Lucie River/Indian River Lagoon, off of south Sewall’s Point, toxic microcystis blooms blossomed from shore to 40 feet off the peninsula– a peninsula that basically sits inside the mouth of the St Lucie Inlet!
We must remember as mad as we are, not to kill the messenger….
Our state and federal agencies are the “messenger,” as well as the “executioner,” in this scenario. The guiltily who created this poison water of Lake Okeechobee, and how they are protected is a story for another blog, and one we all actually know quite well.
Kenny Hinkle’s photo of toxic algae near S-308 in lake Okeechobee 4-24-15.Algae photo shared on Facebook, Rivers Coalition, Diana Pegrum, Palm City 5-18-15.Photo Ch 12 reporter Jana Eschbach shared on Facebook 5-18-15.
You work for the State of Florida? That’s great! “Smile and don’t say a word…”
The Department of Environmental Protection, the South Florida Water Management District, Departments of Health,—less so, the Florida Fish and Wildlife Commission….Afraid to speak?
Yes, and to a degree, it has probably always “been this way,” but right now, based on what I’m learning, I believe, it’s the worst it’s ever been.
My feeling now is that many wonderful employees who work for our Florida state agencies, —many historically the “best in the world,” have “gone mum” feeling that in order to survive, or to fit in, to keep their jobs, or positions, they have to remain “quiet and happy.”
The recent climate change debacle in the national and state media is just the tip of the iceberg.
Iceberg image, public photo.
All things start with leadership–with a tone that is set from “above–” This is true whether it be a family or a state agency. In Florida all state agencies are directly answering to the governor, Governor Rick Scott.
I met Rick Scott face to face in 2014. I have to say I liked him. I liked him for coming to Stuart to see our toxic, polluted St Lucie River/Indian River Lagoon. I liked him for sitting on the couch with me at Kevin Power’s house, of the SFWMD Governing Board. I liked that he used a Sharpie blue pen to take notes on a yellow legal pad, and I have taken to signing many documents with a Sharpie as well. (It makes your name stand out…) I do appreciate the great effort that has been made to connect with local leaders and the monies towards area canal runoff for the C-44 STA/Reservoir… but I would be remiss if I did not say that “something is wrong.” Something is terribly wrong when people say they feel stifled, when people feel hand-cuffed, when people feel threatened.
This is as un-American as communism or socialism.
American flag.
The red on our flag stands for the blood that was shed to extract tyranny. There must be a moral code to allow people to speak, to allow the agencies to advise. It is well-known that the golden area of conservation in the state of Florida occurred under both democrats and republicans in the 1970s and 80s when governors allowed talented, educated scientists and specialists to ADVISE and speak. Ofcouse there were “politics” but there was most definitely more freedom than today.
For example, two weeks ago, after 80 people signed up to speak on behalf of getting on the agenda the possibility to buy US option land south of Lake Okeechobee, the Governing Board of the South Florida Water Management District did not say one word. Not the scientists. Not the board. Not leadership.
Another state agency, the Department of Environmental Protection, you would think would be documenting the destruction of our St Lucie River by Lake Okeechobee, was so “gutted” in 2010, that basically their reef protection programs are now funded and run by a federal agency, NOAA. It’s hard for DEP to say a word I am learning because basically no one is around….and yeah, isn’t it the SFWMD that’s been given the job to document the dying seagrasses anyway? No report lately? I wonder why….
Supposedly, if were not for NOAA, the state of Florida probably would not have a Department of Environmental Protection. —-YES. The 2008 Financial Crisis ….I get it. I lived it as a small town commissioner in south Florida. It was scary, but we did not fall over the edge of the cliff, almost, but we didn’t. Money is slowly coming back into the system. But many agency scientists and leaders are still “scared” as under the Scott administration they watched their friends get fired and years of work and institutionalized knowledge get wiped off the map like toy soldiers swiped off a dining-room table. Could it happen again? Absolutely. A precedent was set….OFF WITH THEIR HEADS!
It is time for the governor’s office and those of traditional power and influence, who are running the show behind the curtain, the agriculture community and some water utilities, to look at our flag, and to remember that we are American, and that we are a state tied to the values of our forefathers, and that no government shall abridge the freedom of speech. That tyranny is repugnant….
Whether the chains are seen or unseen, they are chains…
“Smile, don’t enforce protections, and don’t say a word…”
It is also time for state employees to recall that in 1992 Public Employees for Environmental Responsibility, (PEER), was formed. PEER is a non-profit service organization with the goal to protect local, state, and federal government employees “committed to upholding the public trust through responsible management of the nation’s environmental and natural resources.”
PEER objectives include:
-Organizing a support base of employees from public sector resource management agencies, retired public employees, and private citizens.
-Monitoring local, state, and national resource-management agencies in an effort to defend the environment for the public interest.
-Informing the federal and state administrations, politicians, media, and the public about crucial environmental issues.
-Defending public sector “whistle-blowers,” and striving to strengthen their legal rights in regards to environmental issues.
-Providing free legal assistance to “whistle-blowers” and others when necessary.
Reenactment of canon fire at the Castillo, St Augustine, 2015. (Photo Ed Lippisch)Flying north at convergence of SLR/IRL at St Lucie Inlet. Brown polluted-sediment water of Lake Okeechobee fills the estuary turning a usually blue/green area dark brown. (Photo Jacqui Thurlow-Lippisch, 3-18-15.)Standing at the St Augustine Bridge over the Matnazas River. (Photo Ed Lippisch 2015)
My photos of dark waters of the St Lucie River/Indian River Lagoon were taken on Wednesday, 3-18-15 as my husband, Ed, flew us to St Augustine for a Thurlow Family trip my mother organized, in “America’s oldest city.”
Seeing the destructive view of the discharges on our way north was not a good visual, but before we’d left St Augustine, I had learned that their river, very much like the Indian River Lagoon, is named “The Matanzas” meaning “River of Slaughter” in memory of Spain’s Don Pedro Menendez ‘ and his men’s decapitation of the shipwrecked colony of French Huguenots in 1565. During the massacre, the river “ran with blood…” (http://en.wikipedia.org/wiki/Matanzas_River)
Today our river runs with death as well, albeit a different kind…but we do not live in an age where if you are trying to displace someone, or don’t support their belief system, you chop their heads off….So what then can we do other than try to entice our dear government, to purchase land south of Lake Okeechobee to store, clean and convey water south the Everglades?
We can ask them to “document” what is happening….That sounds reasonable.
I have been reading the book: “Conservation in Florida, It’s History and Heros” by Gary L. White. Originally “the Department of Natural Resources,” the precursor to today’s Department of Environmental Protection, did what it could to protect resources rather just be in charge of permits to destroy such.
I think until the Department of Environmental Protection removes the word “protection” from its name, it still has an obligation to “protect” which also means to “document.”
Seagrasses—fish species—-coral reefs and fish species–oysters—-marine mammals—birds—-aquatic plants——–all that is being lost….
It’s pathetic that the agency is not doing this already. Documenting loss forces state and federal agencies to “do something.” Otherwise, the destruction just continues and everyone “forgets” life was ever there. We owe this to future generations if nothing else.
If you agree, would you please contact the “Department’s” new Secretary, who is a cabinet member of Governor Scott. Please ask him if the agency could document what is happening here is the St Lucie River/Indian River Lagoon or maybe “protect” it in some way since that word it is still in their name….
Jonathan P. Steverson DEP Secretary: 850-245-2011. Mr Tom Frick is in charge of Environmental Restoration for our part of the state; his number 850-245-7518. (http://www.dep.state.fl.us)
In the St Lucie/Indian River Lagoon area, several “protected areas” are now bing impacted, including two “state aquatic preserves:”
“1. The Indian River Lagoon National Estuary,” running from south of Ft Pierce to Jupiter Inlet that is a National Oceanic and Atmospheric Administration (NOAA,) as well as an Environmental Protection Agency, (EPA,) “Essential Fish Habitat for Seagrass.” 2. Another area being impacted by the Lake Okeechobee discharges is the “St Lucie Inlet State Preserve Reefs, and Nearshore Reefs” nominated by NOAA for “National Marine Sanctuary Designation.”
The SLR/SIRL estuary,coastal-ecosystem and habitat has been documented by Dr Grant Gilmore, formerly of Harbor Branch, and others to be “the most bio diverse estuary in North America with habitat for more than 4,000 species of plants and animals, including 36 endangered and threatened species.”
–Where is the protection for these areas? Where are the agencies that are charged with enforcing these protections?
2. IRL and SLR converge at Crossroads by St Lucie Inlet then IRL runs north between starting at Sailfish Point and Sewall’s Point. This area has been documented as the most bio diverse marine environment in North America.3. Sailfish Point4. Sailfish Flats5. Sailfish Flats6. Jensen Beach Bridge
My nieces look over the Matanzas River from the Lighthouse in St Augustine. (Photo Jenny Flaugh 2015) .
Confluence of St Lucie River/Indian River Lagoon between Sewall’s Point and Sailfish Point, Hutchinson Island, “The Crossroads,” 3-8-15 showing releases from Lake Okeechobee and area canals. (Photo Ed Lippisch)
Usually, my husband, Ed, does not like it when I ask him to “do things”…like take out the trash or blow leaves off the driveway. But he always likes it if I ask him to go up in the plane. He did so yesterday, and was able to visually document the polluted discharges pouring into our St Lucie River/Indian River Lagoon.
Yes, once again.
The Army Corp of Engineers (ACOE), and the South Florida Water Management District (SFWMD) agreed to have the Army Corp start releases this year on January 16, 2015 at 200 cubic feet per second (cfs) through S-308 into the C-44 canal which is attached to the South Fork of the St Lucie River, and then in turn is connected to the Indian River Lagoon “my town,” Sewall’s Point.
Exhausting isn’t it?
The ACOE is now discharging at a rate of “950 cfs.” This rate goes up and down. It is going up because Lake Okeechobee is not going down…
This SFWMD basin map also shows S-308 at Lake O, the C-44 canal, S-80 at St Lucie Locks and Dam, SLR/IRL.
Today I will share Ed’s photos and show how to “see” how much the ACOE is releasing at S-308. (Structure 308) which is located at Port Mayaca, in Indiantown, Martin County.
Ofcouse, there are discharges from area canals C-44, C-23, C-24 and C-25 as well, but today for simplicity’s sake, I will focus on the lake discharges today, which in my opinion, are the worst of all anyway—because they are not at all “ours.”
So—–
You can search “Jacksonville, ACOE” or just go to this link: (http://w3.saj.usace.army.mil/h2o/reports.htm). You can then very quickly check two things: Lake Okeechobee’s level and how much the ACOE is dumping at S-308 from the lake.
To do so, after accessing the site, go to “Current Lake Okeechobee Water Level” at the top left: Always one day behind or so, the latest date reported is 3-7-15– Lake O is at 14.71 feet. Then go back to the main page to the last link: “Port Mayaca Lock, S-308 Spillway.” View by date; the last date shows 873 cubic feet per second (cfs) being discharged.
Front page of ACOE Lake O website, 2015.3-9-15 Lake O level 14.71 feet. NVGD.S-308 report shows 873 cfs on 3-7-15 going into C-44 or SLR.
Here are some more photos Ed took yesterday, 3-8-15, of the SLR/IRL.
West side of Sewall’s Point, 3-8-15 showing St Lucie River. (Ed Lippisch)East side of Sewall’s Point, 3-8-25 showing Indian River Lagoon. (Ed Lippisch)Southern tip of of Sewall’s Point showing SLR in foreground and IRL in background. 3-8-15. (Ed Lippisch)Known as the “Crossroads” this area off of S. Sewall’s Point is the confluence of the SLR/IRL. The St Lucie Inlet is just off of the tip of S.Hutchinson Island and is known as Sailfish Point and is blocked in the far upper right of this photo. 3-8-15. (Photo Ed Lippisch)St Lucie River/Indian River Lagoon near Sewall’s Point and Sailfish Point, Hutchinson Island. “Crossroads.” (Photo Ed Lippisch)SL Inlet in distance, 3-8-15. (EL)3-8-15. IRL. East of Sewall’s Point. (EL)
When Ed got home, he said I was lucky I did not go up with him as it was windy which means bumpy…He also said the plume looked different from what we have seen before. It looked “chalky” as is seen in these two photographs below and extended about two miles off shore and further south of the St Lucie Inlet.
I am no scientist, but I would imagine this is silt/suspended solids in the water as everything is “stirred up” from the wind. Suspended solids falling on and smothering our reefs….
Plume off St Lucie Inlet, 3-8-15. (EL)Plume another view 3-8-15. (EL)Map showing reefs in Marin and Palm Beach counties. The reef in MC is directly impacted by the discharges from Lake O. (map courtesy of state.)
In closing, I must thank my husband for the photos, and I must point something out.
This area around Sewall’s Point and Sailfish Point, this “confluence” of the St Lucie River/Indian River Lagoon, in the not too distant past, has been documented as the most bio-diverse estuary in North America (Dr. R. Grant Gilmore, senior scientist with Estuarine, Coastal and Ocean Science, Inc., (ECOS)(http://www.floridaoceanscouncil.org/members/bios/gilmore.htm).)
The map below allows us to see where these precious seagrass beds are/were located. The map above shows where our “protected” near shore reefs are located just outside the St Lucie Inlet where the discharges go out to sea. These reefs are the northern most “tropical reefs” on the east coast of Florida…
SFWMD seagrass map, 2015.
I think it is a truly a sin that the ACOE and SFWMD year after year discharge onto these productive sea grass beds and near shore reef habitats that are the breeding grounds for thousands of fish and sea creatures. Its loss is felt all the way up the food chain, including “us.”
Where is the Department of Environmental Protection? Where is the Florida Wildlife Commission? Where is NOAA?
Not to mention, last year a designation of “Critical Wildlife Area,” —the first in 20 years for Florida—for 30 plus species of nesting and resting protected birds, was established on “Bird Island,” located just 400 feet off south Sewall’s Point….”Now” is right before nesting season’s height. Where will the birds find food when the seagrass beds are covered in silt and the water is so dark they can’t really see? Chances are these releases will continue.
Don’t our state agencies have a duty to protect? Don’t they have a voice or has it been muffled? Not a word? Not a peep. Where is our governor? Isn’t this money? Isn’t the productivity our of waterways linked to our businesses? Our real estate values? Where is our local delegation? Have we all become numb to this destruction? Beaten down and manipulated so long we that have no reaction?
It breaks my heart.
Our state and federal government entities responsible for “protection” especially should hang their heads in shame.
If nothing else “speak out” about how bad it is. Recognize the loss. Address the “constraints,” killing this ecosystem and local economy. Take leadership!
Be true to our heritage. We are the United States of America. Be brave. Speak out!
Lake O water and some area canal water flowing through SLR after ACOE opened S-308 on 1-16-15. (Waters in St Lucie River east of Roosevelt Bridge) Photo taken 1-25-15 by Ed Lippisch)
One thing to remember is that the St Lucie River and many parts of the Indian River Lagoon are “impaired,” as determined by the state of Florida at least by 2002 and 2008:
This basically means any number of things, but mostly, that there is too much “nutrient” (phosphorus and nitrogen) in the water. This comes from many sources and all of the sources should be addressed. These nutrients encourage algae blooms, sometimes toxic, destroying seagrasses, water clarity, and other “life.”
So no matter how “good” today’s water quality reports may be, or how good the water looks, or whether the Martin County Health Department reports “acceptable” levels of bacteria in the water, the waters of our area are “impaired.” This is especially true, “under the water” where one really can’t see unless you dive in with a mask and flippers.
The state saw this “impairment” status coming for decades due mostly to Florida’s development boom and the gigantic and historic role of agriculture, but…..
Yes, the key word is “but,” it happened any way…
More recently, on January 16th of 2015, the Army Corp of Engineers (ACOE) started dumping from Lake Okeechobee into the SLR/IRL again. This is early in the year to start dumping and historically this foreshadows a bad summer—-BUT Lake O. was high and the ACOE and South Florida Water Management District (SFWMD) like to have 3 to 4 feet of “freeboard” in the lake so if a hurricane comes in summer and the diked lake fills with 3-4 feet of water, the Herbert Hoover Dike doesn’t break. They don’t like the lake to be over 15.5 feet or so. It is “best” if the lake is around 12 feet by summer–BUT they will never tell you that——something to do with “water supply…”
Chart releases 2-24-14 by the SFWMD showing releases from Lake O since January into SLR/IRL.
The above chart provided by the SFWMD shows all releases since January into the SLR/IRL. Blue is Lake O. The ACOE stopped for one week starting February 17th so Martin County could complete a bacteria study.
During this time I went up in the plane with my husband; the water looked great in the Crossroads by Sewall’s Point and the St Lucie Inlet as it was an incoming tide and releases had been halted.
One might think: “Oh the water is healthy again!”
Remember, it is not.
SLR/ILR Crossroads 2-22-15. (Photo JTL)SLR/IRL convergence waters between Sewall’s Point and Sailfish Point 2-22-15. (JTL)
Another factor in all of this is—— if you look at the SLR/IRL reports from Florida Oceanographic (http://www.floridaocean.org) over the entire time of the recent releases, measuring salinity; visibility; and dissolved oxygen, the reports are quite good. And they are good, but this does not remove the “impaired status” of the river.
I apologize they are out-of-order below, but I could not achieve better with out great time and effort.
You can click on the images to enlarge the reports. These charts basically show a consistent grading of “B to A” water quality in the SLR/IRL since January 8, 2015—- other than the South Fork which of course is where the water from Lake Okeechobee is coming into the St Lucie River through C-44!
Anyway, to repeat again, one must remember that at all times and in all places right now no matter how pretty or how good a chart looks, our St Lucie River and parts of the Indian River are “impaired.”
We must work to improve the status of our rivers by lessening area freshwater canal runoff; our own “personal pollution” though fertilizer, septic and other stuff we put on our yards and down the sink; from roads/cars–Florida Department of Transportation (FDOT) canals are everywhere and have no “cleaning;” and most of all, we must work to one day redirect as much water away from Lake Okeechobee as possible.
The purchase of land in the Everglades Agricultural Area south of the lake is about the only place this can be achieved.
It is all so confusing sometimes, BUT one thing is for sure, the more we learn, the more we can help and inspire others to clean up our rivers!
Sunrise along the Indian River Lagoon. Photograph by John Whiticar, 2015.
“Sunrise, sunset, sunrise, sunset,
Swiftly fly the years,
One season following another,
Laden with happiness and tears…”
1st verse, of song from musical “Fiddler on the Roof,” 1964
The beautiful sunset and sunrise photos of our area’s photographers invoke a deep appreciation of our St Lucie River/Indian River Lagoon, as well as the struggles and successes of our lives.
Sunsets and sunrises seems intrinsically linked to inspiration and reflection in all of us.
Thankfully, here in the Indian River Lagoon region, we can still see our sunrises and sunsets, although the health of our river, and thus our ability to enjoy the river, is “impaired.” This was scientifically determined by the Florida Department of Environmental Protection (FDEP) in 2000. (http://www.dep.state.fl.us/southeast/ecosum/ecosums/SLE_Impairment_Narrative_ver_3.7.pdf)
In Beijing, China, last year, the government erected a televised screen showing sunsets, as the people could not see their sunsets any longer— due to the tremendous smog in their city. What a price to pay for economic “success.”
China starts “televising” the sunset in Beijing, as the city is continually blanketed in smog, 2014. (Source earthfirstjournal.org.)
Oddly enough, on some level, we have experienced the same thing. On a level of world comparison, we have a “thriving economy;” however, somehow, over the past 100 years, we have “lost our river.” Yet in most of the adds one sees, the river still looks beautiful and healthy.
Right now, the Army Corp of Engineers (ACOE) is discharging water from Lake Okeechobee, while the South Florida Water Management District canals C-44, C-24, C-23, and C-25 are also dumping polluted water into our estuary. All of this extra water has been “engineered” to come here so agriculture and development can thrive. Us included…
Sunset, St Lucie River, 2014. Todd Thurlow.
So, right now there is “no other way,” and the ACOE and South Florida Water Management District are locked in a cycle of struggle to send more water south when the entire southern area south of Lake Okeechobee is blocked by the Everglades Agricultural Area— other than a few canals, to “send water south.” Plus the water is too dirty for the Everglades—but not for the St Lucie River/Indian River Lagoon that is already “impaired.”
The “mighty” Kissimmee too has been “engineered for the success of farming and ranches and development in its former watershed. It is being partially restored by the SFWMD; this is wonderful, a testament of the ability of the system to recover if given a chance….
And after all, it’s not so bad here right? We can still see the sun…..AGGGGG!
Let’s continue to turn this ship; let’s continue to fix our own yards, towns, cities, and counties; let’s keep pushing the State for a reservoir/flow way to store, clean and convey water south. As Eric Eichenberg, CEO of the Everglades Foundation said yesterday at the Rivers Coalition meeting, this is the “only way” as the Kissimmee River’s continued restoration is simply not enough to hold all the water.
“Sunrise, sunset….sunrise, sunset….”we are thankful and we are inspired….
Aerial of Frances Langford’s Outrigger Resort’s marina, restaurant, and compound, built in Jensen/Sewall’s Point ca. 1955. Visible is the dredge and fill it took to accomplish this project. (Photo courtesy of Thurlow archives.)
“Mt Pisgah,” the area of Rio, contiguous with north Sewall’s Point, that was Mrs Langford’s home. (Photo ca. 1950s, courtesy of Thurlow Archives.)
At last week’s Everglades Coalition Conference, (http://evergladescoalition.org), one of my favorite quotes was repeated by respected Martin County resident, and nationally renowned environmentalist, Mr Nathaniel Reed:
“Not knowing your history, is like walking into the middle of the movie.”
Prior to the 1970s, the passage of the Clean Water Act, and the national environmental movement, “dredge and fill”was commonplace. Dredge and fill includes the dredging of canals that have created our Atlantic Inter-coastal Waterway; the dreaded Okeechobee Waterway; canals draining South Florida below and around Lake Okeechobee; the Everglades Agricultural Area; as well as many prominent subdivisions and commercial centers that we relish today.
Postcard photo of Frances Langford’s Outrigger Resort ca. 1960s)
After people realized the environmental degradation that unfortunately went along with these projects, (some include: turbidity in the water column, destruction of seagrass and wildlife habitat, and sometimes the release of heavy metals and other pollutants harbored in the bottom sands and sediments,) getting permits to “do such” became much harder.
Another aerial of the completed marina in 1965. (Photo courtesy of Thurlow Archives.) Note healthy looking seagrasses right off shore.
Mrs. Frances Langford (http://en.m.wikipedia.org/wiki/Frances_Langford), who built the well-known “Outrigger Resort and Marina, “in the 1950s, just north of Sewall’s Point, became an “environmentalist” in her later days, bestowing tremendous monies toward the Florida Oceanographic Society on Hutchinson Island, (http://www.floridaocean.org).
And yes, she gave to just about every charity in town! The point is, she loved helping “create” Florida Oceanographic in her later years, and in the 1940s and 50s people really did not realize the true extent of the destruction their dredge and fill projects were causing to the world that they loved. I believe this even holds true with some of the worst offenders of the agriculture and development industry who have, in essence, destroyed Florida and its waters.
But times change, and people change. I believe there is a movement of change right now to “send water south” again…to fix our state, and yet to allow businesses that came into being, during earlier times of our history, to survive and adapt.
Frances Langford 1940s. (Public photo.)Singing to the troops with Bob Hope. “The favorite time of her life…” (Public photo.)
As I mentioned, to be able to change the St Lucie River/Indian River Lagoon, we first must learn to look around, to be aware, and to be able to recognize the history of our own area as we try to change the bigger state picture as well.
Once you start looking, you will see that “dredge and fill” is all around us.
You may ask yourself:
“How is a huge boat, going through the IRL that on average is three feet deep?”
“How are those boats coming from Ft Meyers across Lake Okeechobee into the St Lucie River/Indian River Lagoon?”
“Am I living on what used to be a spoil island or the edge of a coastal community of fish and birds?”
“Am I living in a former wetland?”
I know, that although I do not live on the river, “I am;” I live in a coastal hammock in Sewall’s Point, a bird sanctuary.
There is no turning back, but we can change how we create a new history in the future.
By knowing history, there is a way to “rebuild”and “reeducate.” Whether it is starting in your yard, or changing state policy…
So look around you. Learn your history, view the “full movie”…And may the great waters of Florida flow again with life, beauty, and all the generosity of the late Frances Langford.
Francis Langford in her later years stands before photos decorating the Francis Langford Outrigger Resort, Rio, Florida. (Public photo.)
Secretary Hershel Vinyard, of the DEP, fields questions from river activist Benjamin D’Avano about a toxic SLR/IRL, “TMDL Celebration” Downtown Stuart, 2013.
Right before Thanksgiving, I heard the news, “Secretary Hershel Vinyard announced he is retiring from the Department of Environmental Protection….”
Even though there were many times over the past few years, that I felt like the DEP was not doing its job, and that the Scott administration had “demoralized” the agency, I felt saddened to hear this news….
Why? Because Hershel Vinyard was someone who went out of his way to build relationships in Martin County. Who will I call now? Clifford Wilson, the 35-year-old interim Secretary for the DEP? Don’t think he’d recognize my name and maybe not even be that familiar with the problems facing the St Lucie River/Indian River Lagoon…
Clifford Wilson, interim Secretary for the DEP.
After thinking for a while, an image came to mind of the first time I saw Secretary Vinyard deal with an angry public. He did a good job and from that moment on I liked him.
I have to say that Secretary Vinyard did a good job handling an angry crowd and over time I came to know him and appreciated that he took the time to visit Stuart on many occasions and learn the history and polluted plight of the St Lucie River and Indian River Lagoon. He would listen. He helped bring Governor Scott here to see the river. He saw how much we cared and responded even though he could not single-handedly fix the situation. Martin County is not known for getting much attention–I am appreciative that it was given…you can’t start changing things until those in power know who you are.
Group shot, Town of Sewall’s Point Commissioner, Jacqui Thurlow-Lippisch; Stuart Former mayor and Commissioner, Jeff Krauskoph; SFWMD Board Member, Kevin Powers, DEP Secretary Hershel Vinyard; SLC Commissioner, Chris Dzadovsky ; Martin County Commissioner, Ed Fielding; River Kidz member, Mary Thurlow, 2013.Speakers talk about the clean up of the SLR, 2013.Mary, Secretary Vinyard and me, 2013.
One time, when I emailed the Secretary about the SLR/IRL, I made the mistake of writing “Secretary Walker…” as in “Hershel Walker,” a very famous Georgia football player from my era who tortured the Florida Gators. As always, Mr Vinyard was a gentlemen and did not make me feel like an idiot.
In spite of people or parties we “like or dislike,” we must remember that it is relationships that will help heal the St Lucie River/Indian River Lagoon, and these must be built with whomever is in office. And although it may have been political, Secretary Vinyard was on the Army Corp of Engineer Calls at the end of this summer asking the agencies NOT TO RELEASE LAKE OKEECHOBEE WATER THROUGH S-308 into the St Lucie River/Indian River Lagoon. I will never forget these words….this is progress.
Yes, I am thankful for the times Secretary Vinyard took an interest in Martin County and since he resigned Thanksgiving week, I want to mention this. I hope that the next person who takes the position of Secretary of the DEP comes to know the St Lucie River/Indian River Lagoon too. We are entering a critical time with the possibilities of land acquisition in the Everglades Agricultural Area though Amendment 1; it’s a lot easier to work this with people we know or knew…
Plume from canal runoff C-44, C-23 and C-24, October 17, 2014. (All photos Jacqui Thurlow-Lippisch and Ed Lippisch.)
Today, I will take you on an air tour, hopefully one of the last of this year’s rainy season. In Florida, rainy season corresponds with hurricane season that lasts June through November. Nonetheless, typically the rains start to wind down towards the end of October.
The Army Corp of Engineers has not released from Lake Okeechobee this year so it has given us an opportunity to see what the runoff in our area is “in and of itself.” I refuse to use the words “local runoff” because the St Lucie River and Indian River Lagoon’s runoff is over 50% of what is was before the Water/Flood Control Districts and the ACOE created since the 1920s in order to drain the land for development and mostly agriculture.
It is the runoff of these expanded lands that we are dealing with today, full of sediment, fertilizer, pesticides, herbicides, road pollution, and whatever is on people’s yards.
I think seeing how “bad” our canal runoff is also shows why WE CANNOT ACCEPT WATER FROM LAKE OKEECHOBEE on top of this already bleak situation of our own.
Green is original flood plain and yellow is expanded flood plain. Photo from A “Citizens’ Report to Congress” 1995, St Lucie River Initiative.
So anyway, enough of my lecture, let’s get started!
Ed in front of Cub Legend.
The tour starts at Witham Airport in Stuart.
Run off from canals and Willoughby Creek
The first thing one sees once up in the air off of runway 12, is the polluted freshwater pollution/sediment line coming around the tip of Hell’s Gate in the St Lucie River. This water is coming from the South Fork of the St Lucie River where C-44 is located and the North Fork area where C-24 and C-23 are located. This filthy water flows into the St Lucie River proper and then around the tip of Sewall’s Point, into the Indian River Lagoon, out the St Lucie Inlet and then into the open Atlantic Ocean. (See map/chart 3 above for canal locations and expanded watershed runoff.)
Close up of plume in SLRSewall’s Point
Continuing on, as one flies over the St Lucie Inlet and along the Atlantic Coast over Jupiter Island one sees the dark water in what is usually a turquoise blue ocean. It must be noted that although this runoff canal-plume is disgusting looking it is nothing close to how dark and sediment filled it was last year when the runoff included releases from Lake Okeechobee.
Beach along Jupiter Island
There was some fun stuff to see also. There were many sharks in the dark waters. Ed and I wondered if they were sneaking up on the fish in all the cloudy water, there were so many. We must have seen 20-25 large sharks. We also saw sea turtles and giant rays, and lots of bait fish and sea birds both in and out of the plume area.
Plume from canal runoff C-44, C-23 and C-24, October 17,2014.
As we approached Peck’s Lake, we could see the tip of the plume in the distance like a giant slug. The plume ended about a mile short of Hobe Sound Beach, in Jupiter Island.
Ed and I talked about how one house would have the dark plume waters and another only a few feet away had blue ocean…
Plume up closeAnother angle, tip of plumeLong shot with Peck’s Lake in background.Shot of ocean on the trip home showing edge of plume.
Well that’s the end of the tour. Hopefully you learned something or saw something new. And hopefully it is also the end of the rain for 2014. To learn more about these canals please see links below.
Another year, another rainy season behind us….
As we flew home, I was grateful to live in such a beautiful area and with every flight I become more determined to save it from the dirty waters of our canals and Lake Okeechobee. To destroy such a paradise is wrong.
The collective teamwork of the SLR/IRL River Movement has had a tremendous effect on state agencies such as the ACOE and SFWMD. “KEEP THE GATES CLOSED!” (Photo of River Warrior and River Kidz mom, Cristina Maldonado, donning her homemade protest shirt at the St Lucie Locks and Dam River Rally. Photo Jacqui Thurlow-Lippisch, 2013.)
Today I want to share what I consider a huge recent success of the River Movement and our ability to network and work together to protect our St Lucie River/Indian River Lagoon.
On August 25th, Jensen Beach activist Jackie Trancynger sent out an email blast featuring a photograph taken by Paul Shidel of an awful looking algae bloom he found while photographing birds at Port Mayaca. Port Mayaca is where structure S-308 is located that allows water from Lake Okeechobee to be released into the C-44 canal to the St Lucie River/Indian River Lagoon.
Here’s the photo. You may recall reading about it in one of my previous blogs or seeing it in an email exchange:
August 24, 2014 photograph of blue-green algae bloom east of S-308, Lake Okeechobee/C-44 Canal area/ (Photo courtesy of Paul Shidel.)
So anyway after I saw the photo, I called Jackie Trancynger and got Paul Shidel’s email in order to verify the location of the bloom-certainly appearing to be toxic algae. Paul not only verified the location but provided a map!
Map of algae bloom’s location on east side of S-308, C-44 canal. (Paul Schidel.)
On Tuesday, August 26, I participated as I have for almost two years now, in the ACOE Periodic Scientists Call in my capacity as an elected official from the Town of Sewall’s Point at the invitation of Ms Deb Drum, who oversees Martin County’s Ecosystem Restoration & Management Division.
During this call I sent Paul’s photo and map to the ACOE stating concern that if S-308 were opened this possibly toxic algae would head straight into our SRL/IRL.
Then an amazing thing happened..
The ACOE ask the Department of Environmental Protection (DEP) to test the algae.
Yesterday, Deb Drum from Martin County reported that the testing came back positive as “Microcystis, a toxic blue-green algae.” The county in turn notified the ACOE that the algae exists in that location to document their concern. If the ACOE were to open the locks at S-308, the algae could travel downstream with the water flow into the SLR/IRL. This knowledge could actually make a difference in a decision of the ACOE to open up those structures.
Wow. Thank you Paul!
I have complained before on the ACOE call about toxic algae being released from Lake Okeechobee as the SLR/IRL does not seem to “go toxic” from its local canals, but only when Lake Okeechobee’s waters are unleaded to our shores. Toxic algae has been seen in the area between S-308 and S-80 many times but we need to start documenting this. Documentation is a powerful tool in changing the tide of destruction.
So thank you for your teamwork! Together we can help KEEP THEM CLOSED! The “Gates of Hell” that is…
Subject: Lake Okeechobee, Okeechobee/Glades/Hendry/Palm Beach/Martin Counties: Florida CyanoHAB Tracking Module has received a record update
On August 27, 2014, Florida Department of Environmental Protection’s Southeast District staff sampled an algal bloom found in Lake Okeechobee. A single grab sample was collected of surface scum at the Port Myakka Lock (C-44.) Following are the laboratory results for this sample:
Result: Class Toxin potential * The dominant taxon was: Microcystis aeruginosa Class Cyanophyceae yes
Other taxa present: Dolichospermum circinale ** Class Cyanophyceae yes Pseudanabaena sp. Class Cyanophyceae undetermined Eudorina elegans Class Chlorophyceae – Pediastrum simplex Class Chlorophyceae – Glenodinium sp. Class Dinophyceae
* Information based on literature searches and personal communications; information is continually being updated. “Undetermined” refers to specimens for which the lowest practical level of taxonomic identification is genus and some, but not all, species within that genus have the potential to produce toxins or toxin information not available for the identified species but is available for genus level.
August 24, 2014 photograph of blue-green algae bloom east of S-308, Lake Okeechobee/C-44 Canal area. (Photo courtesy of Paul Shindel.
Does the above photo make your stomach turn? What is it?
It is a HAB or Harmful Algae Bloom, taken four days ago, right here in Martin County.
According to the United States Department of Agriculture, “over the past century, alterations of land use and acceleration in the rate of cultural eutrophication have led to widespread increases in harmful algal blooms in Florida, including toxin-producing species.”
First, what is “eutrophication” and why is it “cultural”?
Eutrophication is is when a body of water becomes enriched in dissolved nutrients (such as synthetic phosphorus and nitrogen from fertilizer) that stimulate the growth of aquatic plant life usually resulting in the depletion of dissolved oxygen and a “bloom.” These algae blooms can be toxic.
“Cultural means “created by humans.”
So what are we doing about this especially since “we” caused it?
In 1997 the Florida Department of Environmental Protection formed a Task Force on Harmful Algae Blooms and in 1999 they produced a scientific document, a White Paper: HARMFUL ALGAE BLOOMS, (http://myfwc.com/media/202228/HAB_whitepaper2006_UPDATE.pdf) It is extensive.
In my opinion, as usual, our state governors and legislatures did not pay significant attention to these studies, and failed to implement policies that would help overcome this crisis issue. How many of them even read the report?
Case in point, recently, it was the local governments and local residents of the towns, cities and counties along the west and east coasts of Florida who advocated and achieved strong fertilizer ordinances not allowing fertilizer use during the rainy season while the state continues to fight and support less restrictive rules.
1. Time-Series Sampling in Pinellas and Manatee Counties) Researchers conduct detailed sampling to better understand when, where and under what conditions harmful algal blooms form.
2. Tampa Bay Monitoring ProgramResearchers monitor 10 sites in Old Tampa Bay for the presence of, or conditions favorable to, harmful algal blooms.
3. Red Tide Offshore Monitoring Program
Encouraging people to learn about the program and learn how to become volunteers, collecting water samples around the state to help scientists monitor the Florida red tide.
4. Monitoring Toxic Algae Species and Shellfish in the Indian River Lagoon (2002-present)
Periodic testing of water samples and clams provides an early warning of bloom occurrences and shellfish toxicity and minimizes the risk of human exposure to saxitoxins.
Those are great present HAB programs, so why don’t we hear more about them and why don’t they include Lake Okeechobee, obviously the toxic algae is there as well…
Here at home, when the gates of S-308 open from Lake Okeechobee to the C-44 canal that is connected to the St Lucie River/Indian River Lagoon, the algae in the photo above goes directly into the our river system.
Google Earth image of S-308, structure at Lake Okeechobee that opens to the C-44 canal where above photo was taken. This area always has some spill through the gates. Note the agriculture lands right up to the C-44 canal…
It is 2014. The state has been studying this problem since 1997. They do not have all the answers but we do know by now that HABs are fed by cultural eutrophication due to clearing of land that can no longer clean water on its way to estuaries, rivers and lakes; building of towns and cities that create concrete and asphalt barriers to water reabsorption; fertilizer and other runoff; oil/chemicals from thousands of miles of highway and roads; septic effluent; canals and redirection of water such as Lake Okeechobee to the St Lucie and Caloosahatchee; agriculture’s heavy destruction of native lands and the fertilizer and chemical runoff associated with their business, unregulated golf courses fertilizer run off and re-use of high nutrient water resources….it’s endless.
It is said that “ignorance is bliss,” well the state of Florida doesn’t have that luxury anymore.
Cover of NOAA/DEP “Draft”Indian River Lagoon System Management Plan, 2014.
My husband came home from the airport yesterday, I was on the couch in the living room reading. “Have you had a good afternoon?” He asked.
“Awesome,” I replied. “I have been reading the most wonderful document that contains all of the important information about the entire Indian River Lagoon.” I energetically held up my gigantic copy of the Florida Department of Environmental Protection and NOAA- Indian River Lagoon, Draft Report for 2014. (http://www.dep.state.fl.us/coastal/sites/indianriver/plan.htm)
Ed smiled and looked at me like he usually looks at me in such instances. “That’s great,” he ironically replied, “government publications are my favorite too, how exciting…”
I am not always enamored with government publications, but I am with this one, especially as it is not finalized yet and the agencies are taking comment from the public.
What I like best about the document is that is deals with the entire lagoon, not just one section, including the lagoon’s four aquatic preserves: 1. Banana River; 2. Malabar to Vero Beach; 3. Vero Beach to Ft Pierce; and 4. Jensen Beach (really just south of the City of Ft Pierce) to Jupiter Inlet.
Locations of the IRL’s four aquatic preserves
According to the document, “each of the four aquatic preserves comprising the IRL System was classified by the state of Florida as OFWs or “Outstanding Florida Waters, “in 1979 (Rule 62-3-2.700 (9) F.A.C.
I was 15 years old at that time. I remember those waters and how they shaped and enriched my life growing up here in Stuart. To think that these “Outstanding Florida Waters,” are now “impaired” makes me sad and makes me angry.
It has been coming for years, but in 2011 through 2013 the lagoon system really “crashed” with the “super-bloom” and brown tides in the central and northern lagoon, killing more than 60% of the area’s seagrass and leading to two federally designated “Unusual Mortality Events” of the endangered manatee, and the protected bottle nosed dolphin.
And also in 2013 the months long toxic algae outbreak in the southern lagoon… This occurred due to blue-green “microcysis aeruginoas” algae water released by the ACOE from Lake Okeechobee, into the St Lucie River/IRL system. The SLR/IRL system was already over stressed from discharges coming from local canals C-44; C-23; C-24 and C-25…the lake Okeechobee water was the nail in the coffin so to speak.
I think there is a disconnect here. Aren’t these waters protected?
According to the publication, the mission statement of the Florida Coastal Office/Department of Environmental Protection is the following:
1. protect and enhance the ecological integrity of the aquatic preserves;
2. restore areas to the natural condition;
3. encourage sustainable use and foster active stewardship by engaging local communities in the protection of aquatic preserves; and
4. improve management effectiveness through a process based on sound science, consistent evaluation, and continual reassessment.
I will refrain from bashing of the Department of Environmental Protection as I do not think our fair state’s leadership over the past hundred and fifty plus years has helped them attain their mission. How do you “direct” an agency to protect something and then simultaneously promote over drainage of natural systems, channelizing, overdevelopment along the lands of these once “outstanding waters,” and allow water districts to over-grant permits for aquifer withdrawal for more agriculture and development?
Another irony I have to add here is that these once “outstanding waters” are what helped bring people to our locations and supported their high real estate values. That is changing as some people are now leaving. Last year, in the Town of Sewall’s Point, although the real estate market improved overall in the county, our property values only increased 0.13%. As a “desirable” water front community with some of the highest property values in the county, this came as a surprise and is certainly directly linked to the “lost summer” and toxic waters of 2013.
The state of Florida needs to “wake up.” The Town of Sewall’s Point is a microcosm for the rest of the state. So what can we do to help? Speak up!
Please if you have time and interest, check out Indian River Lagoon System Management Plan, Draft Report 2014 below. Even if you don’t read it all, which is almost impossible, keep it as an electronic resource, and MAKE A COMMENT to the DEP. Even if it is just one that you appreciate that they are reevaluating their management plan and how much the IRL means to you.
It is only through the continued pressure of a caring public that the Indian River Lagoon will be resurrected and its “living waters” will run through our cities again.
Paint colored shocking green algae at the gate entering Lake Okeechobee, 2009. (Photo from video by Jacqui Thurlow-Lippisch.)
I am well aware that the St Lucie River and Indian River Lagoon have location specific e. coli bacteria problems, as well as “overall water quality problems,” due to our local canals. This summer has been a great example of such with our SLR/IRL waters colored putrid brown all the way to the St Lucie Inlet just from releases from C-44, C-23, and C-24 canal basin runoff releases.
This is why it is beyond my comprehension, that with such terrible local water issues, our state and federal agencies can legally and in good conscious, “if necessary,” on behalf of flood control, release more nutrient, sediment filled waters into our SLR/IRL through Lake Okeechobee when they know that those waters often contain Microcystis Aeruginoas, a cyanobacteria that can produce health threatening toxins through its blue-green algae blooms.(http://www.doh.wa.gov/CommunityandEnvironment/Contaminants/BlueGreenAlgae.aspx)
Various 2013 SLR photos of microcystis aeruginoas, cynanobacteria. (Bob Voisenet, Mary Radabaugh, Jenny Flaugh, Douglas Ashley, Gary Hendry.)
In 2013, the Martin County Health Department, through spokesperson, Bob Washam, urged residents to avoid contact with the algae in the entire estuary from the St Lucie Canal to the St Lucie Inlet. Luckily with our local, “yuk” releases, we have not had that situation occur yet in 2014.
I have had two personal experiences witnessing these blue-green blooms. The first was during a boat ride into Lake Okeechobee, September 5, 2009, and the second was last year (2013) with the Everglades Foundation team, at the St Lucie Locks and Dam when the ACOE was releasing. As we walked over the gates, I clearly saw bright blue-green algae on the side of the dam allowing in Lake O water. Believe it or not, the SRWMD was testing the water right there… Mark Perry from Florida Oceanographic was with me and I ask him:
“Mark, is that “toxic” blue-green algae?”
Mark replied:
“Yes, blue-green algae can be toxic is most prevalent in fresh water systems. It is often in the lake.”
“And they are releasing it into our river?!”
I stood there in a daze….amazed.
Then I recalled the boat trip I had taken with my husband and dogs in 2009, and how we had seen the blue-green algae clearly along the edges of the locks while going into the lake and I had videotaped it. I am including some photos I took of that video below.
When Senator Rubio visited Stuart on behalf of the SLR/IRL, I told this story….I have told it many times at many official meetings to no avail. I think it a significant issue. Anyway…
So far this year, with the releases from our local canals, toxic algae, or Cyanobacteria, has not been reported in the SLR/IRL. It could be in the future, but it is less likely than when the ACOE is releasing from the lake. Why? Because often when they release from the lake it is TREMENDOUS amounts of freshwater, even more than comes from our local canals. Plus the blue-green algae is already in the lake as its fresh.
According to Bob Washam, blue-green algae was first reported around 1995 and it was blue! They thought it was a paint spill. The outbreaks have been more common since this time the worst being in 1998. Whether blue or green in color, it is bright. Very bright. You can see it.
How could our government, in essence, “poison its own people,” and how can we allow this, especially when we can see it?
We must push our government for change. Health, safety and welfare is something we rightfully deserve. Send the water south.
West of the red line shows the edge of what was once the Everglades in South Florida. Development has crept and continues to creep over this edge. (Photo/map courtesy of Chappy Young,/GCY Inc. Surveyors, 2014.)
We in Martin and St Lucie Counties make up what is referred to as the “Northern Everglades.” Before the Army Corp of Engineers, (ACOE), changed the course of Lake Okeechobee’s waters in the 1920s and directed it to go east and west through canals to the estuaries, Lake Okeechobee’s water would slowly crest over the southern edge of the lake and flow south. For many, myself included, the long term goal of saving our St Lucie/IRL and Caloosahatchee estuaries includes recreating a type of “flow way, or floodway south” to Everglades National Park. The parched park needs our water just as Nature intended.
There are many challenges to this scenario but the most visual are the following.
The first is the Everglades Agricultural Area, (EAA), 700,000 acres located just south of the lake; the second is east coast development that has crept in over the years “into the Everglades.”
The red colored blocks south of Lake O. are the EAA,700,000 acres of sugar lands, vegetables, small historic agricultural communities, and infrastructure. South of the EAA are the water conservation areas in purple and green. (SFWMD map, 2012.)The red line surrounding Lake O. shows the Everglades wetlands that historically filtered the water before it got to Florida Bay. As we can see humankind has “filled in” a lot of this. (SFWMD map, 2012.)
I have written before about the “seepage barrier” an underground permeable wall that runs along the east coast to keep the water out of these developed areas through pumps that send the seeping water back inside the Everglades. Crazy. If needed, the EAA also pumps its ground water and surface water off its lands to keep the level as needed for the crops. They are assisted by the SFWMD. This is a historic relationship. It is how our state was “built.”
This satellite photo shows in blue the water on lands in 2005. One can see the lands in the EAA just south of the lake are devoid of water. This water has been pumped off the lands into the water conservation areas, sometimes back pumped into the lake, and also stored in other canals. The water would flood the crops if it were on the lands. (2004-2005 SFWMD aerial photography.)
The above photo shows the EAA dry while surrounding lands are wet.
I really do not have an answer of how to build a flow way through all this agriculture, infrastructure, and development as I am not a scientist. But I have not given up the idea. I have faith one day there will not be another choice.
What I confidently can say is that we all know water is valuable, “the new oil.” Water issues whether they be pollution or the need for water usage in a growing state demand attention and we know with the future coming we should not build anything else inside those red lines. No port, no windmill farms, no more development, no more agriculture.
FWC map for 2060 projected population growth, state of Florida, 2011.
If the the Florida Wildlife Commission’s map is right and Florida’s population in 2060 is around 36 million, (today it is 19 million), we are going to need more fresh water. Also if we are to save the northern estuaries and the Everglades so our children have some semblance of what the planet once was, we must redirect more water to go to where it once did, south.
Let’s draw a new line for water. A line that clearly shows we know its value not just to agriculture and development, but to the environment, and the children of the future.
Aerial photo of C-25 canal depositing what DEP and SFWMD note in their Eco-Summary literature as “nutrients and agriculture chemicals into the Indian River Lagoon.” (Photo Ed Lippisch, July 10, 2014.)
Ed and I returned from California on July 9th and within 24 hours he was up in his plane and took these photos of C-25’s Taylor Creek outlet in Ft Pierce releasing excessive rain water runoff into the Indian River Lagoon. Still recovering from the three hour time difference, I gladly stayed home!
C-25 runoff into IRL. (Photo Ed Lippisch 7-10-14.)
The C-25’s canal outfall, although not connected to Lake Okeechobee, is one of the most dramatic and heartbreaking sites of our Indian River Lagoon’s destruction as it releases very close to the Ft Pierce Inlet so the difference in the water color is extreme. C-23, C-24, and C-44 releasing into the St Lucie River are probably quite similar, however, because the St Lucie River is dark in color and not close to an inlet to the ocean–the brown on brown water does not give the same effect as C-25’s brown on blue.
C-25 canal in Ft Pierce. (Photo Ed Lippisch 7-10-14.)
During last year’s heavy releases from Lake Okeechobee by the ACOE, my husband Ed and I flew up to Ft Pierce and flew the entire length of the C-25 canal which attaches to the C-24 canal, which in turn attaches to the C-23 canal. The water can be”made” to go in any direction by the South Florida Water Management District for agriculture purposes or otherwise. So water from C-23 or C-24 could theoretically be moved into C-25 and visa versa.
So anyway, Ed and I were taking a video for Dr Edie Widder of ORCA who is studying the water issues of the area. The ride was so bumpy and windy I became very sick which is not unusual for me in airplanes.
“Ed can you turn around?” I think I am going to puke.” I muffled through the microphone.
“Sorry babe, we’re in for the long haul with this wind; we should just follow the canal in this direction and ride it out….”
At that point my jacket in the back storage area flew out of the Cub and I envisioned it going over Ed’s face and us crashing, but it did not, and instead floated to the ground below. I held my stomach wondering what the person or cow who saw the jacket fall to the ground thought, hoping it did not land on someone’s windshield.
That trip, along the C-25, C-24 and C-23 back to Stuart was the worst ride of my life and I got sick many times while looking over mostly acres of orange fields and other agriculture. I saw some cows and then development as we got closer to the coast. I really just remember that is was acres and acres of land.
In the wind, the trip took over an hour from Ft Pierce, inland, south, and then back to the east coast of Stuart. The map below shows how the canals are connected and you can see the path we took–like a giant tall open rectangle.
Canal and basin map SLR/IRL. (Public.)
There is great literature on the C-25 and from what I have read the state agencies have been aware of the destruction caused by the canal for many years.
The ECO SUMMARY written by the Florida Department of Environmental Protection 1998, unfortunately, mostly still applies today, as the Indian River South Plan, has not come into being yet. The Indian River South Plan is a component of the Central Everglades Restoration Plan or CERP, that was approved by Congress around 2000. This plan would and hopefully will, one day, acquire lands, to hold water so it doesn’t just run untreated into the lagoon.
C-23, C-24 and C-44 are part of this IRL Plan as well, and as we know we have been fortunate this year and in recent past years to have been appropriated partial monies by our US Congress, the state of Florida and Martin County to build the C-44 Storm Water Treatment and Reservoir system–they are building it now.
But back to the C-25 the Eco-Summary. This link below interestingly states:
“The C-25 Canal was created as past of the Central and Southern Florida Flood Control Project (1950/60s) and discharges into the Indian River Lagoon…The section of the lagoon currently impacted by discharges from C-25 comprises one of the best remaining segments of the lagoon, namely the area just north of Harbor Branch Oceanographic Institution to the Ft Pierce Inlet…Thus C-25 potentially impacts the best of the best.”
“C-25 delivers a greater volume of water and thus a great net pollutant load that the other major upper east coast drainage canals C-23, C-24, and C-44. ( A surprise to me.) C-25 has been shown to transport pesticides, polyaromatic hydrocarbons, and heavy metals into the estuary as well as offshore…”
As you would expect, the C-25 is an “impaired” water body and was determined as such by the Department of Environmental Protection in 2003. Yet the IRL, from Vero to Ft Pierce Inlet, has been designated by the state as a protected Aquatic Preserve since 1975.
Did I just write that?
An impaired canal full of heavy pollutants has been running into an Aquatic Preserve?
Yes, I just wrote that. This is the truth.
This to me is even more heartbreaking than the photo. To know “we” have known the situation since the 1970s really and have not fixed the issue is a crime. We are all guilty as it is we that direct the course of our government.
So please don’t forget:
“The power of the government is derived from the consent of the governed….”Let’s keep pushing our elected officials and be prepared ourselves to do what it takes to fix this mess!
Thank you for reading my blog and for caring about our rivers.
Harold R. Johns, posing with a large tarpon, early 1920s, Stuart, Florida, St Lucie River. (Photo from Stuart on the St Lucie by Sandra Henderson Thurlow.)
When the pioneers permanently opened the St Lucie Inlet in 1892, it killed the freshwater grasses that filled the waterways creating a brackish estuary that due to the convergence of tropical and temperate zones, and the nearby warmth of the Gulf Stream, became “the most diverse estuary in North America.” (Gilmore)
After a short period of time, sportfishing thrived in the area, and fishing guides called Stuart the “fishing grounds of presidents” as US president, Grover Cleveland, vacationed and fished the area in 1900 and years after.
In spite of long standing issues with the health of the estuary, as late as the 1970/80s Dr Grant Gilmore of Harbor Branch documented over 800 species of fish living and breeding in the then healthy seagrasses around Sailfish and Sewall’s Point at the convergence of the St Lucie River and Indian River Lagoon. This was a larger variety of species in one place than any other area in United States. (Gilmore)
“Goliath Grouper” called “Jew Fish” at the time, Stuart. ca. 1920s. (Thurlow Collection)
Going back to the the 1930s, the 1938 Blue Book, a popular annual fishing publication of the time, lauds fishing throughout the entire Stuart area:
“The City of Stuart located approximately 20 miles south of Fort Pierce is world renowned for its fishing. Located as it is…it offers a variety of fishing similar to Fort Pierce but somewhat more pronounced, particularly with regards to the tarpon, sea trout, snook, channel bass, bluefish, crevasse jack, pompano and ladyfish. It’s fresh water fishing is particularly good far into the back county among the Sloughs with their tributary and drainage canals to Lake Okeechobee and the many drainage canals through this territory. These Sloughs and Canals offer splendid fishing for black bass, as well as for the larger game fish from the salt water, such as th snook and tarpon, that make their way into Stuart Harbor and on up into the both and south branches of the St Lucie River. –Particularly good fishing for these species can be had at the St Lucie Locks about 12 miles inland south of Stuart…”
All photos from Stuart on the St Lucie, Sportfishing chapter, by Sandra Henderson Thurlow.
It is interesting to note that although the Blue Book piece, written in 1938, celebrates Stuart’s fishing, one can find evidence of tension regarding the releases from Lake Okeechobee in the literature of the day as early as 1925.
Fearing the onslaught of development in the booming twenties and the changes brought on by the connection and building of the C-44 canal from Lake Okeechobee to the South Fork of the St Lucie River, beginning in 1923, the South Florida Developer’s, November 10th, 1925 headline reads:
Article 1925, South Florida Developer. (Thurlow collection.)
“Fish Will Leave the River As City Grows, Fisherman Assert, Sewage and Oil Sure Death to a Favored Sport is Verdict.”
The article quotes commercial fishermen who know that the over abundance of fresh water from Lake Okeechobee will chase away the salt water fish and that the oil on the water from development, perhaps from cars and road runoff, if excessive, won’t allow the fish to sufficiently breathe.
Fishing guide Phil O’Brian is quoted as saying: “I know the ways of the sea fish. They can’t stand fresh water; and they won’t stand sewer water. We have the fresh water now mixin’ in from Lake Okeechobee and we’ll soon have the sewer water.”
These pioneers are probably rolling over in their graves should they have learned about the story of the St Lucie/Indian River Lagoon most recently.
The St Lucie River was labeled “impaired” by the Florida Department of Environmental Protection in 2002 mostly due to pesticides and heavy metals from agriculture and urban pollution runoff accumulating in the sediment from all area canals, especially C-44 and Lake Okeechobee. In a way, just like the 1920s fisherman foresaw…
The fight against the area canals and Lake Okeechobee continues today, and if by the grace of God we can undo some of the hands of history, the St Lucie and Indian River Lagoon will surely heal herself and we once again could be the ” Fishing Grounds of Presidents…”
…but then we might have to get rid of that green and sprawling golf course at the Floridian.
The S-80 structure at St Lucie Locks and Dam. C-44 canal in background goes miles to Lake Okeechobee where the S-308 structure is located at the eastern edge of Lake O. (Photo Scott Kuhns, 2013)Drainage basins into the St Lucie River, note C-44 south. (SFWMD, 1999.)
The locks are back in the news again. WPTV, “hard working for the river reporter,” Jana Eschbach, broke the story yesterday, that the Army Corp of Engineers did not alert the public that they would be releasing polluted canal, C-44 basin water through the S-80 structure into the St Lucie River. Jana, like most people, feels that the public should be alerted when polluted water will be coming into the estuary in that we swim and fish. She is also concerned the water in the area of Palm City and the Roosevelt Bridge, which has been reported to have high levels of bacteria, will be pushed to the popular Sandbar area.
This can be confusing. Don’t we just care about lake water? Also, if the locks are open, doesn’t that mean the ACOE is releasing Lake Okeechobee water? Not necessarily, and the basin water can be just as damaging to the estuary and the public. So how does releasing basin or lake water work?
There are two structures along the C-44 canal which runs along the side of Highway 76 from the South Fork of the St Lucie River, to Lake Okeechobee: S-308 at the edge of Lake Okeechobee, and S-80, 20 miles or so, east, at the St Lucie Locks and Dam.
This ACOE canal and structure map shows S-308 at Lake O. and S-80 along the C-44 inland.
S-80 serves duel purposes. First to release water through Lake Okeechobee, but only if S-308, at the lake, is open first, allowing water into the C-44 canal. Then S-80 lets the water pour into the St Lucie River.
Second, S-80 can be opened just to allow water from the C-44 to flow into the St Lucie River, as the C-44 canal is surrounded by a 185 square mile basin, mostly agriculture, that has been directed to flow into the canal when it rains. Agriculture also uses this water in the C-44 canal to water their crops. To make things more confusing, C-44 can “deliver” local basin runoff in both directions: to Lake Okeechobee and to the St Lucie Estuary. The ACOE decides where the water “needs” to go by opening and closing the structures of S-308 and S-80.
It must be noted that the water from the C-44 basin is polluted, as is the water from Lake Okeechobee. The Florida Department of Environmental Protection writes: “…the construction of the C-44 canal has had the greatest impact of the St Lucie Estuary–and nearly all of that impact has been bad, FDEP 2001.) The charts below show how much nitrogen and phosphorus come into the river from the C-44 and other basins. C-44 is the highest. Phosphorus and nitrogen mostly from fertilizer, feed toxic algae blooms in the hot summer months.
Similar charts shows amounts of nitrogen and phosphorus runoff into the SLR. Note C-44 basin is the highest. (SFWMD, 1995.)
Fortunately, there is good news due to the help of our local, state and federal governments. The almost 3 billion dollar “C-44 Storm Water Treatment Area/Reservoir” has received first stage fundings and is under construction in Indiantown. It has been since 2011. This reservoir will hold the release water from the C-44 basin and clean it before it is returned to the St Lucie River. This is a huge positive, although it will not stop the releases from Lake Okeechobee.
An educated public is the best defense against the continued destruction of the St Lucie River/Indian River Lagoon. Thank you for being part of the solution and hopefully, next time, the ACOE opens any structure for any reason, they will alert the public, because here in Martin and St Lucie counties, we want to know!
The St Lucie River basin/drainage map 2013, SFWMD.
For thousands of years, before the intervention of modern man, the Ais Indians walked the banks of a large fresh water “stream,” that flowed to the Indian River Lagoon. When the Seminoles came years later, they called it Halipatiokee, Alligator Water, as it was fresh and full of gators. The Spaniards came in the 1500s, on and off for centuries. They first called the river, Rio de Santa Cruz, river of the Holy Cross, as the river is cross-like. Later, they re-christened the river Rio De Luz , river of light, for the lighting on the water is heavenly. Eventually, the Spanish called the river, Santa Lucea. The English then taking over, “anglicized” the name Santa Lucea, to what we know today, as “St Lucie,” the church’s saint of the blind, and of “vision.”
1883 Geodetic Survey, Indian River Florida, St Lucie River.
Unfortunately, there was not much long-term vision when the watersheds around the St Lucie were altered by modern man. In 1892 area pioneers cut a permanent inlet from the St Lucie River/Indian River Lagoon to the Atlantic Ocean, killing the native fresh water grasses that supported an entire ecosystem. Nonetheless, they created something wonderful, the brackish estuary we all know today. This area, over the years, before its recent destruction, became one of the most bio diverse estuaries in North America.
That wasn’t enough, the local people and the state, with the help of the federal government’s Army Corp of Engineers, decided they wanted a connection to Lake Okeechobee for trade, travel, agriculture and the convenience of keeping the big lake of Okeechobee, “low.” So they built the C-44 canal connecting Lake Okeechobee to to the St Lucie “River.” In high water times, the overflow from the lake was directed into the St Lucie River as it is today. Later, around the late 1950s the people decided they wanted more drained land for orange groves and development in the north, and less flooding, so they got the state and federal government to build the C-23, C-24 canals in Martin and St Lucie counties, draining some areas that had never flown south before. These canals even drained lands out west, in what is now Okeechobee County, and in the north, known today as the City of Port St Lucie.
Did the people building these canals ever think about the effects on the Saint Lucie River? This seems doubtful. And so today, we have a river system that takes on much more water than it was ever meant to receive.
As Ernie Lyons, the former great environmentalist and editor of the Stuart News wrote in the 1960s about the loss of the headwaters of the South Fork of the St Lucie River during his lifetime:
“…The drainers got to work on the marshes. The cypress bordered ponds became white sand in the dry times. A ditch through them gushed silted floods during the heavy rains. The little stream was ruined. It turned from paradise to paradise lost…”
Not until really the 1970s did humankind start to reflect and realize that we literally were killling paradise, and we have been trying to revive the spirit of the St Lucie River/Indian River Lagoon ever since.
With out a doubt, the spirit of the saint still lives in the St Lucie River; her ancient story is that she lost her eyes to give the people their own “to see .” When you drive over the bridge and look at her, the beautiful St Lucie, open your eyes and ask her to give us all, “better vision.”


 Liz Dunn shared 6-9-18 just south of Martin Health System.


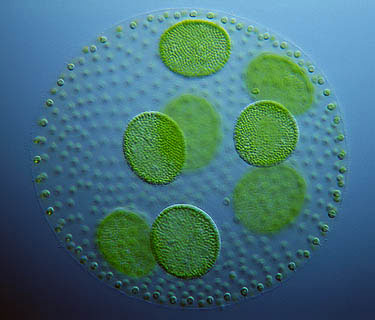


