Tag Archives: Drainage

Simple Version, Canal Network of SF w/Historic Imagery 1940-53, SFWMD

Current Canal Network of SF w/Historic Imagery 1940-1953 Map (Simple Version), SFWMD, created by supervisor of Geospatial Mapping, Dr Ken Chen, and his team: Lexie Hoffart, Nicole Miller, and Erika Moylan.

~Today’s map has almost the same name as July 11, 2020’s shared map, but it is “simple,” as the 298 drainage districts are not marked. To best view this image go to South Florida Water Management District’s Featured Map Gallery, click on the image, and then export the PDF to your desktop. An easy way is to link here to the image entitled SFWMD Current Canal Network with 1940-1953 Historic Images Simple Version  (2nd row, 3rd to right) then go to “File” and “Export as a PDF.”

Once downloaded to you desktop, you can zoom in and move up and down wherever you wish to go. North, south, east, west, central. What will you see? You will perceive the modern mapped canal network of South Florida atop hundreds of historic aerial photographs that have been stitched together. These maps are the first of their kind. 

This image gives us a clear idea of what canals drain South Florida. I don’t think ever in one place has this information been so visually available.

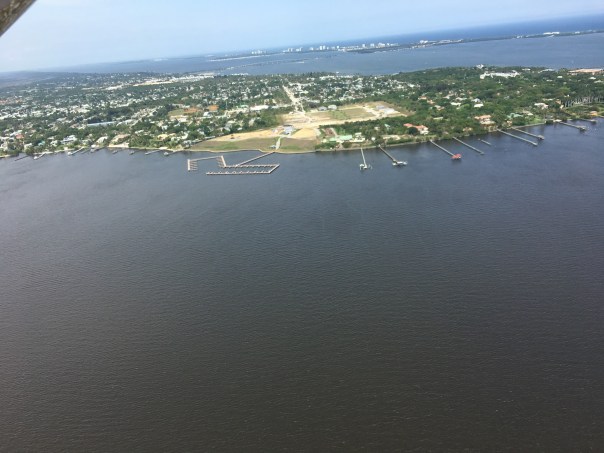
I will use the east coast of Florida to zoom into with screen shots for examples, as this is my home. Later, hopefully, you can use your zoom feature as described at the beginning of this blog post to downloaded the map as a  PDF for an even closer view. It will blow you away! 

In the images below, from north to south, we see St Lucie; Martin; Palm Beach; Broward; and Miami-Dade Counties with in the footprint of the  Central and South Florida Plan, now managed by the South Florida Water Management District. Mind you many of these canals in the map pre-date the SFWMD. 

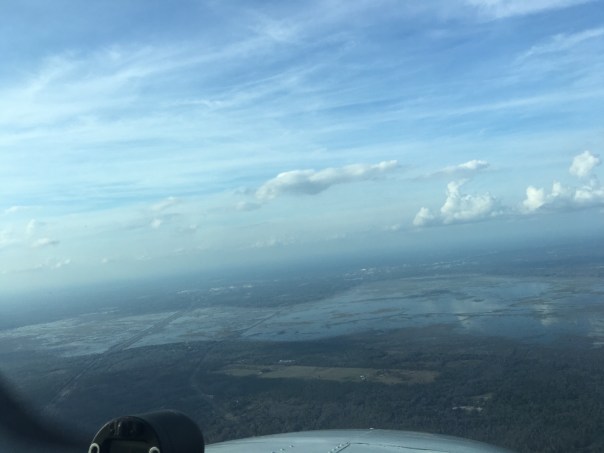
Oh my gosh! Look at all these canals! Look at the wetland images they rest upon. Most children grow up today not even knowing…

The canals are almost everywhere draining what was once of the largest wetlands in the world. Think of all the animals that once roamed and swam here. According to Mark Perry, CEO of Florida Oceanographic, through these canals approximately  1.7 million gallons of fresh water a day is drained to tide.

Kind of weird isn’t it. Like we are living on a squeezed out sponge. Looking at this map makes me want to rethink Florida. How about you? 

CLICK ON EACH COUNTIES IMAGE TO ENLARGE AND SEE ALL OF THE CANALS OVER ONCE WETLANDS – as revealed in 1940-1953 aerials taken by the U.S. Dept of Agriculture.  

Again~

To understand the creation and complexity of the maps I am including the following words of Dr Ken Chen  Ph.D., GISP, Supervisor, Geospatial Mapping Services UnitInformation Technology Bureau, South Florida Water Management District. I had asked him to describe what was entailed with the historic imaging. Thank you to Dr Chen and Team whose talent, research, and time made these maps possible. 

  1. Historical aerials (1940 – 1953)

“Sources of historical aerials, especially 1940s and 1950s, are very scarce, especially for such a large area in South Florida. Therefore our focus was to get whatever we could find online regardless cloud cover or quality of images. As you know, all of those old images were recorded in an analog format (i.e. film or paper), instead of digital. Some (maybe all) of those films/paper images were later scanned and saved to a digital format and made available online. Scanning usually results in loss of imagery quality. For this canal map project, we were fortunately able to locate aerial index images (I would call them aerials index panels), after weeks of online research including data download and review. Each index panel displays a group of aerials in sequence over a specific area. For instance, say 200 images from #1 to #200 over an entire county. These index panels are usually used for aerial imagery management and archival purposes, just like a library index card for images. There is no information at all regarding how those index panels were created, but they are seemingly made via camera shooting or scanning of a group of stacked paper images or positive films. The index panels are simple graphics or pictures without any geospatial information, such as projection, coordinate system etc. The first step to process these index panels, prior to mosaicking, was to geo-rectify and inject geospatial information into the images. To do so staff needed to identify ground control points. It’s very challenging to identify those points in those very old images due to lack of apparent landmarks, e.g. road intersections. This is particularly difficult in the middle of nowhere across the vast wetlands in 1940s-1950s. So staff tried to use a very few of the intersections between rivers, canals and a few major roads to geo-rectify the panels and assigned appropriate geospatial information into them to make them georeferenced images. Then staff clipped each panel image to trim out the white or black edges before stitching all of them together for the majority of south Florida.

The original aerials were collected by the U.S. Dept of Agriculture. The aerials index panels were obtained from the Univ. of Florida’s Imagery Library. One thing to note – it’s very evident that there are strong image vignetting effects in the old aerials – bright in the center and getting darker toward the edges. That is an inherent optical artifact in the analog images and can not be corrected during the post processing.

This may be more than you asked for. I’m not sure if I have explained this clearly. To summarize it, this process can be simply illustrated in the following format:

Online search of available sources of data -> data download and review to accept or reject -> identify ground control points (GCP) in prep for image processing -> Using GCPs to georectify the index panels -> inject geospatial information into the panel pictures to make them georeferenced images -> remove the white/black edges -> Mosaick all georectified index panel images -> clip the mosaic to the district’s boundaries before use in the maps.

I forgot to mention the number of historical aerials we used to create the historical mosaic. We used totally 84 aerial index panels. Each panel consists of roughly 50+ to 200+ individual aerials, depending upon the geographic area each panel covers. I can’t get the exact number of aerials, my best guess the number would be ~7,000+-12,000.”

-Ken

Dr Chen

“West Palm Beach Canal 1940 Aerials and 1958 Topo,” Todd Thurlow

West Palm Beach Canal 1940 Aerials and 1958 Topo, Todd Thurlow

You will see:
0:06 1940 USDA Aerial Index of Palm Beach County
0:20 Eight 1949 and 1950 1:24K USGS Topo maps
0:45 Pinner Island (now known as Ibis Isle)
1:01 1940 USDA Aerial – West Palm Beach Canal outlet to Lake Worth
1:40 Lake Clarke area where the Palm Beach Canal now crosses under I-95
– The road “s” turning over the canal is actually the Seaboard Air Line Railroad (now CSX)
– The Florida East Coast Railway is 0.6 miles to the east (the next canal crossing downstream)
1:54 Lake Clarke – on the 1950 Palm Beach USDA Topo
2:54 Morrison Field Airbase (later renamed Palm Beach International Airport).
See: http://www.pbchistoryonline.org/page/…
3:37 SFWMD Offices south (left) of the canal across from the airport
4:11 Wide fade-in of 1940 USDA Aerial Index – ponds and bogs of western Palm Beach County
4:21 The northern end of what is now the Loxahatchee National Wildlife Refuge
(aka WCA1 – Water Conservation Area 1)
4:41 1958 USGS 1:250K Topo Quad showing western Palm Beach County
4:49 Twenty Mile Bend
5:05 Eastern portions of the Everglades Agricultural Area (EAA)
5:46 Canal Point at the western end of the Palm Beach Canal

____________________________________
Palm Beach County is a fascinating place, especially, as in 1925, Martin County was born of it. We are connected, as is everything in this water-world of South Florida.

Today, I feature another incredible “Time Capsule Flight” by my brother, Todd Thurlow. I have recently been studying Palm Beach County and Todd’s flights help me understand what was, what is, and would can be. Palm Beach County is interesting as unlike Martin County, it has been developed very far west into the historic Everglades.

When I made a big deal out of this, my mother gave me a book published in 2000 entitled OUR CENTURY, a conglomeration of articles by the Palm Beach Post. A historian, my mother smiled saying, “Jacqui, Palm Beach County always planned on going west…”

The first article I came upon was about Louis Perini, the father of “Westward Expansion.” Eliot Kleinberg writes: “In the mid 1950s West Palm Beach was only a mile wide. But a single land deal set off a westward land rush now limited only by the Everglades…”

And to the Everglades it certainly went!

To learn some canals while were at it, you’ll see that Lake Okeechobee is connected to the historic West Palm Beach Canal, which is connected to the C-51 Canal, which in turn drains the C-51 Basins to the Lake Worth through Structure-155. Like the C-44 Canal, both lake water and basin water can be transported through the C-51 canal damaging the water quality in Lake Worth ~Sound familiar? Very similar to the plight of the St Lucie/Indian River Lagoon. Tremendous amounts of precious fresh water wasted to tide, destroying ecological habitat and property values along the way. We must do better!

In any case, it is an amazing thing to really see that we are living in what once was indeed a beautiful marshy swamp.

Enjoy Todd’s flight “West Palm Beach 1940 Aerials and 1958 Topo;” it’s time-travel into Florida’s past and into her future. Again here is the video.

(https://youtu.be/G4oNnXJt7q0)

Links and References:

Our Century, The Palm Beach Post: https://books.google.com/books?id=TiC84R9yXgEC&pg=PA169&lpg=PA169&dq=elliott+kleinberg+perini&source=bl&ots=BNWQOIFp5X&sig=ACfU3U1TI15nVYF5P3rxi-ZiGrAMUHDTvQ&hl=en&sa=X&ved=2ahUKEwihw_zh_JXhAhURwlkKHWtsCvMQ6AEwAXoECAgQAQ#v=onepage&q=elliott%20kleinberg%20perini&f=false

Evolution/maps of Palm Beach County with Martin County’s creation by Florida Legislature in 1925: http://www.pbchistoryonline.org/page/evolution-of-palm-beach-county

Todd Thurlow, bio: (https://jacquithurlowlippisch.com/todd-thurlows-time-capsule-flights/).

Lake Worth, fading 1958 topo map to 1940 US Ag Dept. aerials ~outlet of  C-51 to Lake Worth. Looking west to 20 Mile Bend going north then west again as  West Palm Beach Canal leading to Lake Okeechobee. Todd Thurlow

An Incredible Flight! 1958 USGS Quads ~Everglades, Loxahatchee Slough, Allapattah Flats, and St. Johns River Marsh, by Todd Thurlow

USGS 1958 Quad Western Martin and St.Lucie, slide Todd Thurlow, Time -Capsule Flights

Today, I present, yet another incredible Time-Capsule Flight by my brother Todd Thurlow. (https://jacquithurlowlippisch.com/todd-thurlows-time-capsule-flights/). This flight takes us on a tour over the Everglades, the Everglades Agricultural Area,  Loxahatchee Slough,  Allapattah Flats, Ten Mile Creek, and the St Johns River Marsh, fading in and out, so one can see what the landscape/waterscape looked like in 1958 using USGA topographical maps compared to today’s Google Earth maps.

What is most striking for me, is how undeveloped, how undrained, much of the land was in 1958, not really that long ago… 61 years ago.  For reference, my husband, Ed, is 62 years young!

More than we can image has happened to South Florida since 1958…

For instance, when Todd flies by notice how little sugarcane and other crop production was taking place in the Everglades Agricultural Area just south of Lake Okeechobee compared to today. Now there are about 525,000 acres of sugarcane, back then, there appears to have been fewer than 50,000 acres of sugarcane in acreage.

Everglades National Park had been in place since 1947, but look at the difference in Whitewater Bay,  as well as Taylor and Shark River Slough; and what about Florida Bay?

The Loxahatchee Slough region, near Jupiter, in Palm Beach County? Holy moley, notice how the once magnificent slough was made smaller by development encroaching  from every direction, eventually leaving “Grassy Waters” at the southern end – as the sole water supply, via rainfall for all of West Palm Beach…

When Todd travels north over Marin, St Lucie, and the southern edge of Indian River County, perhaps the biggest shock for me endures, as I grew up in this area ~(For reference, I’m 55 years old 🙂

You’ll see that on the USGA map, southern Indian River, St Lucie, and Martin counties are shown in wavy blue as a gigantic marsh, at certain times of year, FULL of clean water!!!! Crazy! Since 1958 these lands have been drained (Ten Mile Creek) that was hydrologically connected to the marsh, through canals C-23, C-24 and C-25; and the waters of the St Johns “Stick Marsh,”( the headwaters of the St Johns River), a north flowing river, are now also drained south into the St Lucie River.  Agriculture fields and nearby highways cover those most of those stick marsh lands today.

And the central larger marsh?  “Allattah Flats,” also known as “Allpattah Marsh,” or in old military Indian war maps, “Alpatiokee Swamp? Well, the City of Port St Lucie, with over 250,000 residents, and acres of ailing greening orange groves, and more agricultural fields fill these areas today.

Just unbelievable, isn’t it?

Talk about “taking control of one’s environment. “Kind of cool, but I’d say we have really over done it, considering that now our waters, critical for life itself, are almost entirely impaired.

It is my wish that as the residents of Florida push their governments to work for cleaner water, and restore some of these lands, that we all keep in mind the history of what the lands were, working with Mother Nature, not against her.

Todd’s Time Capsule Flights are an invaluable tool in recognizing how much human determination has changed these lands, and how a modern-day determination can restore them. Please click on below and enjoy! Thank you Todd!

An Incredible Flight! 1958 USGS Quads, the Everglades, Loxahatchee Slough, Allapattah Flats, and St. Johns River Marsh, by Todd Thurlow

(https://youtu.be/m7bOEAXbOyA)

1958 USGS Quads of the Everglades, Loxahatchee Slough, Allapattah Flats, and St. Johns River Marsh

This time capsule flight overlays three 1958 USGS Quadrangle Maps of southeast Florida from Florida Bay to the St. Johns River Marsh in Indian River County. You will see the following places:
0:30 Whitewater Bay
0:39 Shark River
1:44 The Everglades Agricultural Area (EAA)
2:20 Loxahatchee Slough
3:15 Allapattah Flats
3:35 Tenmile Creek
4:03 St. Johns River Marsh

Historical Topographic Map Collection legend

Documenting the Discharges, 3-17-19

*Please note all comments become public record.

1.Ed and the Super Cub 2019. Our “eye in the sky” since 2013.

2.Tip of South Sewall’s Point looking north to Hell’s Gate. Witham Field, Stuart, west.

We continue to document the discharges…

Yesterday, 3-17-19, my husband, Ed, flew the Super-Cub over the St Lucie River/Indian River Lagoon ~ twenty-one days after the ACOE started discharging from Lake Okeechobee on February 24, 2019.

When Ed arrived home, I asked, “So how was it?”

“Brown,” he replied.

“Like dark coffee brown, or kind of like that weird mixed greenish-brown?”

He looked at me, and smiled. “Jacqui, it was brown.”

“OK, I said, I’ll take a look at your photos.”

So here are the photos from Ed’s flight from Witham Field in Stuart, over Sewall’s Point and Hutchinson Island, then out west  to S-80 to see the “Seven Gates of Hell” where you can see the one gate discharging now at an average of 250 cubic feet per second, down from an average of 500 cubic feet per second. As you can see from the SFWMD chart below, there has been other runoff locations as well, but the majority is from Lake Okeechobee.

ACOE Press Release: 3-14-19, ACOE, showing decision to go to 250 cfs to SLR/IRL. ACOE says they are “pulse releasing,” however, these are not the “pulse releases” we are familiar with during prior discharge destruction events, as the number never goes to 0, it just goes up and down. https://www.saj.usace.army.mil/Media/News-Releases/Article/1784910/corps-to-continue-lake-o-release-plan-with-minor-adjustments/

Thank you to my husband Ed, for showing us that right now, the river is brown.

ACOE, Periodic Scientists Call, 3-12-19, http://w3.saj.usace.army.mil/h2o/reports.htm


3. Approaching the SL Inlet, algae covered remaining seagrass beds

4.Sandbar formation inside of SL Inlet

5.Blurry but shows boats at the Sandbar and that weird green brown color

6.Sailfish Point and SL Inlet algae covered remaining seagrass beds

7. Ernie Lyons Bridge, IRL with SL inlet and Hutchinson Island in distance

8. S-80 along C-44 Canal or the Seven Gate of Hell, boats going through locks, “250” cubic feet per second coming though

The following phots are of Caulkins Water Farm, a former orange grove that died due to citrus greening that now holds water from the C-44 Canal. This is a wonderful thing! As local ag-man Mr. Hadad, told me once, “Jacqui we spent 100 years taking the water off the land, and we’ll spend the next 100 years putting it back on.” The later photos are of S-80 again with view of C-44 canal leading west to Lake O.(https://www.facebook.com/CaulkinsWaterFarm/)

9.

10.

11.

12.

13.

14.

15.

16.

17.

18.

19.

20.

21.

22.

23.

24.

The following photos are when Ed headed back to Witham Field going once again over the St Lucie Inlet over the Atlantic Ocean. You can see the water looks blue north of Sailfish Point north of the inlet with nearshore reefs visible. Plume is also visible south of St Lucie Inlet. Also in photos is the winding Jupiter Narrows and St Lucie River in the area of Stuart and Rio. You can see Langford Landing with scraped orange soil and docks built into river still under construction since 2015.

Thank you to my husband Ed, our eye in the sky!

25.

26.

27.

28.

29.

30.

31.

32.

33.

34.

35.

36.

37.

38.

39.

40.

41.

42.

43.

Lock No. 1 North New River Canal, Yesterday and Today

~Lock No. 1 is located at 6521 FL 84, Davie, FL 33317, was used until 1912, placed on the National Register of Historic Places in 1978. It is  also known as the Sewell Lock (architect) and the Broward Memorial Lock (https://dos.myflorida.com/florida-facts/florida-history/florida-governors/napoleon-bonaparte-broward/)

Historic Lock No. 1 New River Canal, with “new structure” in background, photo by Ed Lippisch

Driving into the heart of Ft Lauderdale, one is enveloped in traffic while passing through a preserved pond apple slough. Incredible! Just recently, Ed and I visited Lock No. 1 North New River Canal enjoying its art-deco architecture and pondering this “highway” of early Florida. Lock No. 1 was the first of the South Florida canal system playing a major role in the Everglades’ drainage dream of Napoleon Broward.

Canals built south of Lake Okeechobee were not just for drainage and agricultural development,  but also for transportation to achieve these things.  In early times, boats were the car or the horse…

Please read from Broward History below:

One of the canals, the North New River Canal, was, in the early years, a major transportation artery between Fort Lauderdale and Lake Okeechobee. In order to make the canal useful for transportation, locks had to be constructed. Lock No. 1 at the south end of the canal was the first to be built in South Florida.

…The opening of the lock led to an increased agricultural exploitation of the newly drained land along the New River Canal. Produce grown in this area and around Lake Okeechobee was brought down the canal through the locks to the railroad in Fort Lauderdale. An even more important cargo was Okeechobee catfish. New River was lined with fish houses, overhanging the river. Boats traversed the distance between the lake and Fort Lauderdale in groups. This made the trip go faster since more than one boat could get into the hand-operated lock at a time making it more efficient.

The locks also made it possible for small steamboats to operate on a regular basis between Fort Lauderdale, the lake and Fort Myers via the Caloosahachee River. Regularly scheduled steamers included the Suwannee, Lily and Passing Thru. These boats carried passengers, cargo and tourists up and down the river. By 1926 the canals had shoaled to the point that boat traffic was no longer practical and the waterway was replaced by a railroad and highways as the primary transportation method to and from the lake…”

~Excerpt from Broward.org (http://www.broward.org/History/NationalRegister/Pages/LockNo1NorthNewRiverCanal.aspx)


One could say that Lock No. 1 helped lead to the success of the Everglades Agricultural Area (https://pubs.usgs.gov/circ/circ1182/pdf/12Everglades.pdf) as well as the development of Broward County that continues today right into what was once the Everglades (https://www.sun-sentinel.com/opinion/fl-op-buzz-mega-mall-everglades-20180511-story.html)

Florida Memory https://www.floridamemory.com/items/show/105656

1924 Florida Archies

Topographical map of EAA showing elevations.

West of the red lines shows the edge of what was once the Everglades in South Florida. Development has crept and continues to creep over this edge. (Photo/map courtesy of Chappy Young,/GCY Surveyors


For Ed and I the visit was a great experience. And I was happy knowing I could tell my mother we visited something on the National Register of Historic Places! The Iguana’s liked the historic lock too. They were everywhere!

Look closely and you will see many iguanas! I saw at least fifty running around. Big, small, jumping into the water from the lock and dam, sunning themselves. Very cute, although an invasive issue for the area eating everything…

Right before one turns in!

One passes through a cool Pond Apple Slough a remnant this area once being the Everglades.

Pond Apples also known as Custard Apples at the lock. Prior to agricultural development there was a 32,000 acre pond apple forest at the southern edge of the Everglades. It was ripped out to access the valuable “black gold” soil below.

Ed and I in front of the new structure built to replace Lock No 1. along the New River Canal that goes north to Lake Okeechobee. The New River in its natural form has been severely compromised by agriculture and development; however, million dollar homes sit along its altered shores today. The state of Florida must work for both water quality, and our economy as now they are actually one in the same. Lock No. 1 even has its own Facebook page, you can join here:  https://www.facebook.com/pages/Sewell-Lock/568281143229622

Maps:

Links:

Structures of theSFWMD: http://w3.saj.usace.army.mil/h2o/lib/graphics/projmaps/infra.pdf

Looking Back, St Lucie River ~Rain and Algae 2018

Even though the water in yesterday’s photo looked gorgeous, lest we forget, here are some images of the St Lucie River/Indian River Lagoon area during a rainy and cyanobacteria ridden 2018.

Ed and I didn’t start taking pictures until were motivated…

In March 2018 there was a tremendous rain event. (https://www.sfwmd.gov/our-work/flood-control/managing-high-water)
My homemade rain gauge showed over 27 inches in just a few days along the coast!

You’ll see that after the rain event, the St Lucie River/Indian River Lagoon looks terrible even with out Lake Okeechobee discharges. This is caused by directed water runoff from C-23, C-24, C-25, C-44 and “local” coastal runoff.  Naturally, the river never took all this water. Humans made it this way, and we must fix it.

SFWMD canal and basin map.

Soon after the torrential rain, the Army Corp of Engineers made things even worse and started dumping from Lake Okeechobee through the C-44 Canal into the St Lucie River by opening up the gates at S-308 and S-80.

My husband, Ed,  first flew over Lake O on June 1st,  just by chance. At this time, he spotted algae on the lake and took a photo.  Ironically, the next day, the Army Corp started dumping from Lake Okeechobee on June 2nd!

The algae or cyanobacteria (http://www.ucmp.berkeley.edu/bacteria/cyanointro.html)
that was festering in the Lake began to show up almost immediately thereafter in the St Lucie River that has also become  a “nutrient porridge.”

The rest unfortunately is history. 2018  was bad, but in my opinion not as awful as 2016 when the ocean was totally green: https://jacquithurlowlippisch.com/tag/bathtub-beach-algae/

After another long, hot summer, the Army Corp finally stopped discharging in the fall~October 5th… Take a look at the photos and remember to enjoy the blue water when it is here, but NEVER FORGET! Only though looking back, will we have the determination to change the future.

Major rain event in March 2018.  Rain filled this vile up many times!

SLR IRL following major rain event in March 2018. This is runoff from C-23, C-24, C-25, C-44,  and “locally” from developed areas along the river and uplands made to drain into river. JTL

Following rain event in March 2018. A brown Atlantic.

Following rain event in March 2018, the SLR/IRL ~Scott Kuhns

Following rain event in March 2018 Sailfish Flats between Sewall’s and Sailfish Points ~Scott Kuhns

June 5th. A very dark plume moves south along Jupiter Island, just days after ACOE begins dumping so this is a combination of all pollution/runoff  waters…

LAKE OKEECHBEE DISCHARGES ADDED

Ed in the Cub after plume photo

Algae as photographed/spotted by Ed in Lake O on June 1st 2018.

City of Stuart, June 9 2018.

Rio near Central Marine, week of June 12, 2018

Photographing a manatee in the algae along seawall by Mary Radabaugh

Mary Radabaugh manages Central Marine with her husband. JTL

Mary found a dead baby manatee floating in the putrid water shortly after LO discharges.  MR

LAKE O: Week of June 16th, June 25th, and July 22nd. Cyanobacteria (blue green algae) blooms and then subsides. ~All the while, this water is dumped into the St Lucie River by the Federal Govt.; the water quality is terrible and this the responsibility not of the Feds but of the State of Florida.

Algae is now very visible in Lake O, June 16, 2018 JTL

June 25, 2018 Lake O, near S-308, Port Mayaca.  JTL

C-44 canal leading to SLR from Lake O.

C-44 canal leading from LO to SLR.

Satellite view LO bloom on June 24, 2018. ~At its height.

By July 22, 2018 the bloom in the LO is lessening, JTL

August 29, algae would come and go, throughout the SLR. Here near Overlook Drive JTL

September 4, algae still “coming and going” ~2018 Snug Harbor, Stuart.  Photo by my uncle, Dale Hudson

October 5, the ACOE stops dumping from Lake O. The blooms stop almost right away but the damage remains….

December 8, 2018 the river looks “normal” again near Sewall’s Point but it is not. JTL

Is it Time to Address South Florida’s Greatest Taboo? “Shared Adversity,” SLR/IRL

LAKE OKEECHOBEE REGULATION SCHEDULE (LORS) http://www.saj.usace.army.mil/Portals/44/docs/h2omgmt/LORSdocs/2008_LORS_WCP_mar2008.pdf

The second she said it, I was at full attention. This past Tuesday, Sanibel-Captiva Conservation Foundation Director, Ms. Rae Ann Wessel, spoke on the Army Corps of Engineers Periodic Scientists Call. In seven years of listening, in seven years of agency and public comment, I had never heard, seriously, and scientifically, someone address South Florida’s greatest taboo.

Ms Wessel said something like this:

Part of the LORS (Lake Okeechobee Release Schedule 2008)  addresses “shared adversity.” Lake Okeechobee is approximately 470,000 acres. Would it be possible to put the water the Corps plans  to release from the lake over approximately 484,000 acres of  crop lands just south of the lake, rather than into estuaries? The Caloosahatchee algae situation is already at its absolute worst…

You could hear a pin drop…

Wessel was recommending options to the Army Corps and stakeholders regarding the ACOE restarting discharges to the estuaries. Since the previous week’s call, due to NOAA images showing 90% of the lake covered in cyanobacteria blooms, and crisis of algae in both estuaries, the Governor and other powerful politicians asked the federal agency to temporarily stop discharges considering all options before discharging, once again.

Just the previous day, before Wessel’s comment, after viewing the putrid algal mess in the Caloosahatchee, Gov. Rick Scott called for a State of Emergency encompassing seven counties.

Some history, earlier this year, the Caloosahatchee was almost begging the South Florida Water Management District and ACOE for water, but was denied. Now the Caloosahatchee is receiving so much water, with algae to boot, that they are experiencing a toxic summer similar to what the St Lucie experienced in 2016. The Caloosahatchee has had it especially tough this year.

The elephant in the room, or perhaps better described as the Tyrannosaurus rex in the room, is that with Lake Okeechobee over 14 feet, and the fact that we are now approaching the most turbulent part of hurricane season, the ACOE “has to start releasing again,” like now! And everybody knows this.

Therefore, Rae Ann was looking for options, for sharing adversity, and this was fair as the Calloosahatchee has bore most of the adversity this year. She wasn’t talking about flooding the cities in the EAA, she was inquiring about flooding the fields, by less than a foot of water that would evaporate quickly at that extension and depth, maybe stressing but not killing the crops. Sugarcane in particular, is a hardy and durable crop for intermittent periods of water.

Shared adversity… Certainly, the estuaries have have their “fair” share…

So why does the ACOEhave to dump to the estuaries? Why is it taboo to talk about flooding the fields? Because although the 2008 LORS talks about shared adversity the EAA is federally protected by an older and more important document. 

The ACOE in not a teacher picking favorites, they are the military taking orders from Congress.

The federal “law,” connected to the Central and South Florida Project (http://141.232.10.32/about/restudy_csf_devel.aspx) is complex, but perhaps best explained by sharing an excerpt from the book, River of Interests, by the Army Corp of Engineers. Page 35, discusses the 1948 Central and South Florida Project, what it did, and requires of the ACOE.(http://sccf.org/downloadable-files/5b465bf85f38152b048d1cce.pdf)

First, the Corps would build a levee from northwest Palm Beach County to the south of Dade County along the east coast, thereby preventing flooding from the Everglades to the coastal communities. Second, the Corps would modify control facilities and levees around Lake Okeechobee in order to create more water storage, and it would increase the discharge capacity from the lake in order to prevent flooding. Third, the Corps would create three water conservation areas in Palm Beach, Broward and Dade counties for water storage. Fourth, the Corps would construct canals, levees, and pumping stations to protect 700,000 acres of agriculture south of Lake Okeechobee in Palm Beach, Hendry, and Glades counties, known as the Everglades Agricultural Area (EAA). Fifth, the Corps would build canals and water control structures to handle drainage in Dade, Broward, Palm Beach, Martin, and St. Lucie counties.

This bolded section is the key, this is why Rae Ann Wessel’s question rung so loudly in the silence of the ACOE call. For the ACOE, it is “understood,” that no matter the case, even with LORS, and in spite of “shared adversity,” that 700,000 acres of agriculture fields, south of Lake Okeechobee is to be protected from flooding destruction.

But as we all know, nothing lasts forever.

Just like other laws of our great county, some do, indeed over time, become outdated for the times. Things change. Among other issues, in 1950, when the Central and South Flood Project law was structured and voted upon to protect the crops in the EAA as part of flood control  2.81 million people lived in Florida. Today, 20 million people reside here. In the old days, the discharges did not have the impact as they do today, the rivers were healthier, and the Lake, it wasn’t so polluted. But now, seventy years later, water quality, pollution, and human health issues have risen to a point of question. “In emergency situations”, is discharging cyanobacteria water from Lake Okeechobee into the now heavily populated areas along the estuaries to prevent flooding of the Everglades Agricultural Area in the state’s best interest, or is it archaic, like the T-Rex in the room?

It might be time to re-evaluate South Florida’s greatest taboo.

-Above aerials: Caloosahatchee algae bloom 7-6-18, photo courtesy pilot Dave Stone.

What is the Everglades Agricultural Area: https://en.wikipedia.org/wiki/Everglades_Agricultural_Area

Gov.Rick Scott State of Emergency proclamation: https://www.flgov.com/2018/07/09/gov-scott-issues-emergency-order-to-combat-algal-blooms-in-south-florida/

SCCF: (https://fortmyersbeach.news/rae-anne-wessel-of-sanibel-captiva-conservation-foundation/)

What are the ACOE Periodic Scientists Calls? Former blog post 2014: https://jacquithurlowlippisch.com/2014/03/06/the-acoes-periodic-scientists-call-and-the-indian-river-lagoon/

Paynes Prairie ~A Lake With a Road Through It…

I remember my historian mother telling me that Paynes Prairie was once a giant lake and that in the mid-1800s, before a sinkhole drained the lake, famed pioneer and pineapple farmer, Capt. Thomas E. Richards sailed from the St Johns River, in Jacksonville, over the lake, only to wind up at the Indian River Lagoon in Eden, near today’s Jensen.

Well this past Friday, on my way to Gainesville for the “Future of Florida Summit” (http://www.futureoffloridasummit.com) Paynes Prairie looked like it had become a lake once again. Although it is not a truly a lake any longer, it must be flooded as the prairie’s water levels go up and down.

As my grandparents lived in Gainesville and I graduated from UF, I have driven across the prairie many times, but seeing it from the air “all wet looking” really took me aback.  Like a miniature Tamiami Trail, one could see Highway 441 going right through this “lake!”

Apparently in 2000, eco-underpasses were installed as it has been widely documented that thousands of animals, mostly reptiles, have been killed on this road. And yet, many animals, reptiles and other, continue to be killed.

I know it would be expensive, but since transportation is perhaps one of the most highly funded of all state departments, in the billions and billions of dollars, and since Florida’s wildlife and natural lands rank as a portion of the state’s number one economic driver, tourism… could not, over time, Hwy. 441 become more like the Tamiami Trail is becoming, more bridged than flat…

It just doesn’t make sense to have a lake, or an Everglades, with a road through it.

Ed and I, a selfie on the way to Gainesville

A rainbow in the sky

Links:

Paynes Prairie website: web site: https://www.floridastateparks.org/park/Paynes-Prairie

Good historical article on Paynes Prairie: Chicago Tribune1991:http://articles.chicagotribune.com/1991-12-29/travel/9104260758_1_wild-horses-bison-spanish-florida

FDOT http://www.fdot.gov

2017-18, Funding for FDOT, state of Florida: https://www.bizjournals.com/jacksonville/news/2017/02/01/see-which-local-highway-port-programs-just-got.html

Abstract, animal mortality along 441 in Paynes Prairie and eco-underpass: http://www.jstor.org/stable/24321153

Documenting the Discharges 11-19-17, SLR/IRL

Last Thursday on November 16, the ACOE reported they will reduce the amount of water they are releasing from Lake Okeechobee. The Corp had been releasing at a high rate, on and off, since September 20th. New targets are 2800 cfs east and 6500 cfs west.

Photos below were taken yesterday, 11-19-17 by my husband, Ed Lippisch. We will continue to document the discharges from Lake O, and area canals.

As Thanksgiving approaches, we are thankful the discharges are lessened and that the SFWMD and the public are working hard to plan the EAA Reservoir Senator Negron fought for… We the people of Martin County, will not be satisfied until these discharge stop. The river has its hands full with unfiltered discharges draining agriculture and developed lands from C-23, C-24, C-25 and C-44. All must be addressed.

“And where the river goes, every living creature that swarms will live, and there will be very many fish. For this water goes there that the waters of the sea may become fresh; so everything will live where the river goes…” Ezekiel 

St Lucie Inlet, Sailfish Point R, Jupiter Island L, and Sewall’s Point and mainland Stuart in distance.

Sewall’s Point

Manatee Pocket

Hell’ s Gate Sewall’s Point to right

C-23 main SLR

Confluence of SLR/IRL at Sewall’s Point’s southern tip

Sewall’s Point

IRL looking towards Sewall’s Point and Stuart. Incoming tide pushes plume waters north into IRL

somewhere looking down…

SFWMD canal and basin map. C-44 canal is the canal most southerly in the image and was connected to Lake O in 1923. C-23, C-24 and C-25 were built later in the 50s as part of the Central and South Florida Project that over-drianed South Florida causing many of the water problems we live with today.

Atlantic ocean off Jupiter Island, plume water moving south over nearshore reefs

IRL near Sailfish Flats where seagrass forests used to flourish housing many fish…

Hutchinson Island looking to IRL

Roosevelt Bridge SLR

C-23 SLR

Documenting the Discharges 11-8-17, SLR/IRL

A lone sailboat is a sea of blackness, confluence of the St Lucie River/Indian River Lagoon, once considered the most biodiverse estuary in North America and full of seagrasses, a nursery for the ocean..
http://w3.saj.usace.army.mil/h2o/plots/s308h.pdf
I am very fortunate to have a small army of people helping me document the  Lake Okeechobee discharges this year. Presently, it  is the tremendous rate of government sponsored discharge from Lake O that is destroying the regions’ economy and ecology, right before our eyes, ~once again.

Friends of my husband, pilots Dave Stone and Scott Kuhns, took these aerials yesterday, 11-8-17 around 5 pm. When I asked Scott about the plume, he relayed that it went 15 miles south almost all the way to Jupiter Inlet, and since there is also rain driven, fresh, dark- stained water flowing out of the Jupiter Inlet (not over-nutrified, black-sediment water from Lake O) there was no clear delineation of blackened plume to aqua ocean water, like usual–rather, the waters are all dark….

“How far did the plume go east from the St Lucie Inlet?” I asked. “From the coast, as far as the eye could see…”

End of plume, near Jupiter Inlet
Another angle end of plume near Jupiter Inlet
Up close of a boat in the plume. Look at the sediment! Covering what once was seagrasses and killing our near shore “protected” reefs.
Plume in black water. Brown on black. The ocean? You’d think it was an oil spill.
Plume as seen at mouth of St Lucie Inlet near multi million dollar homes in Sailfish Point.
Plume at mouth of St Lucie Inlet on south side as seen against Jupiter Island’s state park/Jupiter Narrows.
A lone sailboat is a sea of blackness, St Lucie River/Indian River Lagoon, once considered the most biodiverse estuary in North America and full of seagrasses, a nursery for the ocean.
Plume exiting St Lucie Inlet
The north Jetty at the St Lucie Inlet with plume waters going into the Atlantic Ocean. The plume goes east for many miles.

http://w3.saj.usace.army.mil/h2o/reports.htm–cfs over 4000 has been going on for weeks. A total blowout.
 

Lake O is connected to the St Lucie through the C-44 canal.
*Lake O level:http://w3.saj.usace.army.mil/h2o/currentLL.shtml

*The ACOE has been discharging from Lake O since Hurricane IRMA hit on Sept 2oth, 2017. The rate of discharge has gone up and down, however increasing over recent weeks. Word is the St Lucie could be dumped on for many more months, possibly through the end of the year. So don’t count on taking your visiting relatives out fishing this holiday season even though you moved here for the water. This ecological disaster is finally seeing light at the end of the tunnel as Senator Joe Negron, alongside the public, and “River Warrior” groups, particularly Bullsugar, has pushed so hard  that the SFWMD and ACOE are finally working  towards building an EAA Reservoir that will begin the long journey of changing water drainage culture in South Florida, and “sending the water south.” Please get involved and learn more by viewing this SFWMD EAA RESERVOIR website:https://www.sfwmd.gov/our-work/cerp-project-planning/eaa-reservoir

*Thank you to the people, and the children, groups such as the C4CW, Rivers Coalition, grandparents’ HOA email chains, leadership at Martin Health System, and to the those working for the agencies trying to help the St Lucie. As the River Kidz say: 

Documenting the Discharges, 10-29-17, SLR/IRL

These aerial photos over the St Lucie Inlet were taken by my husband, Ed Lippisch, Sunday, October 29, 2017, at 1:45pm. 

The number one issue here is the polluted waters of Lake Okeechobee being forced into the SLR/IRL because they are blocked by the Everglades Agricultural Area from going south. 

The ACOE has been discharging Lake O waters into the St Lucie since mid-September. These over-nutrified and sediment filled waters continue to destroy our economy and ecology on top of all the channelized agricultural and development waters of C-23, C-24 and C-25. Stormwater from our yards and streets also adds to this filthy cocktail. 

Near shore reefs, sea grasses, oysters, fish? A human being? Better not have a cut on your hand…Not even a crab has an easy time living in this.

We move forward pushing the SFWMD and ACOE for the EAA Reservoir with these sad photos and the fact that our waters are putrid at the most beautiful time of year as motivation. We will prevail. One foot in front of the other. 

Save the St Lucie! Save the Indian River Lagoon!

Links to ACOE website: See S-80 & S-308, others intesting too. Northern waters should also be cleaned! http://w3.saj.usace.army.mil/h2o/reports.htm

Lake O is Coming Down, So When Will the Discharges Stop? SLR,IRL

Say No to Lake O

“Say No to Lake O,” this is one of the rallying cries of the River Kidz. If only it were as easy as just saying “no.” According my numbers-man, my brother Todd, the “St Lucie River has taken in more than 86+ billion gallons this year, enough to put Stuart under 111 feet of water. This is only enough to take 6 inches off of the lake.” The west coast is taking most of the lake level reducing water and of course they are screaming “say no to Lake O” too.

Eco-Voice, present west coast advocacy, 10/17.
Realistically, with the Army Corp of Engineers reporting the Lake level at 17.07, today, it will be a few more weeks of releases to get near or under 16 feet. A safer number for the dike and for the people who live in fear of it breeching.  Not to mention the 525,000 of acres of protected sugarcane… http://w3.saj.usace.army.mil/h2o/reports.htm

Black Gold, the muck soils south of Lake Okeechobee. (Photo JTL, 2014.)
I do believe the authorities are getting the message, though…so keep screaming. SAY NO TO LAKE O! For everyone!

I think our water culture is changing, and the government is being forced/inspired so they can get reelected and respected…. to improve our water/rivers situation. Just yesterday, I got an email about a woman whose Bascom Palmer doctor notes she has an eye infection in her cornea very possibly from “walking the bridge,” repeatedly over the St Lucie River.

I am not making this up.

These health issues are real. More and more people are realizing this. Lake O and other canal unfiltered pollution must halt.

Here is a blog post I wrote earlier this year where Rob Lord, lawyer, business man, CEO of Martin Health discusses health issues https://jacquithurlowlippisch.com/tag/robert-lord/

So it looks like the Lake Okeechobee is going down, but we are still going to get releases for while. (See the info below on my brother’s site.)  Things are still bad, but they are getting better.

~Never stop screaming “Say No to Lake O,” we owe it to ourselves, and to the future.

Hydro. Lake is going down.
_________________________________________________________________

Great information below!

Jacqui,

It looks link the lake is coming back down. See the graph links on my Firm Favorites Page:

SFWMD & ACOE
Lake O Stage Graph Month (http://my.sfwmd.gov/dbhydroGraph/servlet/DbhydroGraphServlet.do?v_report_type=format6&v_period=month&v_end_date=20171003&v_start_date=20170901&v_dbkey=15611/06832/N3466)

It’s hard believe that we have taken 86+ billion gallons this year, enough to put Stuart under 111 feet of water. But this is only enough to take 6 inches off of the lake. The west coast is taking most of the lake level reducing water.

St Lucie River Discharges
S-80 Cumulative Total 2017 | 2016 (http://www.thurlowpa.com/LakeOLiveData/2017/) (http://www.thurlowpa.com/LakeOLiveData/2016/)

By the way, I have a new link of my Lake O Satellite imagery page that will actively pull up the last 7 days of low res images from all three satellites:
St Lucie River Discharges
Latest Lake O Satellite Imagery (http://www.thurlowpa.com/LakeOImagery/)
Click on the “Terra/Aqua/Suomi Last 7 days icon”.

Best regards,

Todd

Thomas H. Thurlow III
THURLOW & THURLOW, P.A.
17 Martin L. King, Jr. Blvd.
Suite 200
P.O. Box 106
Stuart, FL 34995-0106
Phone: (772) 287-0980
Facsimile: (772) 220-0815
Email: todd@thurlowpa.com
Web: http://www.thurlowpa.com

ACOE breaks 6000 cubic feet per second, slaughtering the St Lucie River/Indian River Lagoon

The following is a texting conversation between my brother, Todd, and me, just over an hour ago.  As you can see, Todd keeps me in real-time. Now, I wish to share with you.

Todd: Hi Jacqui, looks like it’s “balls to the wall” —like the old jet fighter saying.
Lake O is at 17 feet and rising…


Jacqui: Holy —! Didn’t Gary Goforth say the max for S-80 is 12,000 CFS? How much is this?

Todd: This is normal high-end. ~4000 cfs. In 2004-2005 it looks like they maxed at 5-6000cfs. I’ll graph against the lake stage.

Jacqui: How do u know it’s 4000? I see nothing posted 4 today on ACOE site.

Todd: My app and links on my website. http://w3.saj.usace.army.mil/h2o/reports/DssWeb/rtcomps/basins/Okeechobee.htm

Jacqui: Thx that  ACOE Jacksonville Lake O site doesn’t show, will go to http://www.thurlowpa.com/news.htm


Todd: S-80 hit 6,727 cfs on 10/06/2004. The lake was at 17.86 and rising it peaked at 18.02 on 10/13/04.

Hurricane Jeanne had hit days earlier on Sept. 25

Jacqui: I remember that. Bad.

Todd: Also. The 4000+ right now is instantaneous. The stats you always see are a mean for the day. Right now that are piling between 1000cfs and the high 5000s. It looks like they did almost hit 6000 earlier today.

Pulsing not piling.

Jacqui: Awful. I think it stinks that unless you know how to access all the technology, you  don’t  know the river is getting slaughtered until the following days. A nightmare. Thanks Todd. Goodnight.

“Billions of gallons of fertilizer, sewage, and legacy pollution from Lake Okeechobee are spewing into the St. Lucie River/Indian River Lagoon…”

“Right now billions of gallons of fertilizer, sewage, and legacy pollution from Lake Okeechobee are spewing into the St. Lucie River, carrying a new threat of toxic algae. Water managers may say Irma left them no choice, but of course that’s a half-truth…” 

*Previous paragraph shared with permission from Bullsugar.org. Please read the rest of Peter Girard’s post here: (http://www.bullsugar.org/eaa_reservoir_plan_needs_sfwmd_model)

Link: (https://www.youtube.com/watch?v=izaNH73GPoI)

Link:(https://www.youtube.com/watch?v=WMkyBDq-4QE)

All photos/videos  taken off St Luice Inlet September 30, 2017 JTL/EL

Documentation of primary and secondary plumes at St Lucie Inlet caused predominantly from human directed ACOE/SFWMD discharges post Irma and other from Lake Okeechobee & canals C-44, C-23, C-24, C-25. 10am, September 30, 2017. Primary plume out 3 miles; secondary 3 1/2 and not quite south to Peck’s Lake. We must continue to #ReplumbFlorida #forthefuture #forthewildlife #forthekidz #fortheeconomy for our #indianriverlagoon JTL/EL

Irma’s Waters Ravage the St Lucie River/Indian River Lagoon, SLR/IRL

Hurricane  Irma may be gone, but her waters are not. Our now black river and the giant plume off the St Lucie Inlet attest to this. Clean rain that fell in our region during the hurricane is now filthy “stormwater” discharging, unfiltered, through manmade canals C-23, C-24, C-25, and C-44.  Nature did not design the river to directly take this much water; this much water kills.

Every plume looks different, and this one is multilayered with no clear border. Sediment soup, black-brown in color, yesterday it extended out about 2/3 of a mile into a stirred up Atlantic and flowed south, in the rough waves not quite having made it to Peck’s Lake.

Since Hurricane Irma’s rains, area canals dug with no environmental foresight in the 1920s and 50s for flood control, and to facilitate agriculture and development, have been flowing straight into the river. On top of this, in anticipation of the hurricane, three days prior to IRMA the Army Corp of Engineers began discharging from Lake Okeechobee. During the hurricane they halted, and then started up again at high discharge levels reaching over (4000 cfs +/-) this past Friday, September 15th. As Lake Okeechobee rises and inflow water pours in from the north, and is blocked by the Everglades Agricultural Area in the south, we can expect more Lake O discharge on top of the canal releases themselves.

As advocates for the St Lucie River we continue the fight to expedite the building of the EAA reservoir and to create a culture to “send more water south.” In the meantime, we, and the fish and wildlife, and the once “most bio diverse estuary in North America,” suffer…

Links to lake O level and canal flows are below.

Lake Okeechobee level, 9-18-17: 15.50, http://w3.saj.usace.army.mil/h2o/currentLL.shtml

S-308 Lake O:http://w3.saj.usace.army.mil/h2o/plots/s308d.pdf

S-80 C-44 Canal:http://w3.saj.usace.army.mil/h2o/plots/s80d.pdf

C-23/S-97; C-24/S-49, & C-25/S-50: (click on highlighted S # arrow corresponding to canal to see discharge into river; for instance, C-23 is released through “S,” structure 97, so click on S-97 to see flows for C-23 canal) http://my.sfwmd.gov/portal/pls/portal/realtime.pkg_rr.proc_rr?p_op=FORT_PIERCE

My brother Todd, has complied many other links on his website’s favorites under St Lucie River and ACOE/SFWMD: http://www.thurlowpa.com/news.htm

Post Irma flight over St Lucie River/IRL 9-17-17

SFWMD canal and basin map. C-44 canal is the canal most southerly in the image. All canals shown here discharge into the SLR/IRL.

The confluence of the St Lucie River and Indian River Lagoon at Sewall’s Point, an area once full of seagrasses and fisheries and formerly considered the heart of “the most bio diverse estuary in North America.”

Waves in plume breaking over offshore reefs; looking north to Hurchinson Island.

Southern edge of plume along Jupiter Island and Jupiter Narrows south of St Lucie Inlet.

Looking south off St Lucie Inlet.

South edge of plume looking south towards Jupiter Island.

JTL 9-18-17

Water Quality Assessment of the St. Lucie River Watershed – Water Year 2017 – DRAFT- Gary Goforth, P.E., PhD. SLR/IRL

Dr. Gary Goforth ready to tour the SLR & Lake O.

It is a journey the state, federal, and local agencies don’t always wish to take–a journey to face the numbers of our watershed…

Today, Dr Gary Goforth (http://garygoforth.net) shares his most recent report, “Water Quality Assessment of the St Lucie River Watershed, For Water Year 2017, DRAFT.”

Mind you, for non-scientist people like myself, a “water year” is reported from May of one year, through April the next year, as opposed to a calendar year.

The full report is linked at the bottom of the post and contains numerous helpful charts. I have just included the key findings below.

Dr Goforth wanted to get the draft assessment out before the Florida Department of Environmental Protection’s  Basin Management Action Plan workshop scheduled for this Friday Aug. 25th at 10:00 am at Martin County Building Permits Office, 900 Southeast Ruhnke Street, Stuart, FL 34994, Conference Rooms A & B because this is where the rubber hits the road! FDEP: (http://www.dep.state.fl.us/central/Home/Watershed/BMAP.htm)

Reflections in the St Lucie River, JTL

Water Quality Assessment of the St. Lucie River Watershed –Water Year 2017 – DRAFT Gary Goforth, P.E., Ph.D.

Quis custodiet ipsos custodes? (Who watches the Watchers?)

Key Findings:
1. Over the last water year (May 2016 – April 2017), the surface water entering the St. Lucie River and Estuary (SLRE) in general was of poor water quality. The best water quality entering the SLRE was from the highly urbanized Tidal Basins. The largest source of phosphorus, nitrogen and sediment pollution to the SLRE was Lake Okeechobee discharges. The C-44 Canal Basin contributed poor water quality, and was the only basin demonstrating a worsening in water quality over the last ten years.

2. It was estimated that stormwater runoff from agricultural land use contributed more flow and nutrient pollution than any other land use, even contributing more flow than Lake Okeechobee discharges.

3. The annual Basin Management Action Plan (BMAP) progress reports produced by the Florida Department of Environmental Protection continue to indicate water quality conditions in the tributaries of the SLRE are better than they actually are. Examples of flaws in the BMAP assessment process include the omission of Lake Okeechobee pollution loads, the use of simulated data instead of observed data, the inability to account for hydrologic variability, and the inability to assess individually each of the major basins contributing to the SLRE.

4. An alternative to the assessment approach presented in the BMAP progress reports was developed and used to evaluate water quality conditions of major inflows to the SLRE and to assess progress towards achieving the Total Maximum Daily Load (TMDL) load reduction goals. This alternative approach uses observed data, includes Lake discharges, accounts for hydrologic variability, and is applied to each of the major basins contributing pollution loads to the SLRE. For WY2017, observed nitrogen loads to the SLRE exceeded the Phase 1 BMAP target loads (adjusted for hydrologic variability) by 77 percent. Observed phosphorus loads exceeded the Phase 1 BMAP target loads (adjusted for hydrologic variability) by 53 percent.

5. The largest single source of total nitrogen, total phosphorus and sediment load to the SLRE was Lake Okeechobee discharges. In addition, total phosphorus concentrations in Lake Okeechobee discharges to the SLRE remained almost four times the lake’s TMDL in-lake target concentration of 40 parts per billion (ppb). In 2017, the South Florida Water Management District (SFWMD) reported that phosphorus loading to the lake from surrounding watersheds was almost 5 times the Lake’s TMDL of 105 metric tons, yet staff acknowledged the agency does not enforce permits that set numeric limits on phosphorus discharges to the lake[1] (SFWMD 2016, SFWMD 2017). Unfortunately, despite the continued and well-publicized pollution of the lake, the Florida legislature in 2016 enacted a water bill that pushed back deadlines for achieving the lake’s TMDL by decades (Ch. 2016-1).

6. The best water quality entering the SLRE during WY2017 was observed in the highly urbanized Tidal Basins, with concentrations of 97 ppb and 819 ppb for TP and TN, respectively. Each of the remaining source basins, except the C-44 Canal Basin[2], exhibited a slight improvement in nutrient levels compared to their base periods, however, collectively these WY2017 loads did not achieve the alternative BMAP Phase 1 load target (Figures ES-1 and ES-2). The C-23 and Tidal Basins met the alternative BMAP Phase 1 target for TP, while the C-23, C-24 and Tidal Basins met the alternative BMAP Phase 1 target for TN. The predominantly agricultural C-44 Canal Basin exhibited poor nutrient conditions, and in fact, continued a trend of deteriorating nutrient conditions compared to its 1996-2005 base period. As a whole, the water quality entering the SLRE remains poor, although a slight improvement over the 1996-2005 period was observed.

FULL REPORT below: the complete report can be seen/downloaded from Dr Goforth’s website under “Estuaries and Lake Okeechobee:” http://www.garygoforth.net/DRAFT%20-%20Water%20Quality%20Assessment%20of%20the%20SLRW%20-%20Water%20Year%202017.pdf

Dr Goforth’s website:(http://garygoforth.net)

Army Corp of Engineer Structure S-80 releases water from Lake Okeechobee in the the C-44 Canal that leads to the St Lucie River. JTL

Lake Okeechobee.

basins of SLR/IRL SFWMD


The Everglades’ Boundary of 1910, and Today’s Toxic Lake Okeechobee, SLR/IRL

Historic map, Palm Beach Farms Company Lands ca. 1910 showing “edge of Everglades.”  Archives, Lawrence E. Will Museum of the Glades, Belle Glade, Fl.

Looking back gives us perspective when looking forward.

This old map showing the Palm Beach Farms Company Lands is interesting as is shows where people saw the “edge of the Everglades” when they were first developing around 1910.

Today it is hard to judge where we are and what “was” the Everglades…Some of us are literally “in it.”

Looking back, it is easy to see how  after over 100 years the waters of Lake Okeechobee are becoming more and more “toxic.” Kind of like a fish tank that can never be cleaned out….

One has wonder if the developers of the Everglades ever considered what would happen to the lake by building and developing farm lands right in the way of the natural flow, and then really blocking it by eventually putting a dike around the lake? In this map, the push was to develop lands further west beyond the eastern ridge…Think all all the development today out west beyond the ridge and into the historic Everglades!

Perhaps in their wildest dreams the early developers  would have never envisioned how many people live in south Florida today. Maybe they didn’t care. In any case, today we all here in South Florida are connected somehow to Lake Okeechobee, Florida’s  “liquid heart,” for drinking water, recharge, recreation, property values, and our health.

Over our history the human spirit has overcome greater threats than toxic algae; I am confident we will once again.

SFWMD satellite map South Florida. Red lines denote historic Everglades.

SFWMD

Lake O eastern shoreline, Port Mayaca, 7-21-17, JTL

Lake O, 7-21-17


LINKS:

Lawrence E Will Museum of the Glades: https://www.museumoftheglades.org

https://www.facebook.com/lawrenceewillmuseum/

Lake O acres today?/451,000: http://www.lakelubbers.com/lake-okeechobee-107/

Township and Range? the squares: http://www.jsu.edu/dept/geography/mhill/phygeogone/trprac.html

Palm Beach Farms Company Lands-History (-bottom of blog by Ginger Peterson, Boyton Historical Society: http://www.jsu.edu/dept/geography/mhill/phygeogone/trprac.html

Goforth Graph Showing C-44 Basin Runoff into Lake Okeechobee, 2017, SLR/IRL

In recent years we along the St Lucie River/Indian River Lagoon have been screaming because the ACOE and SFWMD have been discharging water from Lake Okeechobee and the C-44 basin into our waterways causing destructive toxic algae blooms and other issues to our area …

This year some are screaming because C-44 basin runoff water in southern Martin County is being pumped back into Lake Okeechobee. Yes, C-44 is “running backwards.” It’s a crazy world here in South Florida even through the water managers are working hard at “getting the water right…”

So two odd things are going on right now. First, water is being sent into Lake O from the C-44 canal as we were in a long-time drought, and also, now, water is being back-pumped into the lake from the south to help alleviate flooding in the Water Conservation Areas— as it has rained so much recently “down there.” This whole situation is exacerbated because the EAA,  in the middle, “is kept dry to protect the property of the agricultural industry and safety of communities south of the dike.”

SLR basins. C-44 and surrounding man-made basin is in pink. This is the area that is being back pumped into Lake O as the lake has been low due to drought. But area rains in southern Water Conservation Areas are so full water “cannot be sent south…” South Florida Conundrum…SFMWD, 2017.
The graph and short write-up below are from friend and engineer Dr Gary Goforth. The graph “shows” the C-44 basin runoff (see image above) being sent to Lake Okeechobee in 2017 compared to other years since 1980 (other than ’81) “is at 100%.”

I have also included some articles and images on the other “back into Lake O” subject. Back-pumping was made illegal in the 1990s, but is allowed under certain circumstances such as endangering communities and agriculture in the EAA, and danger to wildlife in the conservation areas due to flooding…All of this is “back-pumping” not good for the health of the lake. In all cases, it is helping one thing while hurting another…

One day we will have to truly get the water right. Images below may help explain things.

ISSUE OF BACK-PUMPING:

This satellite photo shows water on lands in 2005. One can see the lands in the EAA are devoid of water. This water has been pumped off the lands into the Water Conservation Areas, sometimes back pumped into the lake, and also stored in other canals. *This slide is similar to what is going on today in June of 2017. Wildlife is drowning in the Water Conservation Areas (south of EAA) while the Everglades Agricultural Area is pumped dry to protect agriculture. (just south Lake O) Crazy. (Captiva Conservation 2005.)
ISSUE OF C-44 CANAL BASIN WATER BEING SENT INTO LAKE O RAHTER THAN TO SLR:

” For the period 1980-2016, about 32% of the C-44 Basin runoff was sent to the Lake, while 68% was sent to the St. Lucie River and Estuary. Historically (i.e., before 1923) virtually none of the C-44 Basin runoff went to the St. Lucie River and Estuary: some went to the Lake, some went to the Loxahatchee River and some went north to the St. John’s River. So far in 2017, virtually all of the basin runoff has been sent to the Lake.”

Gary Goforth (http://www.garygoforth.net)

6-28-17 JTL

___________________________________________

ARTICLES ON C-44 INTO LAKE O & BACK-PUMPING INTO LAKE:

Why is C-44 flowing backwards, JTL: https://jacquithurlowlippisch.com/2017/06/13/why-are-c-44-and-s-2-flowing-backwards-into-lake-okeechobee/WPTV Back Pumping Concerns: http://amp.wptv.com/2248571360/lake-okeechobee-back-pumping-concers.html

TCPalm:  Back-pumping into L.O. http://www.tcpalm.com/story/news/local/indian-river-lagoon/health/2017/06/27/south-florida-water-management-district-backpumping-into-lake-o/431280001/

CBS12: http://cbs12.com/news/local/water-managers-begin-back-pumping-to-address-high-water-emergency

Map south of Lake O. showing EAA, STAs, and WCAs. (Map Everglades Foundation, public)

Deadlines for EAA Reservoir and SB10, SLR/IRL

Aerials of A-1/A-2 region of the EAA, JTL/EL 2017

The following is a handout Mark Perry of Florida Oceanographic passed out yesterday at the Rivers Coalition meeting. It is created by John Ullman of the Florida Sierra Club and gives clear presentation on what is necessary for the EAA Reservoir and SB10’s success. I am reprinting here as a resource and reference. Getting the legislation passed for Senate Bil 10 was just the beginning. As we know, for the reservoir to come to fruition we must be diligent over the coming years.
Notice the July 1st, 2017 deadline for the SFWMD to”request that the US Army Corps jointly develop a post-authorization change report for the Central Everglades Planning Project to revise the A-2 parcel element of the project.”
Relationships with the District continue to be strained; a nice phone call or email to Executive Director Peter Antonacci or board member would prove helpful. We must rebuild relationships for future success. We all do have a common goal, clean water for Florida.

http://my.sfwmd.gov/portal/page/portal/xweb%20about%20us/executive%20management

SIERRA CLUB, FLORIDA’S SB10 Blog-by John Ullman
SB10, Important Deadlines:

By July 1, 2017 SFWMD must request that the US Army Corps jointly develop a post-authorization change report for the Central Everglades Planning Project to revise the A-2 parcel element of the project.

By July 31, 2017, SFWMD must contact the lessors and landowners of 3,200 acres of state-owned land and 500 acres of privately-owned land just west of the A-2 parcel. SFWMD must express interest in acquiring this land through purchase, exchange, or terminating leases.

If the US Army Corps agrees to begin developing the post-authorization report, work on the report must begin by August 1, 2017.

SFWMD must report the status of the post-authorization change report to Fla Legislature by January 9, 2018.

SFWMD and Corps must submit the post-authorization change report to Congress by October 1, 2018.*

The House passed the measure with a 99-19 vote; the Senate passed it 33-0.

The Governor signed SB 10 into law on May 9, 2017

Details of SB 10:

• Accelerates the state’s 20-year goal of storing water south of Lake Okeechobee.

• Requires SFWMD to develop a project plan for an Everglades Agricultural Area (EAA) Reservoir that provides at least 240,000 acre-feet (about 78 billion gallons) of water storage by utilizing the A-2 parcel (14,000 acres of state-owned land), land swaps, early termination of leases, and land acquisition.

• Provides for at least two-thirds of the water storage capacity of the Comprehensive Everglades Restoration Plan (CERP) Component G.

• Allows the A-1 parcel to remain a Flow Equalization Basin (FEB) as provided for in the Central Everglades Planning Project (CEPP), or to be utilized for the EAA Reservoir if SFWMD can provide for at least 360,000 acre-feet of water storage.

• Requires SFWMD to include increased canal conveyance improvements, if needed, and features to meet water quality standards in the EAA Reservoir project.

• Provides deadlines for submitting the plan to Congress as a post-authorization change report, which will seek approval of the use of the A-2 parcel in a different manner than was authorized in CEPP.

• If the Corps has not approved the post-authorization change report and submitted it to Congress by October 1, 2018 or the post-authorization change report is not approved by Congress by December 31, 2019, SFWMD must request the Corps to develop a project implementation report for the EAA Reservoir Project located somewhere else.

• Prohibits the use of eminent domain to obtain privately held land.

• Provides for termination of the U.S. Sugar option agreement prior to the October 2020 expiration date if the post-authorization change report receives congressional approval or SFWMD certifies to the Board of Trustees of the Internal Improvement Trust Fund, the President of the Senate, and the Speaker of the House that acquisition of the land necessary for the EAA reservoir project has been completed.

• Authorizes the use of Florida Forever bonds in an amount of up to $800 million for the costs of land acquisition, planning and construction of the EAA reservoir project.

• Appropriates $30 million from the Land Acquisition Trust Fund (LATF) to the Everglades Trust Fund, in the 2017-18 fiscal year, for the purposes of acquiring land or negotiating leases to implement or for planning or construction of the Everglades Agricultural Area reservoir project.

• Appropriates $3 million from the LATF to the Everglades Trust Fund in the 2017-18 fiscal year for the development of the CEPP post-authorization change report.

• Amends the LATF distribution to include $64 million of additional funding for the EAA reservoir project.

• Appropriates $30 million from the General Revenue Trust Fund to the Water Protection and Sustainability Program Trust Fund to provide a loan for implementation of Phase I of the C-51 reservoir project.

• Appropriates $1 million from the LATF to the Everglades Trust Fund in the 2017-18 fiscal year for the purpose of negotiating Phase II of the C-51 reservoir and provides the LATF as a potential funding source for the implementation of Phase II of the C-51 reservoir.

• Creates the water storage facility revolving loan fund and requires the Department of Environmental Protection (DEP) to adopt rules for its implementation.

• Creates the Everglades Restoration Agricultural Community Employment Training Program within the Department of Economic Opportunity (DEO) to provide grants to stimulate and support training and employment programs that seek to re-train and employ displaced agricultural workers.

• Requires SFWMD to give preferential hiring treatment to displaced agricultural workers, consistent with their qualifications and abilities, for construction and operation of the EAA reservoir project.

• Terminates the inmate labor work program on state-owned lands in the EAA.

The post-authorization change report must be approved by Congress by December 1, 2019.*

*If these two deadlines are not met (and no extension is granted), then the SFWMD must request that the Corps initiate the planning for the EAA Reservoir project that will result in a new Project Implementation Report (PIR) and may continue to build CEPP components as planned in the 2014 PIR.

Posted by Jon Ullman, May 2017, Sierra Club blog
Sierra Club Florida website:http://www.sierraclub.org/florida

JTL 6-23-17

“Go West Young Man! Go West?” St Luice River/Indian River Lagoon

Poppleton Creek and St Lucie River, April 17, 1952, courtesy archives Sandra Henderson Thurlow.

This remarkable 1952 historic aerial photograph shows Poppleton Creek and what were once pioneer Hubert Bessey’s lands near Downtown Stuart. Within the bucolic photograph early stages of C-23’s white sands, as seen piled on the land in the upper right hand corner of the photograph, foreshadow the river’s future. This canal divides Martin and St Lucie County and is considered the “most polluting,” excluding C-44 when open for Lake Okeechobee.

Looking across the beautiful St Lucie River we see in the distance the virgin pinelands and wetlands of parts of today’s Palm City. Interestingly,  if one continues west one will stumble upon the proposed lands to be developed by the Kiplinger Family, Pineland Prairie.

Go west young man, go west?

Time shall tell…

If we do, we may have more regard for the land than we did in 1952 and bring relief to the river that brought development and love of our area here in the first place.

You can use Poppleton Creek on the right as a reference point, Google Earth 2017

Google Earth image 2017.


C-23 Canal: http://www.dep.state.fl.us/southeast/ecosum/ecosums/c23.pdf

Palm City History by Alice Luckhardt: http://archive.tcpalm.com/news/palm-city-celebrates-100-years-with-look-back-at-history-events-at-floridian-photo-gallery-ep-382954-343392342.html

Kiplinger’s Pineland Prairie website: https://pinelandprairie.com

Palm City Chamber: http://www.palmcitychamber.com/history-of-palm-city.html

“Go West/Manifest Destiny: “https://en.wikipedia.org/wiki/Go_West,_young_man

6-21-17 JTL

_____________________________________________________________________

6-22-17

I am adding additional photos to this blog post for reference to questions posed. The Fairchild photos below are dated 1925 and in them you can see the white sands of the C-44 piled on the land connecting to the South Fork of the St Lucie River. The C-44 canal was built between 1915 and is documented to have opened in 1923. Dates vary by a few years depending on sources and it too was enlarged/deepened in the 40s and thereafter.


“What is that huge white stripe on the horizon??” I said. It’s looks like a giant 20-mile-long spaceship runway.

Well, it’s the spoil from the freshly-dug Okeechobee waterway. See it in the attached comparison from Google Earth.” Todd Thurlow


1925 Fairchild aerial, note white sands from C-44 canal in upper right area of photo. (Courtesy Thurlow Archives)

Another perspective showing white sands more clearly of C-44 canal linking with South Fork of St Lucie River.

My brother Todd’s Google Earth comparison showing C-44 and South Fork today. (Google/Todd Thurlow)


Aerials of Our Rain Stained Lagoon, SLR/IRL

Recently, it seems to rain almost every day!

TCPalm’s Elliott Jones reported this morning that Stuart has received a whopping 11.30 inches of rain just so far this month! (The average being 7.14.)

Although due to the recent drought, the ACOE/SFWMD are not dumping Lake Okeechobee through Canal C-44, canals C-23, C-24, C-25, and areas along C-44, as well as our own basin, are draining right into the St Lucie River/Indian River Lagoon. Very little of this water is cleansed before it enters and thus is damaging to the eco system. Next time you see water draining through a grate in a parking lot, think about this. Remember too that before the major canals were constructed the 1900s, the river received less than half the water it gets every time it rains today.

IMG_5231.JPG
SLR at “Hell’s Gate” looking at Sewall’s Point, Sailfish Point and the St Luice Inlet

photo drainage basin
Drainage changes to the SLR. Green is the original watershed. Yellow and pink have been added since ca.1920. (St Lucie River Initiative’s Report to Congress 1994.)

The aerials below were taken 6-13-17 by my husband Ed Lippisch and pilot Dave Stone. It is important to monitor the river all of the time so we can view changes.

“Rain stained” we are; please remember not to fertilize during the rainy season. The birds on Bird Island will appreciate it! (http://befloridian.org)

Canals

TC Palm, Elliott Jones, 6-19-17

Bird Island, IRL east of Sewall’s Point

Bird Island

IRL St Lucie Inlet and Sailfish Point

Sailfish Flats, IRL

Crossroads, confluence SLR/IRL off Sewall’s Point

Spoil Island off Sailfish, bird also roosting here!

Sick looking seagrass beds in IRL looking south towards Jupiter Narrows

SL Inlet near Sailfish Point, no black plume but darker colored waters

Jupiter Island’s state park at St Lucie Inlet

Sailfish Point

St Lucie Inlet looking south

inlet again

Clear ocean water at jetty, St Lucie Inlet

Looking back to St Lucie Inlet mixed colored waters but not black as with Lake O water releases

St Lucie Inlet between Jupiter Island’s state park and Sailfish Point

inlet again

Looking north to SL Inlet

Jetty

Hutchinson Island and Sailfish Flats in IRL. Sewall’s Point in distance.

Parts of the Savannas near Jensen , IRL and Hutchinson Island in distance

Savannas State Preserve Park

Canals draining water into SLR/IRL after rain events:

C-23 http://www.dep.state.fl.us/southeast/ecosum/ecosums/c23.pdf

C-24 http://www.dep.state.fl.us/southeast/ecosum/ecosums/c24.pdf

C-25 http://www.dep.state.fl.us/southeast/ecosum/ecosums/c-25.pdf

C-44 http://www.dep.state.fl.us/southeast/ecosum/ecosums/C-44%20Canal%20.pdf

Why are C-44 and S-2 flowing backwards into Lake Okeechobee? 

My brother, Todd,  wrote to me on June 8th noting that the C-44 canal was flowing westwards into Lake Okeechobee rather than dumping eastwards into the St Lucie as is standard operating procedure after a big rain…

Yes this canal, as most of the others, can “flow” in either direction, seemly “backwards.”

So how can this happen? This backwards flow?

Dr Gary Goforth says the following:

“Yes this is normal operations; generally when the Lake level is below 14 ft the Corps leaves the locks at S-308 wide open which allows any local runoff to flow into the lake.”

Another way Lake Okeechobee can receive water in an unusual way is if the water is pumped into it–back pumped. This has recently been done from the EAA. Back pumping into Lake O has been outlawed, but it is allowed if communities or farmland would flood.

According to an exchange yesterday on Facebook, with  Audubon’s Dr Paul Grey:

“St Lucie (C-44) backflows are just one of many southern inflows now, S-2 is backpumping, three other southern outlets are flowing backward into the low lake (L-8, S354, S-352) the Caloosahatchee was backflowing but appears equalized today. More water is flowing into the lake from downstream areas than upstream right now. Not the end of the world but not desirable either, it is very polluted water. http://w3.saj.usace.army.mil/h2o/reports/r-oke.html  “

When I asked Dr Grey if this was being done to gather water in the lake as we’ve recently been in a drought, or to keep the farmlands in the  EAA and surrounding areas dry, this was his response:

“Both, they want to fill the lake this summer, and so do I, in concept, but much of this backpumping and flowing is because the farmers have been pumping water so rapdily off their own lands they have made the canals too deep, and risk fooding the communities. And rather than tell the farmers the canal its too deep and they have to modererate their pumping, the SFWMD backpumps/flow it to the lake.”

In any case, when I visited yesterday during my trip to Belle Glade, S-308 was closed at Port Mayaca and no more water was entering Lake O from C-44. I’m not sure about S-2.

The water looks dark and full of sediment. The once beautiful beach is full of gritty rocks. Maybe the lake is healthy in the shallows south, near the islands, but by Port Mayaca it looks terrible. Algae has been reported by S-308 a few weeks ago according to a report from Martin County at the River’s Coalition meeting. But thankfully there is not algae reported in C-44 right now.

We have really made a mess of it. For our rivers and for Lake Okeechobee, the reservoir must be built and we must continue to advocate for sending cleaned water south and re -plumb this outdated system. Forward flow or backwards flow, just say NO.

6-13-17 JTL

____________________________________

Todd Thurlow notes 6-8-17

Jacqui,

Interesting note: if this data is correct, C-44 has poured 10.7 billion gallons (aka 13.82 Stuart Feet) of water into Lake Okeechobee in the last three days. With all the recent “local” runoff into the canal, they have opened S-308, sending the water west to the Lake to help get the low lake level up.

48.5 million gallons passed through S-80 to the St. Lucie on June 5th…

-Todd