Today’s blog post is about western Martin County Florida’s Palm City. This post includes my mother’s inspiration, my brother Todd’s time capsule flight video, and my writing.
Palm City was once narrow strips of pine flatlands interspersed with hammocks, ponds, wide prairies, sloughs, sawgrass and cypress trees. Today it is a bustling part of Martin County due to the drainage of the C-23 canal on the north, and the C-44 canal on the south. When one attempts to unravel the long history of drainage of Palm City, it is helpful to think in three connected but separate levels: local, state, and federal.
In 1919 the Palm City Drainage District was created. It was established for a local level as a special drainage district by the Florida Legislature with a lifetime of fifty years. It was primarily created to drain newly established Palm City Farms. Miles of canals and ditches were dug to drain into Bessey Creek, Dansforth Creek, and the South Fork of the St Lucie River. Some of these canals and ditches still exist today or have been incorporated into larger canals.
Digging of the St Lucie Canal in the south began around 1915 lasting into 1926. It was dug by the Everglades Drainage District, State of Florida, from the South Fork of the St Lucie River to Lake Okeechobee. After the deathly hurricane of 1928, the federal government authorized widening and deepening the St Lucie Canal to create the Okeechobee Waterway also known as the Cross State Canal from Stuart, across Lake Okeechobee, to Ft Meyers. Doing so allowed the St Lucie Canal to conveniently function as the main outlet for Lake Okeechobee’s flood waters. Later, after the great flood of 1947, the canal became part of the Central and Southern Florida Plan and renamed C-44 becoming part of the giant Central and Southern Florida Flood Control System of the Army Corp of Engineers.
The great flood of 1947 called not just for the widening and depending of the St Lucie Canal and enlargement of its structures, but the federal Flood Control Act of 1948 authorized more canals, levees, and structures to be built by the Army Corps of Engineers throughout southern and central Florida. Among the new canals were the C-23, the C-24 and C-25 canals of Martin and St Lucie counties -all discharging into the North Fork of the St Lucie River. The state asked for and supported this. The C-23 is the border between Martin and St Lucie Counties. Of course there were major unintended consequences that added to the discharges of the St Lucie Canal and the original Palm City Drainage District. This plethora of fresh, dirty water has all but killed the St Lucie River. Improving the health of the St Lucie is the goal of local, state, and federal restoration efforts today.
-Below: the federal government’s (ACOE) Central and Southern Florida Flood Control Project authorized by Congress in 1948 included C-23 on the border of Martin and St Lucie Counties, C-24, and C-25,- and enlarging the flood control structure along the St Lucie Canal. Once this system was built out it was turned over the state of Florida’s Central and Southern Flood Control District; however, the ACOE kept the St Lucie Canal now named C-44, for federal flood control. The Central and Southern Flood Control District, a Florida state agency that followed the Everglades Drainage District in 1949, became the South Florida Water Management District in 1977. -Below: A 1973 C&SFP update map, Army Corp of Engineers. Green never built thank God!
What should be normal, was a gift on Christmas Day, blue water in the St Lucie River/Indian River Lagoon. The peninsula of Sewall’s Point shone like the gem it is surrounded by aquamarine on both sides: the St Lucie River on its west, and the Indian River Lagoon on its east…
Feeling like the Bahamas, rather than the toxic-sludge we had to endure ~coming mostly from Lake Okeechobee this past summer, 2018, and yes, remember 2016, and 2013….the destruction must stop!
As 2019 edges into the picture, we will once again have to give everything we have to fight for clean water and encourage our state and federal government to support legislation “sending the water south.”
Seeing these beautiful blue waters once again is certainly encouraging. Now to keep the Army Corp and South Florida Water Management District at bay long enough, as projects proceed, and allow our precious seagrass beds to return so baby fish can once again hide, swim, and grow to maturity in these waters; once christened the “most bio-diverse in North America.”
Thank you to my dear husband, Ed, for these photos all taken 12-25-18. And from both of us, “Merry Christmas!”
Sewall’s Point lies between the St Lucie River and Indian River LagoonSailfish Flats between Sewall’s and Sailfish Point. Seagrass remains bleak after years of discharges from Lake O, and other area canalsSt Lucie Inlet opening to the Atlantic Ocean between Sailfish Point and the southern end of St Lucie Inlet State Park on Jupiter IslandAnother angle of St Lucie Inlet areaRemnants of once lush sea grass beds off Sewall’s PointAnother angle: Evan’s Crary and Ernest Lyons Bridges on far rightA great shot of the now pathetic seagrass beds. This area was once considered “the most bio-diverse in North America,” with approximately 700 acres of healthy seagrasses in this area between Sewall’s and Sailfish Points
Photo below as a comparison ___________________________________________________________________________
NEVER FORGET! Town of Sewall’s Point, Martin County Florida, 9-2013 surrounded by polluted waters released from Lake Okeechobee. Even the ocean brown! Similar years were 2016 and 2018 both with cyanobacteria blooms along shorelines. This awful sediment, and nutrient filled water is dumped on us by our federal and state government and is a health hazard.
Sometimes the history of the Everglades is really confusing. Why, with all of the environmental advocacy, since the 1970s, does the health of our environment remain crippled? One way to simplify it is to think in terms of before and after the 1947 U.S. Central and South Florida Plan. Of course there is extensive history before 1947, but it was after 1947 that things in South Florida’s water world became culturalized, compartmentalized, and legally defined. Before we talk about this 1947 Central and South Florida Plan, let’s review some important highlights pre-1947.
1. Hamilton Disston begins the drainage of Lake Okeechobee (1881)
2. Governor Napoleon Broward hires U.S.D.A. scientist James Wright who determines that “eight canals would indeed drain 1,850,000 acres of swampland” (1904)
3. The U.S. Congress’ Rivers and Harbors Act includes significant funds to deepen the manmade Hamilton Disston connection of the Calooshahatchee River to Lake Okeechobee (ca.1910)
4. The scandal of James Wright (from #2 above) who was deemed “a fraud” for the failure of the land to drain as expected ~causing the slump in swampy real estate sales (1914)
5. The resurgence of confidence in sales and a 1920s real estate boom fueled by advances in soil science, and the success of agricultural start-ups located in Moore Haven, Belle Glade, and Clewiston south of Lake Okeechobee
6. Land in a defined “Everglades Drainage District” more fully being systematically cut into sections for development with canals draining agricultural fertilizers and other chemicals into the waters of the state (1924)
6. Two very powerful hurricanes causing thousands of deaths and the destruction of property, and thus the state’s “call for a higher dike” (1926 and 1928)
7. The state’s reaction to the hurricanes, the 1929 establishment of the “Okeechobee Flood Control District” for the “Everglades Drainage District” as well as the Federal Government’s Army Corp of Engineers taking over “field operations”around Lake Okeechobee ~including the building of a thirty-five foot earthen dike and ingeniously using navigation funding to build the cross-state-canal, connecting the Caloosahatchee and the St Lucie Estuaries to Lake Okeechobee ~conveniently working as discharge-escapes through those estuaries when “necessary”
So, as we can see, a lot happened pre-1947, but it was what happened after, were things really changed…
In 1947 it rained and rained, and there were two hurricanes. From Orlando to Florida Bay the agricultural and developed lands, that had been built in drained, once marshy, swampy areas, really flooded, and in some places a foot of water sat for months. There was great economic loss.
The crying cow booklet, above, was sent to every member of the U.S. Congress.
The country as a whole was empowered with its post World War II success and prosperity, and with that same determination, the U.S. Congress came to Florida’s rescue…
To fight Florida’s destructive “flood waters” the 1948 U.S. Congress adopted legislation for the CENTRAL AND SOUTH FLORIDA PROJECT, a twenty year flood plan from Orlando to Florida Bay that included the formal creation and protection of the Everglades Agricultural Area south of Lake O, the Water Conservation Areas, intertwined with thousands of miles of canals and structures to control the once headwaters and River of Grass. HOUSE DOCUMENT 643 – 80TH CONGRESS (00570762xBA9D6)
Next, mirroring the same terminology the United States Government had used (the Central and South Florid Project) the state of Florida created the “Central and South Florida Flood Control District” to manage that CENTRAL and SOUTH FLORIDA PROJECT. A bit confusing huh? A tongue twister. And in a way one could say, at that time, the Central and South Florida Project and the Central and South Florida Flood Control District “became one.” The overall goal above all other things was flood control. And this marriage of the Central and South Florida Project and the Central and South Florida Flood Control District was successful at controlling the waters, but it also killed the natural environment, thus Florida herself.
This embedded cultural philosophy of “flood control only” was challenged in 1972 with the birth of the national environmental movement, and a consciousness that the natural system that supported Florida’s tourism, quality of life, agriculture, not to mention valuable wildlife, was in tremendous decline.
As Florida matured came Governor Claude Kirk, a republican, in 1968, who was advised by environmentalist Nathaniel Reed. Then came Governor Reubin Askew, a democrat. The Florida Legislature, seeing the destruction of the state’s natural resources, passed a very important piece of legislation, the “Florida Water Resources Act,” today’s Chapter 373 in Florida Statures. (http://www.leg.state.fl.us/statutes/index.cfm?App_mode=Display_Statute&URL=0300-0399/0373/0373ContentsIndex.html)
This law created five Florida water management districts with expanded responsibilities for regional water resources management includingenvironmental protection not just flood control.
Accordingly, the Central and South Florida Flood Control District changed its name, but not its heart, becoming the South Florida Water Management District, we know today…(https://www.sfwmd.gov)
Last Thursday on November 16, the ACOE reported they will reduce the amount of water they are releasing from Lake Okeechobee. The Corp had been releasing at a high rate, on and off, since September 20th. New targets are 2800 cfs east and 6500 cfs west.
Photos below were taken yesterday, 11-19-17 by my husband, Ed Lippisch. We will continue to document the discharges from Lake O, and area canals.
As Thanksgiving approaches, we are thankful the discharges are lessened and that the SFWMD and the public are working hard to plan the EAA Reservoir Senator Negron fought for… We the people of Martin County, will not be satisfied until these discharge stop. The river has its hands full with unfiltered discharges draining agriculture and developed lands from C-23, C-24, C-25 and C-44. All must be addressed.
“And where the river goes, every living creature that swarms will live, and there will be very many fish. For this water goes there that the waters of the sea may become fresh; so everything will live where the river goes…” Ezekiel
St Lucie Inlet, Sailfish Point R, Jupiter Island L, and Sewall’s Point and mainland Stuart in distance.Sewall’s PointManatee PocketHell’ s Gate Sewall’s Point to rightC-23 main SLRConfluence of SLR/IRL at Sewall’s Point’s southern tipSewall’s PointIRL looking towards Sewall’s Point and Stuart. Incoming tide pushes plume waters north into IRLsomewhere looking down…
SFWMD canal and basin map. C-44 canal is the canal most southerly in the image and was connected to Lake O in 1923. C-23, C-24 and C-25 were built later in the 50s as part of the Central and South Florida Project that over-drianed South Florida causing many of the water problems we live with today.Atlantic ocean off Jupiter Island, plume water moving south over nearshore reefsIRL near Sailfish Flats where seagrass forests used to flourish housing many fish…Hutchinson Island looking to IRLRoosevelt Bridge SLRC-23 SLR
As the possibility of a direct hit from Hurricane Irma approaches, I can’t help but reflect.
Looking back, we see that it was the severe flooding and the hurricane season of 1947 that led Florida and the U.S. Government down the track to where we are today through the creation of the Florida Central and South Florida Flood Project, (CSFP).
In 1947, during the United States’ post World War II boom, Florida had a very active and destructive hurricane season. This slightly edited excerpt from the ACOE’s book River of Interest does a good job giving a short overview of that year:
“…Rain began falling on the Everglades in large amounts. On 1 March, a storm dropped six inches of rain, while April and May also saw above average totals. The situation became severe in the summer…
As September approached and the rains continued, the ground in the Everglades became waterlogged and lake levels reached dangerous heights. Then, on 17 September, a hurricane hit Florida on the southwest coast, passing Lake Okeechobee on the west and dumping large amounts of rain on the upper Everglades, flooding most of the agricultural land south of Lake Okeechobee.
George Wedgworth, who would later become president of the Sugar Cane Growers Cooperative of Florida and whose parents were vegetable growers in the Everglades, related that his mother called him during the storm and told him, “ this is the last call I’ll make from this telephone because I’m leaving. . . . “We’ve got an inch or two of water over our oak floors and they’re taking me out on a row boat.”
Such conditions were prevalent throughout the region. Before the area had a chance to recover from the devastation, another hurricane developed, moving into South Florida and the Atlantic Ocean by way of Fort Lauderdale. Coastal cities received rain in large quantities, including six inches in two hours at Hialeah and nearly 15 inches at Fort Lauderdale in less than 24 hours.
The Everglades Drainage District kept its drainage canals open to discharge to the ocean as much of the floodwater in the agricultural area as it could, exacerbating coastal flooding. East coast residents charged the District with endangering their lives in order to please ag- ricultural interests, but this was vehemently denied…
Whoever was to blame, the hurricanes had devastating effects. Although the levee around Lake Okeechobee held, preventing the large numbers of deaths that occurred in 1926 and 1928, over 2,000 square miles of land south of the lake was covered by, in the words of U.S. Senator Spessard Holland, “an endless sheet of water anywhere from 6 to 7 feet deep down to a lesser depth.” The Corps estimated that the storms caused $59 million in property damage throughout southern Florida, but Holland believed that the agency had “under- stated the actual figures.” The destruction shocked citizens of South Florida, both in the upper Everglades and in the coastal cities, and they demanded that something be done.”
Cover of the “Weeping Cow” book. (South Florida Water Management District)
Well, what was done was the Central and South Florida Flood Project.
Key Florida politicians, and the public demanded the Federal Government assist, and as both the resources and will were present, the project was authorized in 1948 with massive additional components making way not only for flood protection, but for even more agriculture and development. In Martin County and St Lucie County this happened by the controversial building of canals C-23, C-24, C-25 and “improving” the infamous C-44 canal that connects to Lake Okeechobee. This construction was basically the nail in the coffin for the St Lucie River and Southern Indian River Lagoon.
Map showing the Jacksonville District’s initial comprehensive proposal, 1947. (Claude Pepper Collection, Claude Pepper Library, Florida State University, Tallahassee, Florida)
But before the death of the environment was clear, the Corps developed a plan that would include 1,000 miles of levees, 720 miles of canals, and almost 200 water control structures. Flooding in coastal cities and in the agricultural lands south of Lake Okeechobee would be minimized and more controllable.
Yes, a goal of the program was to provide conservation areas for water storage, protecting fish and wildlife habitat. Although water conservation areas were constructed, conservation of wildlife did not work out so well, and has caused extreme habitat degradation of the Everglades system, Lake Okeechobee, the southern and northern estuaries, the Kissimmee chain of lakes, and Florida Bay. Nonetheless, this project made possible for over five million people to now live and work in the 18,000 square mile area that extends from south of Orlando to Florida Bay “protected from flooding” but in 2017 living with serious water quality issues.
With problems apparent, in 1992 the Central and South Florida Project was “re-studied” and we continue to work on that today both for people and for wildlife…
Irma many be the system’s greatest test yet…
Yesterday’s Army Corp of Engineer Periodic Scientist Call was focused on saving people’s lives and safety. After the built-system was discussed, Mr Tyler Beck of the Florida Wildlife Commission, and Mr Steve Schubert of the U.S. Fish and Wildlife Service reported on the endangered Everglades Snail Kites and their nests at Lake Okeechobee. Like most birds, pairs mate for life. There are presently fifty-five active nests, thirty-three in incubation, and twenty-three with baby chicks…
In the coming days, as the waters rise on Lake Okeechobee, and the winds scream through an empty void that was once a cathedral of colossal cypress trees, Mother Nature will again change the lives of Florida’s wildlife and its people, just as she did in 1947. Perhaps this time, she will give us vision for a future where nature and humankind can live in greater harmony…
Hurricane Irma as a category 5, 2017Everglades Snail Kite, Florida AudubonSFWMD basin map for SLR showing S-308 and S-80 along with other structures.South Florida today…Florida map 1500s
It is a journey the state, federal, and local agencies don’t always wish to take–a journey to face the numbers of our watershed…
Today, Dr Gary Goforth (http://garygoforth.net) shares his most recent report, “Water Quality Assessment of the St Lucie River Watershed, For Water Year 2017, DRAFT.”
Mind you, for non-scientist people like myself, a “water year” is reported from May of one year, through April the next year, as opposed to a calendar year.
The full report is linked at the bottom of the post and contains numerous helpful charts. I have just included the key findings below.
Dr Goforth wanted to get the draft assessment out before the Florida Department of Environmental Protection’s Basin Management Action Plan workshop scheduled for this Friday Aug. 25th at 10:00 am at Martin County Building Permits Office, 900 Southeast Ruhnke Street, Stuart, FL 34994, Conference Rooms A & B because this is where the rubber hits the road! FDEP: (http://www.dep.state.fl.us/central/Home/Watershed/BMAP.htm)
Reflections in the St Lucie River, JTL
Water Quality Assessment of the St. Lucie River Watershed –Water Year 2017 – DRAFT Gary Goforth, P.E., Ph.D.
Quis custodiet ipsos custodes? (Who watches the Watchers?)
Key Findings:
1. Over the last water year (May 2016 – April 2017), the surface water entering the St. Lucie River and Estuary (SLRE) in general was of poor water quality. The best water quality entering the SLRE was from the highly urbanized Tidal Basins. The largest source of phosphorus, nitrogen and sediment pollution to the SLRE was Lake Okeechobee discharges. The C-44 Canal Basin contributed poor water quality, and was the only basin demonstrating a worsening in water quality over the last ten years.
2. It was estimated that stormwater runoff from agricultural land use contributed more flow and nutrient pollution than any other land use, even contributing more flow than Lake Okeechobee discharges.
3. The annual Basin Management Action Plan (BMAP) progress reports produced by the Florida Department of Environmental Protection continue to indicate water quality conditions in the tributaries of the SLRE are better than they actually are. Examples of flaws in the BMAP assessment process include the omission of Lake Okeechobee pollution loads, the use of simulated data instead of observed data, the inability to account for hydrologic variability, and the inability to assess individually each of the major basins contributing to the SLRE.
4. An alternative to the assessment approach presented in the BMAP progress reports was developed and used to evaluate water quality conditions of major inflows to the SLRE and to assess progress towards achieving the Total Maximum Daily Load (TMDL) load reduction goals. This alternative approach uses observed data, includes Lake discharges, accounts for hydrologic variability, and is applied to each of the major basins contributing pollution loads to the SLRE. For WY2017, observed nitrogen loads to the SLRE exceeded the Phase 1 BMAP target loads (adjusted for hydrologic variability) by 77 percent. Observed phosphorus loads exceeded the Phase 1 BMAP target loads (adjusted for hydrologic variability) by 53 percent.
5. The largest single source of total nitrogen, total phosphorus and sediment load to the SLRE was Lake Okeechobee discharges. In addition, total phosphorus concentrations in Lake Okeechobee discharges to the SLRE remained almost four times the lake’s TMDL in-lake target concentration of 40 parts per billion (ppb). In 2017, the South Florida Water Management District (SFWMD) reported that phosphorus loading to the lake from surrounding watersheds was almost 5 times the Lake’s TMDL of 105 metric tons, yet staff acknowledged the agency does not enforce permits that set numeric limits on phosphorus discharges to the lake[1] (SFWMD 2016, SFWMD 2017). Unfortunately, despite the continued and well-publicized pollution of the lake, the Florida legislature in 2016 enacted a water bill that pushed back deadlines for achieving the lake’s TMDL by decades (Ch. 2016-1).
6. The best water quality entering the SLRE during WY2017 was observed in the highly urbanized Tidal Basins, with concentrations of 97 ppb and 819 ppb for TP and TN, respectively. Each of the remaining source basins, except the C-44 Canal Basin[2], exhibited a slight improvement in nutrient levels compared to their base periods, however, collectively these WY2017 loads did not achieve the alternative BMAP Phase 1 load target (Figures ES-1 and ES-2). The C-23 and Tidal Basins met the alternative BMAP Phase 1 target for TP, while the C-23, C-24 and Tidal Basins met the alternative BMAP Phase 1 target for TN. The predominantly agricultural C-44 Canal Basin exhibited poor nutrient conditions, and in fact, continued a trend of deteriorating nutrient conditions compared to its 1996-2005 base period. As a whole, the water quality entering the SLRE remains poor, although a slight improvement over the 1996-2005 period was observed.
Army Corp of Engineer Structure S-80 releases water from Lake Okeechobee in the the C-44 Canal that leads to the St Lucie River. JTLLake Okeechobee.basins of SLR/IRL SFWMD
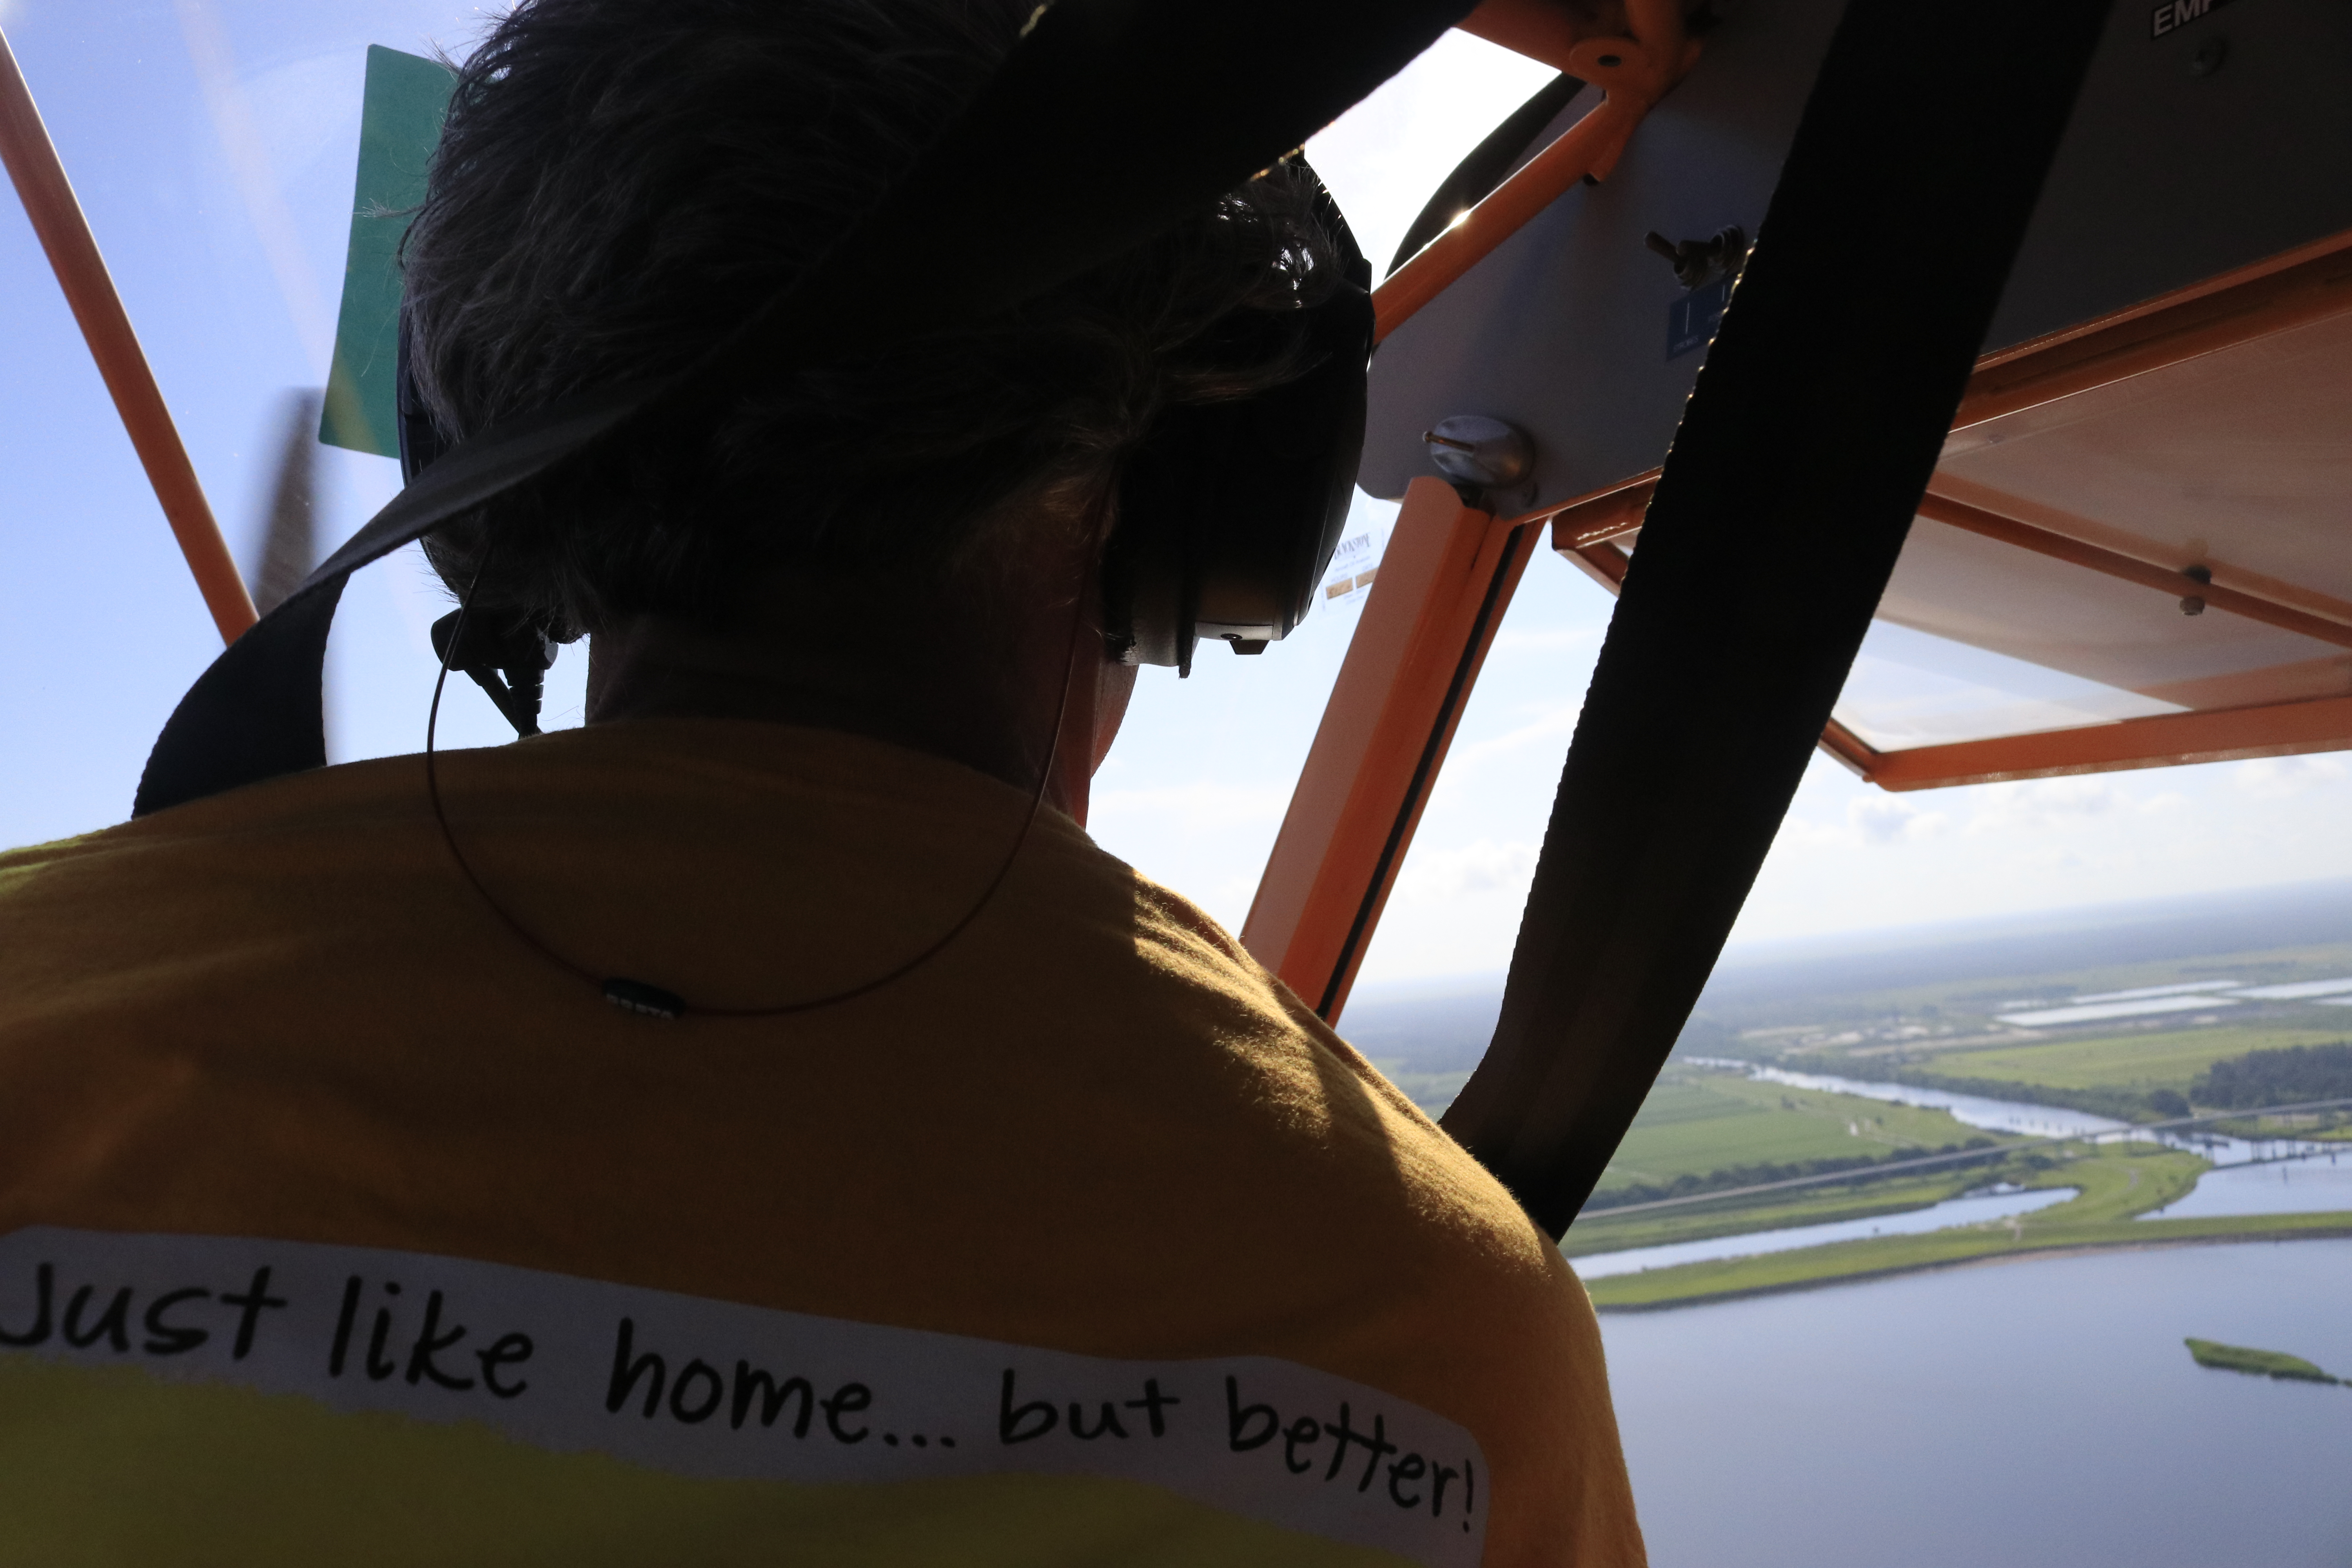
My husband and I have decided we are algae hunters…
Hello Readers. Hope you are having a good summer!
Even though I am supposed to be on a “blogcation,” my husband, Ed, and I decided to fly over Lake Okeechobee this morning as yesterday Dr Susan Gray of the South Florida Water Management District reported on the Army Corp of Engineer Periodic Scientist Call that recent Landsat Satellite images had revealed significant algae in the middle of the lake- – – an area known as “LZ40.”
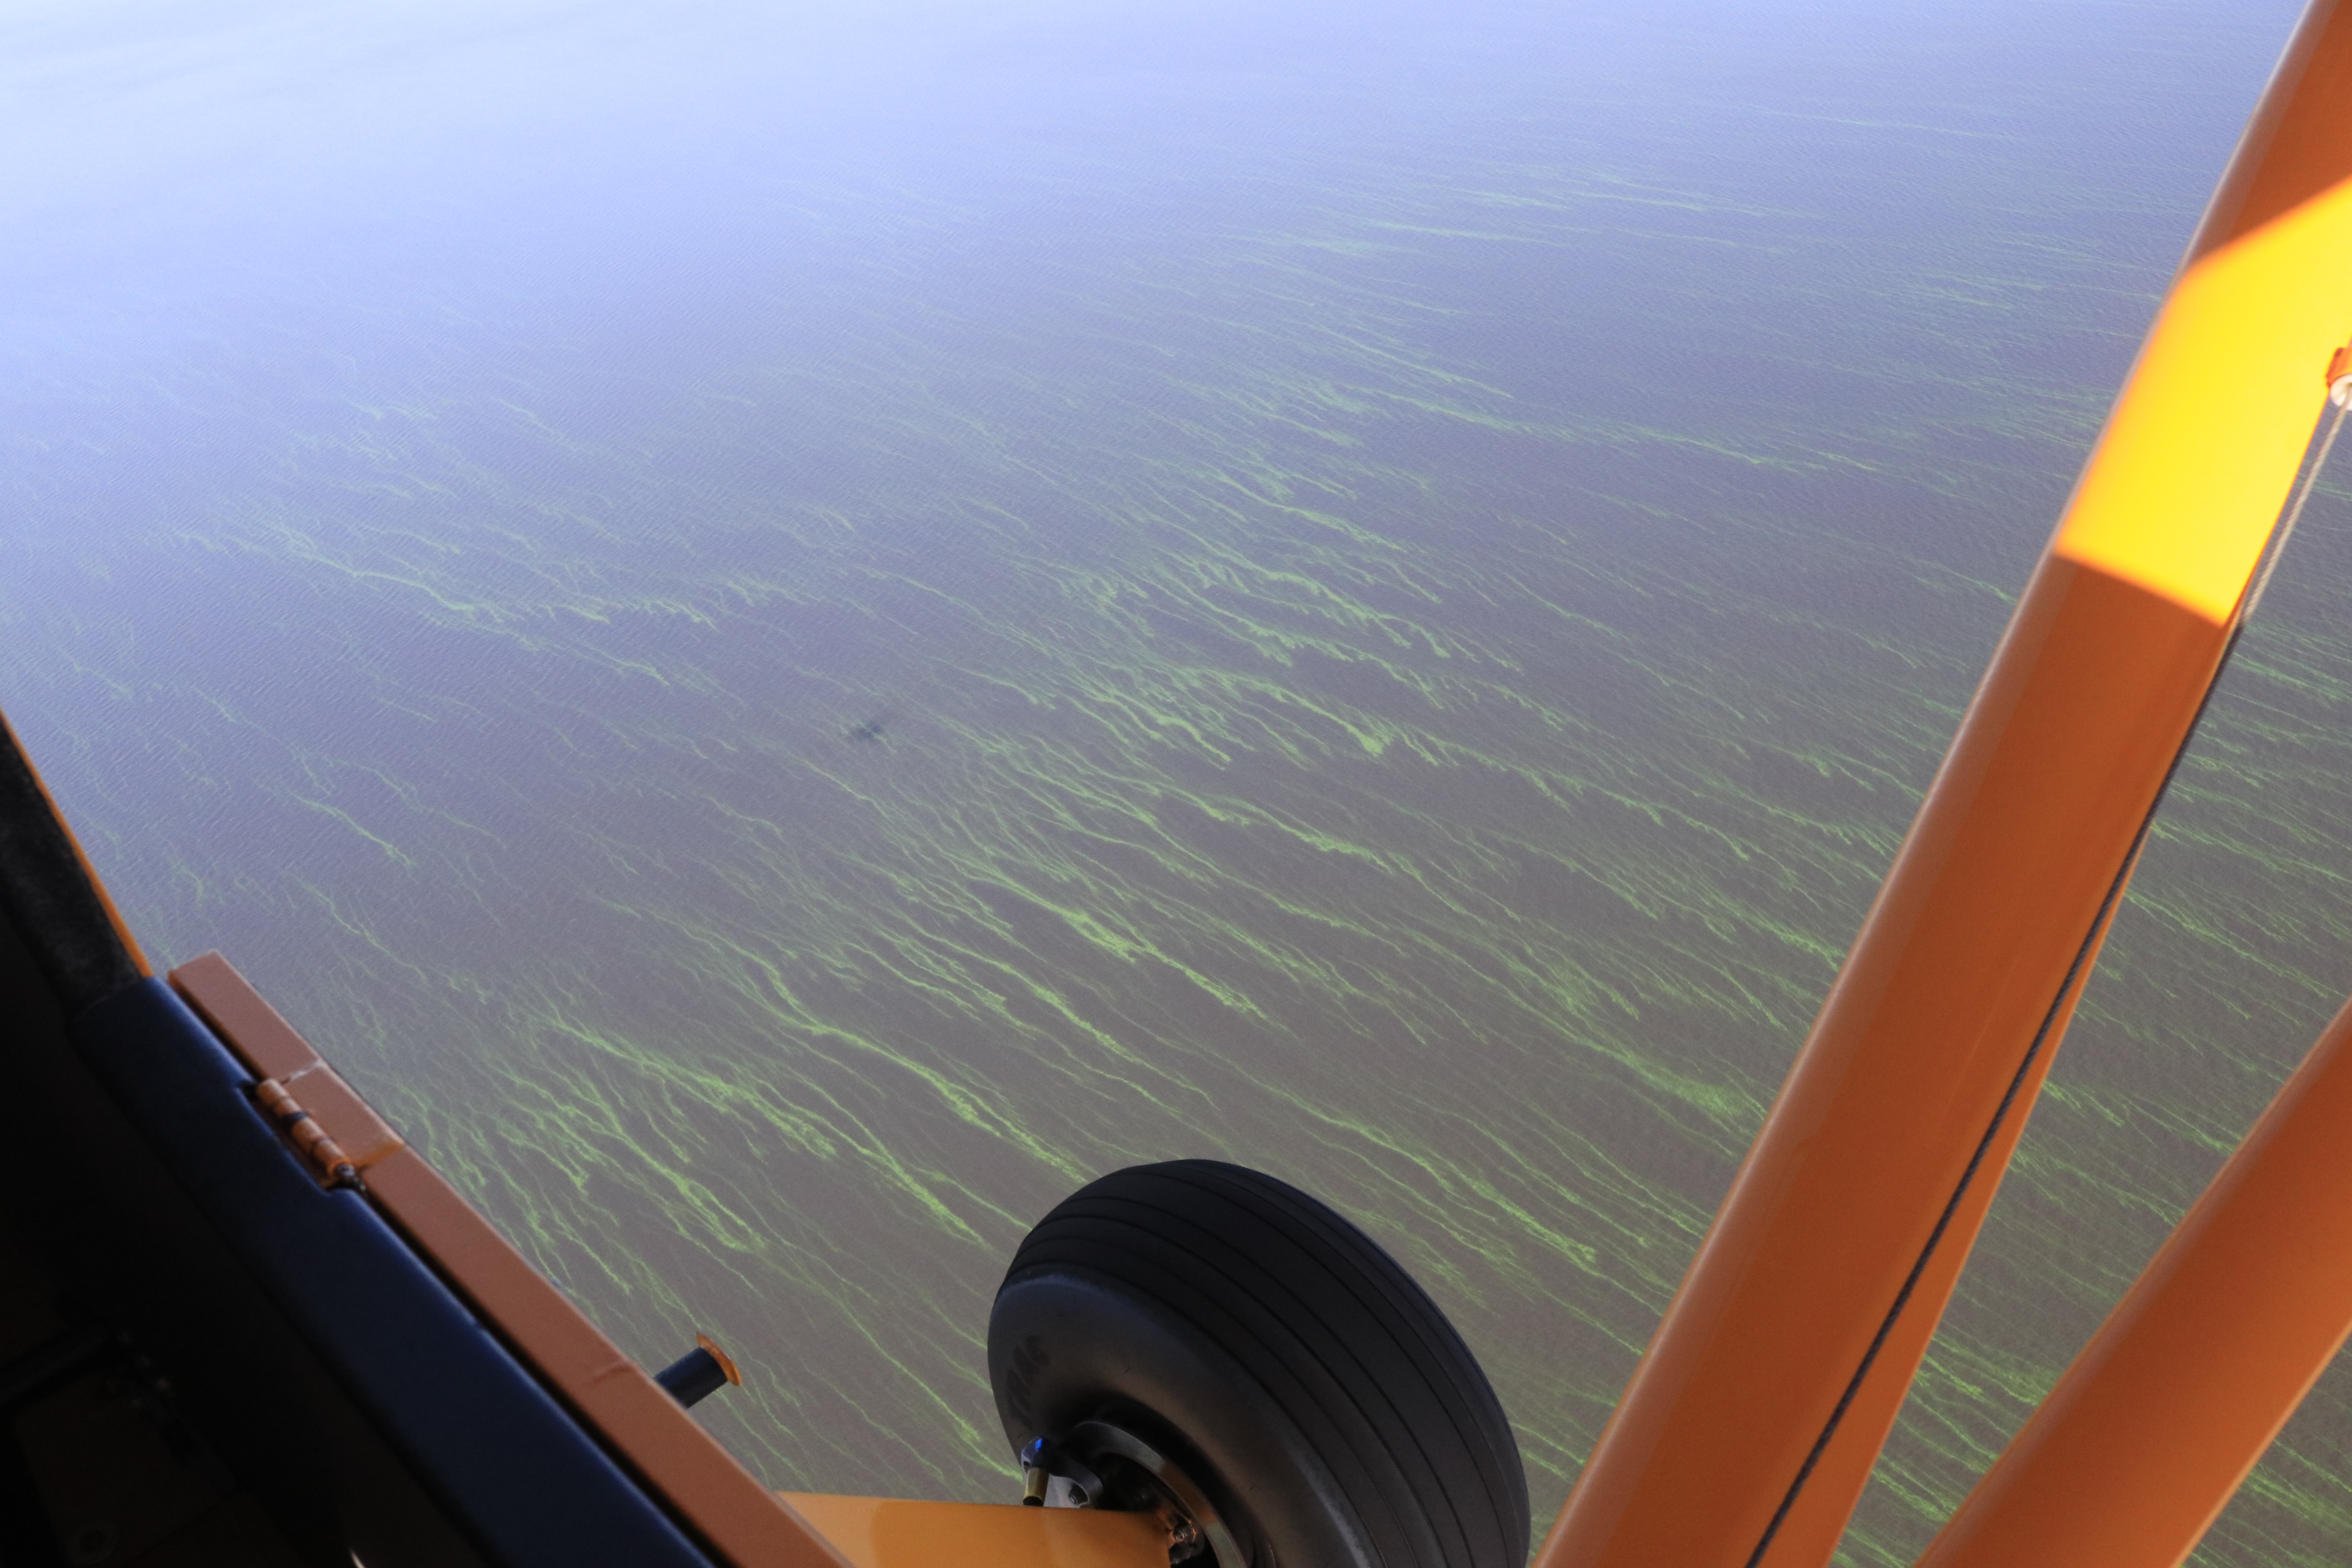
Sure enough, once Ed and I got up in the air, just a few miles west of Port Mayaca, the strings of bright green algae were visible from about 1000 feet —-looking down— up to as far as eye could see…
Very strange to be surrounded by water and bright-colored lines of algae; it resembled miles of suspended fluorescent paint. I have heard the scientists talking about how the algae comes up in the morning for sunlight and then goes back down into the water column later in the day. It is intelligent, like an animal, and knows how to hide. You have to track it….
The living bloom was quite extensive, going on for many miles. My photos do not do the color or amount justice, but do document. This is important.
Thank God the ACOE is not dumping into the St Lucie River/Indian River Lagoon this summer. Poor lake O, on the other hand, has been getting “backwards flowing” C-44 water and back-pumped water from the EAA, STAs, and WCAs. No wonder its a mess!
Thank you to the SFWMD for the heads up! We do appreciate your work. We have inherited and created “quite an animal.”
*Reader, Professor Geoff Norris recommends we ask NOAA to create a bulletin for Lake O like this one here for Lake Erie since basically we are “in the same boat:” I think this is a great idea. I will have to contact NOAA.
Tracking of journey upon return from Ed’s watch 7-19-17 around 9amCenter area of Lake O LZ40 is where SFWMD reported 7-18-17 that algae was showing on Landsat satellite images
Ed approaching Lake OkeechobeeFPL pond, Herbert Hoover Dike, and Lake OS-308 and dikeAlgae starts to appear just a few miles outAlgae get thicker and brighter as we continue flying west
There is incredible footage of the 2016 toxic algae event caused primarily by forced discharges by the ACOE and SFWMD from Lake Okeechobee into the estuaries, St Lucie and Caloosahatchee. South Florida locals such as Mary Radabaugh, Dr Edie Widder, Dr Brian LaPointe, Mark Perry, Phil Norman, Dr Larry Brand, Dr Steve Davis, and Col. Jennifer Reynolds are prominently featured. Edie Widder’s political commentary at the end is priceless.
CHANGING SEAS Toxic Algae: Complex Sources and Solutions. Aired: 06/21/2017
Water releases from Lake Okeechobee periodically create putrid mats of blue-green algae. Scientists think water pollution is to blame, and if something isn’t done about it there could be irreparable damage to the environment, the local economy and people’s health.
You can Like Changing Seas on Facebook and attend their DIVE IN Summer series on this topic June 28th, 2017. See link:
My brother, Todd, wrote to me on June 8th noting that the C-44 canal was flowing westwards into Lake Okeechobee rather than dumping eastwards into the St Lucie as is standard operating procedure after a big rain…
Yes this canal, as most of the others, can “flow” in either direction, seemly “backwards.”
So how can this happen? This backwards flow?
Dr Gary Goforth says the following:
“Yes this is normal operations; generally when the Lake level is below 14 ft the Corps leaves the locks at S-308 wide open which allows any local runoff to flow into the lake.”
Another way Lake Okeechobee can receive water in an unusual way is if the water is pumped into it–back pumped. This has recently been done from the EAA. Back pumping into Lake O has been outlawed, but it is allowed if communities or farmland would flood.
According to an exchange yesterday on Facebook, with Audubon’s Dr Paul Grey:
“St Lucie (C-44) backflows are just one of many southern inflows now, S-2 is backpumping, three other southern outlets are flowing backward into the low lake (L-8, S354, S-352) the Caloosahatchee was backflowing but appears equalized today. More water is flowing into the lake from downstream areas than upstream right now. Not the end of the world but not desirable either, it is very polluted water. http://w3.saj.usace.army.mil/h2o/reports/r-oke.html “
When I asked Dr Grey if this was being done to gather water in the lake as we’ve recently been in a drought, or to keep the farmlands in the EAA and surrounding areas dry, this was his response:
“Both, they want to fill the lake this summer, and so do I, in concept, but much of this backpumping and flowing is because the farmers have been pumping water so rapdily off their own lands they have made the canals too deep, and risk fooding the communities. And rather than tell the farmers the canal its too deep and they have to modererate their pumping, the SFWMD backpumps/flow it to the lake.”
In any case, when I visited yesterday during my trip to Belle Glade, S-308 was closed at Port Mayaca and no more water was entering Lake O from C-44. I’m not sure about S-2.
The water looks dark and full of sediment. The once beautiful beach is full of gritty rocks. Maybe the lake is healthy in the shallows south, near the islands, but by Port Mayaca it looks terrible. Algae has been reported by S-308 a few weeks ago according to a report from Martin County at the River’s Coalition meeting. But thankfully there is not algae reported in C-44 right now.
We have really made a mess of it. For our rivers and for Lake Okeechobee, the reservoir must be built and we must continue to advocate for sending cleaned water south and re -plumb this outdated system. Forward flow or backwards flow, just say NO.
6-13-17 JTL
____________________________________
Todd Thurlow notes 6-8-17
Jacqui,
Interesting note: if this data is correct, C-44 has poured 10.7 billion gallons (aka 13.82 Stuart Feet) of water into Lake Okeechobee in the last three days. With all the recent “local” runoff into the canal, they have opened S-308, sending the water west to the Lake to help get the low lake level up.
48.5 million gallons passed through S-80 to the St. Lucie on June 5th…
Structures and canals south of LOCanal and basin map, Martin and St Lucie Co,SLR/IRL. SFWMDC-44 canal from Stuart to Lake O.S-308 at Lake O and C-44 canal Port Mayaca
Numerous wood storks and great egrets eating fish in the polluted side canals of C-44:
Cover to ACLU report, “Tainted Waters,” by John Lantigua, released 6-7-17.
Civil Lib·er·ty/(definition) noun “the state of being subject only to laws established for the good of the community, especially with regard to freedom of action and speech. individual rights protected by law from unjust governmental or other interference.”
Today I am sharing a report that came out only yesterday and is spreading through social media and news channels like ~ toxic algae…
“Tainted Waters, Threats to Public Health, and People’s Right to Know” is written by award-winning journalist and ACLU investigative reporter, John Lantigua.
After being contacted, Mr Lantigua approached me and many others months ago, traveling and interviewing numerous stakeholders from various backgrounds. He was a consummate professional with an air that only an experienced, savvy, and hard-hitting journalist can attain. I will never forget being interviewed by him at a diner in Belle Glade and saying to myself: “Holy cow, this is the real deal…”
In today’s TCPalm article by Tyler Treadway, Mr Lantigua states: “We don’t typically focus on environmental concerns but getting timely and trustworthy information about a public health issue is a civil right…”
Thank you Mr Lantigua for recognizing the “lack of urgency and transparency” on the part of the state of Florida in reporting information about the 2016 Toxic Algae Crisis caused by the Army Corp of Engineers and South Florida Water Management Districts’ releases of tainted waters from Lake Okeechobee into our St Lucie River/Indian River Lagoon.
Reporter, John Lantigua, 2017.
ACCESS REPORT “Tainted Waters, Threats to Public Health, and the People’s Right to Know,”HERE:
Lake O 239 square mile algae bloom, NASA satellite image, July 2, 2016.Toxic St Lucie River June 2016, photo pilot Dave Stone.Toxic algae flowing through locks from Lake O into SLR May 2016. Photo Ed and Jacqui Thurlow-Lippisch.
Today I am again honored to feature the writing of Professor Geoff Norris. This most recent work is a tremendous achievement of time, research, and puzzle piecing. Professor Norris’ past shared articles “Blue Green Algal Blooms in the Lakes, Rivers, and Marine Waters of South Florida Surrounding Lake Okeechobee,” and “Sugarcane and Indians” were extremely popular with many of my readers. Professor Norris has a way of communicating complex topics in an easy and interesting way so that everyone can understand and make the connections. In the 1960s Professor Norris lived and worked as a petroleum exploration geologist in Tulsa, Oklahoma. Subsequently, he spent 40 years at the University of Toronto teaching and performing research in geology. A geologist by training, Professor Norris has a specialized knowledge of fossil algae, their ecology, morphology, and distribution. He has published hundreds of scientific papers on fossil algae and related topics…I encourage you to contact him by email with any questions at rosalex@interlog.com
Thank you Professor Norris. “Together we will create a “better water future!”
Jacqui
Lake Okeechobee blue-green bacterial blooms in Florida: lessons from Lake Erie
In the following article, I have attempted to summarize some of the voluminous literature on Lake Erie and its problem blue-green blooms, and how this might help to understand similar events in Lake Okeechobee. I have included URL web addresses for some of the topics, which can be used to access further information.
Although the blooms are often referred to as blue-green algae, this is quite inaccurate and I can see no further point in perpetuating this misnomer. The blooms are largely or entirely composed of Cyanobacteria, or blue-green bacteria as I have chosen to call them for this article. This is not just for precision and to point up their lack of a nucleus and other organelles in each cell, but serves to underline how these organisms earn a living and perpetuate themselves that is quite different compared to nucleated organisms, the latter including algae, fungi, all green plants, and all animals. This difference is really important.
The topic is vast and my review barely scratches the surface – it’s not meant to, because I am not an expert and am still trying to understand the vast complexity of blue-green bacterial bloom formation. I have tried to unravel and clarify some of the science and scientific investigations that have been important for me, and have used these as examples of the work that is going on or has led to current advances. For every paper I have cited, however, there could be tens or hundreds more that haven’t been consulted or mentioned. I apologize in advance to those many talented scientists that I haven’t mentioned or that I am simply unaware of.
Steel Town
I used to live in Hamilton, Ontario, a prosperous city with thriving iron and steel mills, other manufacturing industries, an excellent university and a great football team, a sort of Pittsburg of the North. It sits on the shores of Lake Ontario on a sliver of land – the Niagara Peninsula – that separates Lake Erie from Lake Ontario. In the early summer after the ice had melted, many of the locals in the mid-1900s would take advantage of the beaches along Lake Ontario to sun themselves and wait until the water was warm enough to swim in. However, you could get a head start on summer by taking a short drive south (less than an hour) to the beaches along Lake Erie where the water was warmer earlier in the summer, and resorts and tourism thrived. Fish were abundant and the lake was very productive for commercial fishing and equally attractive for sport fishing. The beaches were superb for tourism and sun lovers. Lake Erie is large but shallow (average depth about 60ft) and so a baby on a Great Lakes scale from a volumetric point of view (most of the Great Lakes are hundreds of feet deep, the deepest being Superior at more than 1300 ft maximum depth). However, Lake Erie’s smaller volume and shallow waters helped it to warm up quickly in the spring and summer.
The Dead Sea of North America
Then something happened to Lake Erie, starting in the 1960s. The water of Lake Erie became murky and discolored, mass fish kills led to piles of rotting marine life polluting the beaches, the tourists and anglers and sun worshippers stayed away in droves, the resorts closed down, the commercial fisheries were badly hit, and the economy suffered enormously. Algae were blamed but no one was quite sure why they had become so abundant – “eutrophication” was the buzzword of the time. Lake Erie was declared “dead”, which was quite inaccurate since it was swarming with life, but the wrong sort of life. The culprits polluting the environment were a mixture of true green algae (such as Cladophora) and so-called “blue green algae” (such as Microcystis and Aphanizomenon), which in truth are types of bacteria using chlorophyll and other pigments that allow them to live in sunlight (their technical name is Cyanobacteria –called blue-green bacteria in this article), and this is discussed in more detail in my previous blog: https://jacquithurlowlippisch.com/tag/dr-geoffrey-norris/). The plight of the Dead Sea of North America (as Lake Erie became known) was so notorious that one of Dr Seuss’s books for children – The Lorax (1971) – made reference to it in his famous style of doggerel:
You’re glumping the pond where the Humming-Fish hummed!
No more can they hum, for their gills are gummed.
So I’m sending them off. Oh, their future is dreary.
They’ll walk on their fins and get woefully weary
In search of some water that isn’t so smeary.
I hear things are just as bad up in Lake Erie.
The Fix
Very fortunately the mystery of Lake Erie’s “death” was soon solved, thanks to a treaty between the U.S. and Canada dating back to the early 1900s that acknowledged the need to maintain water quality in the Great Lakes’ waters bordering the two countries.
By the middle of the 20th century this had morphed into the International Joint Commission for the Great Lakes. These international efforts were underpinned by government and university-based research in both the U.S. and Canada, which identified phosphorus entering the waters as a major contributor, particularly from agricultural fertilizers on the one hand and from domestic laundry detergents on the other. In 1972 the Great Lakes Water Quality Agreement (GLQWA) was signed between the United States and Canada, by Prime Minister Pierre Trudeau for Canada and President Richard Nixon for the United States. They loathed one another personally, but they knew what was the right thing to do for their countries.
Prime Minister Pierre Elliott Trudeau and President Richard Nixon signing the Agreement.
The Agreement emphasized the reduction of phosphorous entering lakes Erie and Ontario, and, in 1977, maximum levels for phosphorous were added to the Agreement. Also, phosphorus in laundry detergents was finally drastically reduced or banned. Coupled with the U.S. and Canadian Clean Water acts, the International Joint Commission did much to reduce the phosphorus levels in Lake Erie.
International Joint Commission (IJC): “More than a century of cooperation protecting shared waters. Canada and the United States each appoint three of the six IJC Commissioners, including one chair from each country. The two chairs serve concurrently.The Commissioners are appointed by the highest level of government in each country, but once appointed they do not represent the national governments; they operate at arm’s length.The Commissioners traditionally work by consensus to find solutions that are in the best interest of both countries. The Commissioners are supported by U.S. and Canadian Section offices in Washington, D.C. and Ottawa, Ontario.”
So everyone breathed a sigh of relief, phosphorus levels went down, farmers applied fertilizers to their fields differently, consumers chose phosphorus-free detergents, municipalities improved their storm water and sewage treatment facilities, the fish and other wildlife came back to Lake Erie, and Dr Seuss was persuaded to remove the last line in his poem. Further details can be found in a report by the National Wildlife Federation:
For almost 20 years, Lake Erie was not plagued by the blue-green bacteria problem, but other problems did emerge such as exotic zebra mussels that interfered with the distribution of elements important in nutrition, but they seemed at the time to be unrelated to bacterial infestations. Then starting in the mid-1990s, the blue-greens reappeared and became progressively worse leading to super-gigantic blooms that choked the western end of Lake Erie with green muck inches thick and hundred of square miles in extent. Dead zones – biological black holes – reappeared in the Lake as the rotting organic matter sucked the oxygen out of the water, promising certain death to animals that ventured in.
In the summer of 2011 the mother of all blue-green bacterial blooms exploded in Lake Erie, the bloom at its peak being more than 1900 square miles in extent. That is more than 50% greater than the entire state of Rhode Island, or 35% larger than Long Island, or more than six times larger than all of New York City’s five boroughs. This super-giant bloom had an estimated weight of 40,000 metric tons dry weight. The wet weights of algae and blue-green bacteria are generally at least 10 times the dry weight. So, this supergiant bloom had at least half a billion tons of blue-green bacteria living within it – a true monster.
MODIS (Moderate Resolution Imaging Spectroradiometer) satellite Image of Lake Erie on September 3, 2011, overlaid over map of Lake Erie tributaries. This image shows the bloom (in green) about 6 weeks after its initiation in the western basin. From Michalak et al, 2013.
These blooms had a devastating effect on the areas flanking the western end of Lake Erie – Ohio, Michigan, and Ontario – with large agricultural areas and several major cities and industrial towns. Toxins from the blue-green bacteria polluted the drinking water supplies of large cities, and potable water had to be trucked in for the residents.
The “greening” of Lake Erie has been documented by Prof. Tom Bridgeman of the University of Toledo in a presentation:
In his presentation Prof. Bridgman showed how increasing phosphorus in the lake water favored the blue-green bacteria and shut out the normal tiny floating plants (true algae), a situation that had culminated in the American Dead Sea catastrophe of the 1960s. The international agreement on phosphorus reduction in the Great Lakes was a huge success story for Lake Erie, but by the mid 1990s algal biomass was beginning to increase again (eutrophication was returning), and by the early 2000s blue green bacteria such as Microcystis were increasing ten-fold, as the reactive phosphorus in the lake waters increased beyond levels recorded in the 1970s.
What the heck was going on here? Everyone had played their part in reducing phosphorus run-off from agricultural lands, and the municipalities and citizens had cleaned up their act. So where was the phosphorus coming from? Well now the plot thickens.
Farming and Phosphorus
This time, the main problems are thought to be ones that governments have much less direct control over, according to a file posted by Emily Chung of the Canadian Broadcasting Corporation News (2014).
To some extent, they include the application of fertilizers to lawns and golf courses, growing expanses of pavement in urban areas that cause water to drain more quickly into waterways without being filtered by vegetation, and invasive zebra mussels that release extra nutrients into the water as they feed. But those aren’t thought to be the biggest cause.
“We think farming is the major culprit behind the current levels of phosphorus that’s in runoff and the phosphorus loads that are getting dumped into the western basin of Lake Erie,” said Dr. Glenn Benoy (senior water quality specialist and science adviser with the International Joint Commission in Ottawa).
Dr Glenn Benoy
So why is this? Well, there are several things going on. Firstly, corn production is at an all time high because of the push to increase alcohol biofuel production, and soybeans are being produced in gigantic quantities for use as animal feed, oil and protein for human consumption, plastics and biodiesel. Secondly, the introduction of no-till farming practice in the U.S. has led to increased run-off of fertilizer. Thirdly, there’s just not enough infrastructure to deliver in the spring the huge amounts of fertilizer that are required by the corn farmers. Prof. Ivan O’Halloran of Guelph University, Ontario and a specialist in soil fertility and nutrient use commented that the demand by corn farmers is such that there are simply not enough rail cars to satisfy the need. So companies offer discounts to farmers who are willing to apply fertilizer in the fall, which in turn leads to enhanced run-off of phosphorus during the winter storms.
Prof. Ivan O’Halloran
No-till Farming and Glyphosate
And then there is the matter of no-till farming. No-till farming (also called zero tillage or direct drilling) is a way of growing crops or pasture from year to year without disturbing the soil through tillage, and in current practice depends on the use of powerful herbicides such as glyphosate (Monsanto’s Roundup brand being the most popular formulation). Application of glyphosate kills weeds and other vegetation in preparation of the seedbed. Later in the year, another application of the herbicide is used to reduce weeds that might be harming the crop. However, this is only possible if the farmers use genetically modified seeds that are resistant to glyphosate – often referred to as Roundup Ready seeds. In 2014 in the U.S. 98% of soybeans and more than half of corn was Roundup Ready. Advocates of Roundup point out that glyphosate is a compound derived from phosphonic acid in which the phosphorus is strongly bonded to carbon and therefore is not available to plants, unlike fertilizer which contains phosphates (not phosphonates) which has phosphorus bonded less strongly to oxygen, and is therefore more readily available for uptake by plants (often referred to by the acronym DRP – dissolved reactive phosphorus).
Prof. Chris Spiese is a chemist at Ohio Northern University and he decided to test the contribution that glyphosate might make to the amount of dissolved reactive phosphorus running off of cultivated fields. He found that glyphosate acts on the soil to allow the phosphorus bonded to the soil (either being naturally present or due to fertilizer use) to be released by the chemical process known as desorption. He also found that soils richer in both iron oxides and iron hydroxides tend to release by desorption more phosphorus, as do soils that are more acidic. Overall, he calculated that glyphosate is responsible for releasing 20-25% of the dissolved reactive phosphorus in the Maumee watershed, a river discharging into the western end of Lake Erie. Prof. Spiese calculated that for every acre of Roundup Ready soybeans, one-third of a pound of phosphorus comes down the Maumee River. In 2010, according to the Ohio Soybean Council, 4.6 million acres were planted in soybeans, of which about 2 million acres of soybean fields drain into Lake Erie.
If Prof. Spiese’s calculation for the Maumee watershed hold true for all the soybean acreage in Ohio draining into Lake Erie, this would suggest that each year hundreds of tons of dissolved reactive phosphorus are entering the Lake from this source alone. And then there are the other states and provinces bordering Lake Erie that are also involved in soybean production: Ontario 2 million acres; Michigan 1.5 million acres; NW New York, 1/3 million acres; Pennsylvania 1/2 million acres. Of course, not all these agricultural lands drain into Lake Erie but these numbers give some idea of potential dissolved reactive phosphorus input related to soybean production alone.
The Monster Revisited
The super-giant blue-green bacterial bloom of 2011 in Lake Erie required a concerted response from the scientific community to understand just why this had happened. There was no doubt in scientists’ minds that dissolved reactive phosphorus as run-off from agricultural land was a major factor. But why should a super-giant bloom happen in 2011 and not in 2012 when the same agricultural land and its phosphorus run-off were still flanking the Lake and continued to be a constant factor? Something else was involved. So an elite team of scientists from universities, government laboratories, and industrial laboratories got together to investigate, headed up by Prof. Anna Michalak of Stanford University.
Prof. Anna Michalak
In 2013 this team of 29 scientists came up with their report, which was published in the prestigious Proceedings of the National Academy of Sciences.
The team concluded that long-term trends in agricultural practices (e.g. no-till farming) plus increased acreage under intense cultivation (notably soybeans and corn) led to a major pulse of phosphorus into Lake Erie during some unusually intense spring rainstorms in 2011. Then in the late spring and summer unusually quiet but warm weather conditions provided just the right conditions to seed, incubate and grow the bloom in the waters of Lake Erie. The team stated “If a scientifically guided management plan to mitigate these impacts is not implemented, we can therefore expect this [super-giant blue-green bacterial] bloom to be a harbinger of future blooms in Lake Erie.” – because unusual weather events, lower wind speeds, warmer waters, and higher rainfalls are becoming more common and can be expected in the future.
Glyphosate and Blue Green Bacteria
Recent work by scientists at Bowling Green State University has reported the presence of glyphosate in Lake Erie. It is evidently washing out of the no-till crop fields, and reaches a maximum in the summer months. Also it has been found in water treatment plants, peaking in the summer months. Prof. McKay and his colleagues raised the possibility in 2010 that the presence of glyphosate in Lake Erie together with phosphates from fertilizers tend to stimulate the growth of blue-green bacteria, whereas phosphates alone do not do this but favor diatoms, a normal algal component of Lake Erie. It seems that blue-green bacteria can utilize the phosphorus in the glyphosate, which was believed to be otherwise not normally bio-available. Many questions remain to be answered but the intense use of glyphosate in the area around Lake Erie demands rapid action in the very near future to establish just how much glyphosate is involved in blue-green bacterial blooms.
An even more disturbing piece of microbiological and genetic research was done by Prof. Victoria López-Rodas in Madrid together with other Spanish colleagues in 2007. They studied Microcystis, one of the bad boys of the blue-green bacteria family. They found that rare mutations during growth and division of cells could clone a glyphosate-resistant strain that could survive in glyphosate polluted waters. In other words, Microcystis has the potential to develop into a “superbug” unaffected by glyphosate. The odds of a mutation like this occurring were calculated to be a few times in 10 million by Prof. Lopez-Rodas’ team. That’s better than the odds for winning the Jackpot in the Florida Power Ball Lottery (1 in 292 million), but still not great. If you bought hundreds of millions of ticket in the lottery, you would have a good chance of winning at least once, perhaps several times (but at $2 a ticket you financial advisor might have some things to say to you about your investment strategy). However, given a little phosphorus and nitrogen, Microcystis can keep on dividing trillions and trillions of time to form blooms in warm water. With such astronomical numbers, a rare mutation becomes a virtual certainty at some point during cloning, and in the presence of an antibiotic such as glyphosate, a superbug is born.
So far the emphasis has been on phosphorus and how it is important in blue-green bacterial bloom formation. But nitrogen is also very important as a nutritional component for blue-greens and indeed for all life. Green plants need nitrogen to synthesize proteins and other important components in their cells. Although nitrogen is abundant in the atmosphere, it is an inert gas and simply unavailable as a nutrient for many green plants. It needs to be combined with hydrogen (as an ammonia compound) or with oxygen (as a nitrate compound) to be absorbed by the plant. These nitrogen compounds may be naturally occurring in soil, but in agricultural land they need to be added frequently as fertilizer for crops to thrive.
Blue-green bacteria have an advantage over green algae and other green plants because some blue-greens have the ability to synthesize nitrogen compounds directly from gaseous nitrogen – they are said to be able to “fix” the nitrogen. But some other blue-green bacteria are unable to fix the nitrogen and have to depend on another source. Microcystis is a case in point (the blue-green bacteria that are often dominant in the giant blooms in Lake Erie and Lake Okeechobee). Microcystis is highly dependant on a source of nitrogen to thrive. This can of course be provided by run-off from crop fertilizer, but it does not always explain the fluctuations of this and other blue-green bacteria that have or do not have nitrogen fixation ability in Lake Erie, in spite of the fact that the experts all agree that phosphorus – not nitrogen – is the principal limiting factor.
Lucas Beversdorf and colleagues at the University of Wisconsin decided in 2010 to try and solve the problem and improve predictability of toxic blue-green episodes in a beautifully designed and detailed study of Lake Mendota, Wisconsin a much smaller lake (15 square miles) than Lake Erie but about the same depth and with similar temperate seasonal weather patterns.
They found that Microcystis (blue-green non-nitrogen fixer) rode on the back of Aphanizomenon (blue-green nitrogen fixer) in a nutritional sense. Without the nitrogen fixer doing its work first in the spring, Microcystis as a non-nitrogen fixer could not attain dominance and pollute the water with toxic microcystin in the summer. This could be relevant to understanding how the blooms that occurred in the mid-20th century in Lake Erie came about, both Microcystis and Aphanizomenon being important contributors to large blue-green blooms at that time. It could also be important in predicting when blooms can be expected.
Prof. Karl Havens, a biologist at the University of Florida (and formerly of the South Florida Water Management District) has discussed the implications of nitrogen and phosphorus as nutrients for blue-green bacteria in Lake Okeechobee, and the need to reduce both given the physical and biological complexities in a shallow lake.
It has been known for some time that non-nitrogen fixing bacteria are highly competitive when it comes to ammonium compounds in freshwater lakes, possibly explaining why Microcystis and similar blue-green bacteria do achieve dominance in the blue-green blooms when in proximity to agricultural run-off.
Researchers are looking for ways to monitor assess and predict algal blooms of all types. This can be done by sampling the lake waters and analyzing them for various organisms and chemical compounds, such as Dr Beversdorf did for his detailed study of Lake Mendota. However, in very large lakes such as Lake Erie the shear size of the lake makes rapid response to a growing giant algal bloom impossible.
Prof. Joseph Ortiz of Kent State University, Ohio has been actively involved in developing new ways to gather information on giant blue-green bacterial blooms using an instrument on board the International Space Station. From space it can image all of Lake Erie in two days – remember Lake Erie is about 9,900 square miles (241 miles long, 57 miles wide). He uses a technique called hyperspectral visible derivative spectroscopy, quite a mouthful but very important. The hyperspectral imager works in orbit about 220 miles above the Earth’s surface and transmit the results to Dr Ortiz who uses sophisticated analytical methods to identify various types of algae and bacteria in the lake water.
This and related techniques are now being used to forecast blue-green bacterial blooms, in cooperative ventures between NASA and NOAA (National Oceanographic and Atmospheric Administration). For example this was their forecast summary for 2014:
“This year’s forecast is for a western basin Lake Erie cyanobacteria bloom of 22,000 metric tons dry weight (MT), with a 95% predictive interval of 11,000 to 33,000 MT. The bloom size over the last decade (2004-2013) has averaged 14,000 MT, such that this year’s bloom will likely be above average. However, the 2014 bloom is expected to be less than the record bloom of 40,000 MT, which occurred in 2011.”
In August of 2014 the City of Toledo shut down its water supply because of contamination by blue-green bacterial toxins (microcystin), which made it undrinkable for 400,000 residents, confirming the astonishing power of this predictive method.
A Florida Mismanagement Plan for Niagara Falls
Just imagine if the same planning “logic” had been applied to Lake Erie as has happened with Lake Okeechobee. In the case of Lake Okeechobee, agricultural interests took over an Everglades river and associated sawgrass wetlands to drain them for use as sugar plantations. To do this the ancient course of an Everglades river was disrupted by damming its 25-mile wide outflow from Lake Okeechobee, upstream from the Everglades Agricultural Area. In so doing the lake level rose because it had no other natural outlet. Therefore higher shoreline dike construction was needed (the Herbert Hoover Dike) to impound the water to prevent flooding of the adjacent land. All this destroyed a large part of the Everglades, a natural wonder of the world designated an International Biosphere Reserve and a World Heritage Site by UNESCO and a Wetland of International Importance. The “river of grass” in the Everglades became starved for water.
Everglades River of Grass
Meanwhile, the Kissimmee River feeding into Lake Okeechobee and draining another agricultural area was straightened and canalized to remove those annoying meanders that characterize river systems as they approach local base level (the lowest point to which a river can flow). The straightened channels thus allowed rapid fertilizer run-off from the fields, preventing filtering and bio-cleansing in the natural wetland vegetation of the flood plain meanders that would otherwise exist, further contributing to heavy phosphorus loading in Lake Okeechobee and the consequent blue-green bacterial blooms. The straightened channels also contributed voluminous extra water that the lake could not handle. Therefore, the lake managers and flood controllers (the Army Corps of Engineers) directed the overflow waters down a number of canals with outlets to the highly populated Atlantic and Gulf coastlines and the sea, the overflow water being heavily polluted with blue-green bacteria from the giant blooms that grew in the lake.
So let’s work this through for our imaginary Niagara Gorge Agricultural Area, a 7-mile stretch that would be ideal land for growing grapes and other fruits in a valley just below Niagara Falls. Once drained, the imaginary agricultural area would eventually develop lime-rich soils, which would be perfect for high quality wine grapes, and would be similar to the soils in the adjacent Niagara Wine Country. The fruit would be sheltered from the worst of the Canadian winter that might otherwise be unfavorable for growing and ripening the grapes. There would be one big problem: there is too much water in the Niagara Gorge, which transports the Great Lakes waters through the Niagara River into Lake Ontario.
So, the imaginary managers deemed that a dam would be necessary across the Niagara River upstream from Niagara Falls to divert the water elsewhere, and help to drain the Gorge. They knew this would be entirely possible because the Army Corps of Engineers had dammed the Niagara River once before to make repairs to the Falls, back in 1969. Of course, the magnificent Niagara Falls, a real wonder of the world, would cease to exist. Meanwhile, the Lake Erie water level would start to rise and bigger and better dikes would be needed, particularly around population centers such as Buffalo, Cleveland, Toledo, and Detroit, to prevent flooding. This in turn would raise the base level of the inflowing rivers and they would back up and tend to flood more frequently. The imaginary managers decided to straighten the meander channels of the rivers to allow quicker drainage, but this in turn sent a high discharge of agricultural phosphorus run-off into the Lake. The higher loading of phosphorus triggered gigantic blue-green bacterial blooms.
Clearly an outlet would be needed for the imaginary re-engineered Lake Erie high-level water, so the imaginary lake managers decided to discharge the lake water somewhere else. Very fortunately, an older structure – the Erie Canal – still existed and would be ideally suited for modification to act as a spillway or overflow channel. The Erie Canal in turn would channel the water from Niagara into the Hudson River and out into the Atlantic Ocean near New York City. Unfortunately the voluminous discharge of polluted freshwater from the Lake would do two things. First, the blue green bacteria would thrive as the discharge water slowed and became semi-stagnant in the estuaries and coastal regions around Manhattan during the summer. Secondly, the marine wildlife would be severely impacted due to the drastic reduction in salinities by mixing with freshwater. This would lead to the mass death of marine life, together with animals and plants that thrive in marginal marine and brackish environments such as oysters and clams. Millions of New Yorkers and those in adjacent areas would become enraged because the grape and fruit growers in the Niagara Gorge Agricultural Area have caused all this in the first place, due to their insistence on the change of land usage. Meanwhile, the farmers in the newly established Niagara Gorge Agricultural Area are thriving and unaffected by these changes, and blame the towns and cities for inadequate sewage treatment and leaky septic tanks.
Of course, all this is nonsense and absurd – a figment of my imagination. It wouldn’t happen in real life, would it? No one could be that inept or uncaring – or could they?
The chances of such a catastrophe happening in real life are very slim in the Niagara region. Any move by a special interest group planning to monopolize a Great Lakes’ resource would come under the immediate scrutiny the International Joint Commission. In all likelihood they would jump on such a rapacious scheme like a ton of bricks and it would never see the light of day.
It’s a great pity that the people of Florida don’t have an equivalent body with overarching responsibility for maintaining the quality of Florida waters for all Floridians. Unfortunately, sensible planning initiatives over the decades have been circumvented, and most state politicians have been incapable or reluctant to fund policies directed towards protecting Florida’s water resources. It is a dismal story of failure to protect Florida’s natural resources, and continues to be fueled by campaign contributions from Big Sugar to Tallahassee. The more-than-century-long story has been insightfully summarized recently by Jaclyn Blair, a law student at Florida Coastal Law School, Jacksonville, graduating this year (2017) as Juris Doctor. It is recommended reading for anyone wanting to understand the various parts played by corporate interests, citizens concerns, politicians, policies, legalities, and constitutional amendments regarding the destruction of Florida’s natural resources.
I didn’t think up this sub-header, but thanks to PBS for producing a video of that name. In 2007 PBS published this synopsis of their program:
“During the past 125 years, a series of well-intentioned decisions, actions and policies have turned what should have been one of Florida’s greatest natural treasures into an environmental villain. Six thousand years later after if was formed, residents and agencies across the state are now raising the questions: Is it too late for Lake O?”
In 2017 the question is still valid.
Let’s start with the Manager of Lake Okeechobee, the South Florida Water Management District (SFWMD), which describes itself as follows in its mission statement:
“OUR MISSION: To manage and protect water resources of the region by balancing and improving flood control, water supply, water quality and natural systems.
The South Florida Water Management District is a regional governmental agency that manages the water resources in the southern half of the state, covering 16 counties from Orlando to the Florida Keys and serving a population of 8.1 million residents. It is the oldest and largest of the state’s five water management districts. Created in 1949, the agency is responsible for managing and protecting water resources of South Florida by balancing and improving flood control, water supply, water quality and natural systems.
A key initiative is restoration of the Everglades – the largest environmental restoration project in the nation’s history. The District is also working to improve the Kissimmee River and its floodplain, Lake Okeechobee and South Florida’s coastal estuaries.”
Now, let’s take a look at Lake Okeechobee’s basic statistics. It is 730 square miles in area (about 36×29 miles in longest dimensions), very shallow with an average depth of about 9 feet, varies from about 12 ft to 18 ft above sea level, and has a total volume of water of about 1 cubic mile (for comparison, Lake Erie is more than 100 times greater in volume but only about 13 times larger in water surface area). Lake Okeechobee is the largest lake in the contiguous United States, outside the Great Lakes.
Until about 1930, the lake had a natural outflow about 25 miles wide on its south side allowing water to enter the Everglades system. From about 1930 to 1960 a dirt dam was progressively built, 143 miles in length, and extended all around the Lake as the Herbert Hoover Dike. This converted Lake Okeechobee from a dynamic system of seasonal inflow and outflow into a semi-stagnant reservoir, with emergency releases of overflow water into canals discharging east and west into the Atlantic Ocean or the Gulf of Mexico, along heavily populated coastal areas.
Muddy Waters
SFWMD has scientists and engineers working on various aspects of water quality in south Florida, including Lake Okeechobee. For more than half a century, the Lake Managers have been collecting information on water quality such as water chemistry, amounts of phosphorus and nitrogen, temperature, turbidity, and so on. That, of course, is their job as a management agency, and each year they and their contractors collect more than a quarter million samples for analysis, many from Lake Okeechobee. In addition, NOAA has a weather station on the southern rim of the lake and these meteorological data can be integrated with the Managers’ observations on lake water. This is really important information. However, their attention to details of biological data seems to be less precise. Their definitions of bloom formation is based, generally, on the amount of a particular type of chlorophyll extracted from water samples, rather than information on the number and concentration of particular types of bacteria or algae. Nevertheless their information is important, and the Lake Manager’s scientific staff have produced many significant reports analyzing these data to try to explain why bacterial blooms form in the waters of Lake Okeechobee.
Of first rank importance was the assessment by the Lake Manager’s scientists that Lake Okeechobee was eutrophicating, that is becoming enriched in dissolved nutrients (such as phosphates) that stimulate the growth of aquatic plant life usually resulting in the depletion of dissolved oxygen.
Another report by the Lake Manager’s scientists documented the continuing increase and doubling of total phosphorus in the Lake between 1973 and 1984. Fluctuating lake levels and/or resuspension of soft bottom muds my have been involved in the increase. However other studies drew attention to the burgeoning intensive dairy and beef cattle industries to the north, starting in the 1950s, providing nutrients from agricultural run-off flowing down the Kissimmee River into Lake Okeechobee, together with nutrients entering the Lake system from the sugar cane industry to the south of the Lake, often by back-pumping.
Other scientists employed by the Lake Manager attempted calculations to balance the amount of phosphorus flowing from the Kissimmee River into the Lake from the cattle farms to the north, compared with the amount being discharged principally through the St Lucie and Caloosahatchee Canals to the east and west. Their numbers suggested that between 1973 and 2002, each year on average almost 300 tons of phosphorus ended up sinking to the bottom of the Lake. In the early 2000s the situation had reached crisis proportions because the bottom sediments in the Lake had become thoroughly saturated with phosphorus. Any further phosphorus would not have bonded firmly to the bottom sediments but would be available in the lake water for biological activity. In other words, eutrophication was predicted to become much worse, which meant more organisms growing in the lake waters.
Other studies by the Lake Manager’s scientists looked at meteorological information from NOAA and discerned a complex inter-relationship between wind speed, rainfall, inflow from the Kissimmee River, and lake levels, apparently related to “algal” (i.e. bacterial) bloom formation (that is as judged by the amount of chlorophyll extracted from water samples). They also noted a steady increase in lake levels between 1972 and 1978. The maximum amount of algal/bacterial material occurred between May and September in calm summer months when the water temperature typically reaches into the mid-80s.
So the Lake Manager’s scientists had come up with some interesting possibilities as to what conditions promote blue-green bacterial bloom formation, but not everything matched and not everyone agreed. This was a real tough nut to crack. Something seemed to be missing in the puzzle. But some scientists were concerned enough to state in 2009 “that the [Lake Okeechobee] ecosystem is at risk for continued and perhaps worsened eutrophication symptoms under current P [phosphorus] loading conditions.”
Descending the Murky Depths
In 1994 Dr. P. Moore, a soil science researcher attached to the University of Arkansas and Prof. K.R. Reddy of the University of Florida came up with a new idea. It might not be just the lake water that was involved in bloom formation, but the sediments on the bottom of the lake might be implicated in promoting higher phosphorus levels, and particularly the extent of acidity and oxidation or reduction near the sediment-water interface. They arranged for scuba divers to swim down to the lake bottom with special plastic tubes to be pushed into the mud. The divers brought back several cores of the mud for analysis in the laboratory. What they found was that phosphorus can be released from the lake muds when the water mixing with the mud is reducing (i.e. little or no oxygen) and/or acidic, and particularly if iron oxides and iron hydroxides are also present. This is important in a shallow lake where wind can cause the water column to be mixed, bringing oxygen down to greater depths, which assists in retaining phosphorus in sediments. However, in the case of Lake Okeechobee, winds in the calm summer months tend to be minimal, and oxygen concentrations diminish at the lake bottom. Therefore, the reducing conditions help to release phosphorus in the water, just as the water temperatures increase optimally to 75-80 degrees F favoring the growth of bacteria.
Prof. Ramesh Reddy
Glyphosate in Lake Okeechobee
It’s interesting that Dr. Moore’s and Prof. Reddy’s observations about phosphorus release being favored by acid conditions and iron oxides/hydroxides parallels Prof. Spiese’s work on glyphosate in Ohio, which also implicates acidity and iron oxides and hydroxides in the release of phosphorus from cultivated fields and the growth of blue-green bacterial blooms in lakes. Maybe something similar is happening in Lake Okeechobee and surrounding cultivated land.
Well, is glyphosate really present in Lake Okeechobee? I searched the Lake Manager’s website and noted that as early as 2000 glyphosate was being used to exterminate several thousand acres of cattails in and around the lake by aerial spraying.
In addition, the agricultural areas around Lake Okeechobee and in the Kissimmee River watershed are awash with glyphosate, and the farmers appear to have been enthusiastic users since the early 1990s according to the U.S. Geological Survey, whose maps are reproduced below (one for 1992 and another for 2014, but there are others for the in between years).
But the strongest evidence of all for recent years comes from the website of the US Army Corps of Engineers. They head up the Lake Okeechobee Aquatic Plant Management Interagency Task Force, which has this mission statement:
The Corps of Engineers shall chair, and actively solicit participation in the Lake Okeechobee Aquatic Plant Management Interagency Task Force. The Task Force members will represent State of Florida agencies (including the Florida Fish and Wildlife Conservation Commission and the South Florida Water Management District), state Universities, the Corps of Engineers, and other Federal agencies. The Task Force will serve in an advisory capacity, providing multi-disciplinary technical and scientific data from which the Corps’ aquatic plant management strategy, methodology, and research planning and operational efforts will evolve. The focus of the aquatic plant effort will be to benefit the overall ecological health of Lake Okeechobee.
So now it seems that there are two lake managers: The US army Corps of Engineers on the one hand, and the South Florida Water Management District on the other. The Army Corps of Engineers, as well as having absolute authority to open the floodgates for Lake Okeechobee whenever it deems this necessary, has also now got control of the program to exterminate various aquatic plant species by use of powerful herbicides. Is this a matter of too many chiefs and not enough Indians? The Mission of the Army Corps of Engineers is clear: The U.S. Army Corps of Engineer’s mission is to provide vital public engineering services in peace and war to strengthen our Nation’s security, energize the economy, and reduce risks from disasters. Their Vision is equally clear “Engineering solutions for our Nation’s toughest challenges.” Their Motto is clear “Building Strong”. The potential conflict between the two Managers (ACE on the one hand, SFWMD on the other) needs to be rationalized and sorted out to achieve sensible results.
So what can ACE tell us about glyphosate? From time to time the Army Corps of Engineers posts their schedule for spraying programs to control aquatic plants in Lake Okeechobee. For example, they used glyphosate in July 2016 for extermination of cattails in Lake Okeechobee and again in March 2017. So glyphosate is present in Lake Okeechobee, definitely from Army Corps of Engineers’ activities and the SFWMD, starting as early as 1988:
The presence of glyphosate is highly probable from farming activities around and upstream from Lake Okeechobee. It has already been noted that glyphosate may stimulate blue-green bacterial growth, and that the cloning by natural selection of glyphosate-resistant strains is also possible. The Lake Managers have yet to come up with an up-to-date, complete analysis of Lake Okeechobee waters, showing how much herbicide is present – at least I have not been able to find it on their websites or other relevant publications – and how many toxins such as microcystin have been detected on a routine basis. Surely the public has a right to know this vital information.
Where has all the Water Gone?
Well the problem is that the water in Lake Okeechobee generally does not go anywhere, or not where it is meant to be, that is into the southern Everglades. The various planning decisions and missteps over the years have converted Lake Okeechobee into a vast semi-static reservoir. From time to time it gets overfull, even with an enlarged dike, and great volumes of water have to be released by the Army Corps of Engineers to the St Lucie River and the Caloosahatchee Rivers with dire results.
An impressive report appeared in 2015 by a team of experts headed up Prof. Wendy Graham of the Water Institute of the University of Florida. The title of the report says it all: “Options to Reduce High Volume Freshwater Flows to the St. Lucie and Caloosahatchee Estuaries and Move More Water from Lake Okeechobee to the Southern Everglades. An Independent Technical Review by the University of Florida Water Institute”.
It is a very detailed and comprehensive report and well worth reading because it was produced independently at arm’s length from the politicians, and it is for the most part written in plain and comprehensible language. It discusses many options to solve the problem and to start getting the lake water back down to the southern Everglades.
To my mind, the key thing is to include bio-cleaning and remediation of the lake water before it passes south too far down the Everglades system. Constructed wetlands for water treatment have been in use since the mid-1950s, including several system using cattails, reeds, and other aquatic plants to remove such things as nitrogen, phosphorus, and other pollutants from waste water. Such systems could be utilized to good effect in the reservoirs anticipated in areas south of Lake Okeechobee, in effect being “reconstructed wetlands” in place of the former sawgrass plains.
To its credit, the South Florida Water Management District has constructed several large wetlands called Stormwater Treatment Areas, which are designed to remove excess phosphorus and other nutrients from waters immediately north of the Everglades Protection Area. One of them in western Palm Beach County STA-3/4) is the largest constructed wetland in the world.
If the overflow water from Lake Okeechobee is not cleaned to rigorous standards, it will fail to reach the high standards of purity required by federal regulators of the Miccosukee Indian tribal lands in the Everglades south of Alligator Alley (see my blog “Sugar and Indians”):
Well, all the above makes for pretty dismal reading for the most part. But there are several rays of sunshine cutting through the mess that has been created to suggest that all is not lost. Up in Lake Erie there’s a lot of activity on both sides of the border in reconstructing wetlands to replace those lost to drainage and infill schemes over the last century. New treatments are being invented to remove phosphorus and other pollutants from the run-off water before it hits the lake. Some of the links below will lead you to more details.
Down in Lake Okeechobee, the South Florida Water Management District is showing the world how to build gigantic constructed wetlands as a start to cleaning up the Okeechobee water ultimately destined for the southern Everglades. And Florida’s politicians are now making major inroads into passing legislation to fund these schemes, such as Senator Joe Negron’s continuing efforts to get the state House and Senate to agree.
Click to see recent satellite images of Lake Okeechobee and algae-full images from this summer: http://www.thurlowpa.com/LakeOImagery/ (Compiled by Todd Thurlow)
I am lucky to know a lot of people who are smarter than me. And one of them is my brother. Ever since we were kids Todd read meteorological books or the Guinness Book of World Records. He likes data. Today, over forty years later, he is helping me apply his knowledge of data to the St Luce River/Indian River Lagoon.
If you are a regular blog reader, you know that this past summer Todd helped publicly identify what became a 240 square mile algae bloom in Lake Okeechobee that was being released into the C-44 causing our river to become toxic. Today, I will share his ideas on avoiding the perfect toxic algae storm.
Here is a photo of Todd and I when we were young in the 70s, when the river was in better shape and we were having fun fishing on Ronnie Nelson’s dock on Hutchinson Island.
Here is a photo of Todd and me today. As you can see we have changed a lot and the river has changed too…
After studying these satellite aerials for a while, I can tell that the blooms are definitely related to sunlight and wind..Our scientists friends would sarcastically say, “no kidding?!”
High pressure system -> a lot of sunlight + no wind = bloom. Clouds + wind = less algae.
The fresh water, phosphorus and nitrogen are always in the lake, but not necessarily the river. Luckily, cloudless days are also the perfect time to spot the algae by satellite.
Maybe the ACOE should add to their discharge schedule that they will hold back the releases when it is forecast to be calm and sunny for several days to prevent the risk of and bloom in the estuaries? Then they can pulse the releases again when the clouds and wind pick up and the algae blows away in the lake – kind of like mother nature.
Jacqui: “Always better if we go with Mother Nature so we don’t end up with such ecological disasters…”
Todd: ” I think Gary Goforth, Mark Perry and others would tell us that the disaster timeline sets up like this:
– A low pressure weather system moves into Florida and dumps a bunch of rain, local runoff begins and the lake starts to rise
– They keep S-308 at Mayaca an other lakeside gates closed and open S-80 because the priority is always to transport the “local” runnoff first and not add to flooding problems by sending lake water through the coastal canals
– The local basins start to drain out and a high pressure weather system moves in. It gets sunny, hot, and the wind dies down to zero.
– With a lot of sun and no wind, the lake starts to bloom. With local runoff subsiding, the tides help flush all to local runoff out to sea but not completely.
– Just when conditions in the lake are “the perfect storm”, the estuaries would otherwise be recovering from the local runoff, the lake is in full bloom and rising, S-308 is now opened to drop the lake at the worst time. All the algae that just exploded in the lake is transported down C-44 through S-80 and into to estuaries. Salinity in the estuaries stays low instead of naturally recovering. With the sunny conditions and unnatural discharges, the estuaries explode with algae blooms.
If they would just delay opening S-308 for just a few days, maybe a week, allowing clouds and wind to return, could the perfect storm be avoided?”
T3
You can access more of Todd’s shared data here under FIRM FAVORITES: http://www.thurlowpa.com
__________________________________
Thank you Todd! Hope the ACOE thinks on this. We don’t want to get in the Guinness Book of World Records 2016 for the estuary with the most toxic algae blooms!
Sometimes I feel like I’m living in a Carl Hiaasen novel….
On June 16th, I attended a Water Resources Advisory Commission meeting of the South Florida Water Management District.
Of course, by this time, a 33 square mile algae bloom, parts toxic, had been documented in Lake Okeechobee by the Department of Environmental Protection. The St Lucie River, having been discharged into since January 29th, was looking pretty disgusting. Tempers flared.
At the WRAC meeting, water advocates, not just from Martin County, but from around South Florida were once again pleading with the SFWMD Board of Directors to “endorse buying land south of the lake in the EAA for storage, cleansing and conveyance to the Everglades in order to stop damaging discharges to the estuaries and restore freshwater to Florida Bay.”
“Send the Water South!” rang through the rafters. “Send the Water South!” As usual, the Board looked straight ahead….
And then the presentations came, and a well spoken District scientist started taking about the “The Lake Okeechobee Watershed Project,” and how it is tied into the Comprehensive Everglades Restoration Plan form 2000. —-It’s time had come…
A slide appeared showing pink, green, brown, and blue— representing the watersheds of Fisheating Creek, Indian Prairie, and Taylor Slough northwest of Lake Okeechobee.
ACOE Lake Okeechobee Watershed Project
According the Army Corp of Engineers who also attended the WRAC “the objectives of the Lake Okeechobee Watershed, or “LOW Project, “are to improve the quality, quantity, timing and distribution of water entering Lake Okeechobee, provide for better management of lake water levels, reduce damaging releases to the Caloosahatchee, and St Lucie estuaries downstream of the lake, and improve the system wide operation flexibility.”
It is a probably good project… No doubt. Do you wonder more about what goes on behind the scenes? Surely….
It is ironic that when the message of the people is “Send the Water South!” the government is finally getting around to “Blocking the Water North!”
Maybe one day we will all be on the same page so our lives don’t seem so much like a characters in a Funny Farm.
Life’s ironies abound.
Here’s the meeting information. A drive from Stuart to Okeechobee is about 40 minutes.
A “Lake Okeechobee Watershed Project NEPA Scoping Meeting will be led by ACOE’ Gretchen Ehlinger, Ph.D. Senior Biologist in the Okeechobee Auditorium, 3800 NW 16th Boulevard, Suite A, Okeechobee, FL 34972, on Tuesday, July 26 with an open house beginning at 6 p.m., followed by an official presentation at 7 p.m.
As this meeting is run by the ACOE, this meeting will only be able to address the LOW Project.
Let’s all attend the meeting even if Dr Ehlinger has to focus on the northern watershed. Maybe we should invite Carl Haaisen?
First page of letter ACOE dated June 28, 2016Page 2.
Cropped image, full image at end of this post. Red shows algae bloom’s size as calculated and drawn by Todd Thurlow. The present bloom in Lake Okeechobee is estimated to be 239 square miles as shown in this NOAA satellite image on 7-2-16 and shared by FOS on 7-6-16.
In the aftermath of last week’s media frenzy and State of Emergencies, let’s consider the following:
1.This year, the ACOE has been discharging from Lake Okeechobee into the St Lucie River/Indian River Lagoon since January 29th, 2016. This has caused the estuary’s waters to become fresh.
2. Lake Okeechobee is a freshwater lake and this year contains a gigantic algae bloom that was first documented to be 33 square miles located in the south-eastern quadrant of the lake, on May 9th, 2016. This bloom is cyanobacteria/microcystis, a fresh water bloom. It does not grow in salt/brackish water. As the estuary has been made fresh, the cyanobacteria can grow here too. This bloom in the lake is now approximately 239 square miles as calculated by my brother Todd Thurlow. Florida Oceanographic has shared this overlay on a NOAA satalite image.
Shared on Facebook by person flying over lake O in early May, bullsugar.org
3. On May 23rd, 2016, Martin County reported that a sample was taken by DEP (The Florida Department of Environmental Protection) upstream of S-308 at Port Mayaca, at 24.4 micrograms per liter (mpl) qualifying as a threat to human health by the World Health Organization’s limit of 10 micrograms per liter. According to Mark Perry two more samples were taken on June 15th and came back at 280 mpl and 387 mpl. The government obviously knew this bloom was toxic, but they kept dumping and did not warn people of what could occur.
4. As the the river was becoming full of algae, on May 30th, 2016 my husband Ed Lippisch flew over S-80 taking photos of algae going through S-80 into the east side of the C-44 canal and into the St Lucie River/Indian River Lagoon. This was done again later by Dr Scott Kuhns. The algae has been coming through for months.
S-80 5-30-16 Ed Lippisch
S-30 5-30-16 Ed Lippisch
5. More photos were taken and shared to document the bloom in the lake on June 26, 2016 as citizen were concerned about algae bloom in the St Lucie River and even beaches but no communication from state or federal agencies as to causes was provided. The people had to blow up before the government would do anything.
Pilot Dave Stone Lake Okeechobee bloom 6-26-16
6. By June 29th, 2016 the St Lucie River’s bloom was “peaking” and blooms were reported along the river in every area of the county. People were panicking. By June 29th, 2016, finally the Martin County Commission, and then Governor Scott had called for a “State of Emergency” helpful for recovering monetary losses but not for health protections or stopping the discharges from Lake O.
Jamie Burns week of June 26th, St Lucie River full of algae bloom from Palm City to Sewall’s Point.Canal off of Sunset Trail near North River Shores, Stuart. Week of June 26th, Baskin family.
7. After emergency state, ACOE’s Col Kirk toured the area and thankfully the ACOE temporarily cut back but did not stop releases to the estuaries.
8. At the tail-end of this crisis something very serious happened. This Tuesday it was reported that the bloom at Bathtub Beach tested on June 30th registered at 414 micro grams per liter. 10 qualifies as toxic. This number is off the chart. This number sits on a DEP web site but no one is discussing it. Why not?
Alge bloom at Bathtub Beach week of June 26th. JTLReport on Bathtub Beach DEP
How can something so dangerous to our citizens and wildlife not be stopped when we know where it is coming from?
Certainly our own dirty water runoff, fertilizer, and our own disgusting septic tanks exacerbate the situation, but they did not start this algae debacle. Dumping from Lake Okeechobee did. This needs to stop.
Under present water law Lake Okeechobee is does not quality as “point source pollution.” If it did a permit would be required to dump into our estuaries. The National Pollutant Discharge Elimination System (NPDES) is the point source discharge permit program authorized by Section 402 of the Clean Water Act.
“All point source discharges to surface waters (“Waters of the United States”) must have an NPDES permit. Permits are issued by EPA and authorized state programs.”
And the bloom? As mentioned, it is getting bigger.
Yes, according to Florida Oceanographic Society, it has grown from 33 square miles to approximately 239 square miles, almost half the lake.
Maybe if it fills the entire lake it won’t only be point source pollution, but the government will get the point. The government is now regretfully poisoning its own people. Laws must be changed. The state’s pluming must be changed. Lake Okeechobee is definitely the point–the point of our point source pollution.
New calculations estimate the algae bloom in Lake Okeechobee to be 239 square miles. Based on the latest images from NASA on July 2nd, the algae bloom has grown from 33 square miles on May 9th to now take up almost 1/3 of the lake. “This toxic algae is what has been discharged into the St. Lucie Estuary and the Indian River Lagoon, making its way through our waterways and onto local beaches. We need to stop the discharges from Lake Okeechobee and send the water south the Everglades, where it is desperately needed.” – Mark Perry, Executive Director (Image created and calculated from NOAA image by Todd Thurlow)
Latest Coverage via Florida Oceanographic Society:
Watch Full Video of WPBF 25 News Special: Algae Crisis from 7/6
Reeking, Oozing Algae Closes South Florida Beaches, New York Times
Toxic Algae Bloom Severely Impacts Local Businesses, CNN
Florida’s Biggest Lake Fouls Coastlines, Orlando Sentinel
Scientist Cautions Blue-Green Algae Can Have Serious Health Impact, WPBF News
Toxic Algae Bloom Crisis Hits Florida, Drives Away Tourists, Tampa Bay Times
Algae Stink Mucking Up Beaches, Business, Stuart Residents Say, WFTV News
1. Lake O algae 6 26 2016Map of bloom2. Lake O algae 6 26 2016SFWMD canal and basin map. C-44 canal is the canal most southerly in the image. S-308 is at the lake, Port Mayaca and S-80 along the C-44 canal. Both discharge into SLR.
Today’s photos were taken by Dr Gary Goforth this past Sunday. During a trip, he flew over Lake Okeechobee.
He writes: “Jacqui–The photos are of the southeast part of Lake; the plane had just passed over Clewiston and is headed northeast. The city of Pahokee is visible along the upper right shoreline. The FPL reservoir is visible in the background. The bloom is enormous – easily over 100 sq miles in extent, although areas are patchy.” GG
___________________________________________
STATE OF EMERGENCY
It’s hard to understand state of emergencies.
Martin County waters are experiencing their third “state of emergency” since 2013–two of those being this year in 2016.
Yesterday, Governor Rick Scott declared one, after our county commission declared one first, over the blue-green algae blooms in the St Lucie River, Indian River Lagoon and Atlantic Ocean —I am very grateful.
What I do not understand is that when you really read between the lines, we will continue to be under siege.
After one sifts through the words of the declaration there are basic things that stand: the emergency order directs Water Management Districts and the Florida Wildlife Commission to stop flows into the lake as soon as possible coming from the north. It also allows a waiver of requirements to purchase pumps to move water south, and increases water testing.
This is all good and well, but there is one problem. This means the discharges from the lake continue– perhaps lessened, but they will continue…full of the same algae that is causing the emergency in the first place. And the lake is very high at 14.90. The dumping could go on for months even if no new water enters the lake from the north…
Until the gates at S-308 and S-80 are closed we will suffer. Like having the dike too high is a safety issue for those south of the lake, sending the lake’s algae waters to the St Lucie River is a safety issue too. Take a look.
In our continued documentation of the 2016 Lake Okeechobee event, my husband Ed and I flew over the St Lucie River/Indian River Lagoon around 5:00pm on Father’s Day, 6-19-16, at the very end of an outgoing tide. Being a stormy day, there was poor lighting, but it was easy to see the darkness that enveloped the river due to the discharges of surrounding agricultural canals, and tidal runoff, and especially the high and long-going releases from Lake Okeechobee. The dark plume hugged the coast and jutted far out into the Atlantic having no clear edge as it was churned up from high winds and waves. Nonetheless from above, it’s shadow was visible for miles all the way south to the Jupiter Inlet.
Over the weekend there were multiple reports of algae blooms throughout the river and canals. Below are photos from a family boat ride in the vicinity of the Harborage Dock in Downtown Stuart yesterday, showing foam and algae at the shoreline and tiny specks of algae dispersed throughout the entire river.
“One resident nearby of Stuart, Dr Vopal, texted: “The river is pea green! …It is time for the legislators to look at this river and consider the health of the people that live on it. ”
Over the weekend just to me and on Facebook there were reports of algae blooms not only in Stuart but along the C-44 canal, the condo/marinas along Palm City Road, the eastern area of Lake Okeechobee itself, the St Lucie Locks and Dam, the St Lucie River near Martin Memorial Hospital, Sandsprit Park, Phipps Park, and Poppleton Creek. Certainly there were many others.
As most of us know, the Army Corp of Engineers has been discharging into the St Lucie River since January 29th, 2016. The river is almost completely fresh thus these freshwater blooms— that are in the lake and upper agricultural canals prior to being released into our river (cyanobacteria is a freshwater bloom)—and then they spread throughout the river once it too is fresh from all of the discharges. Since the ACOE has been releasing since January and there has been so much rain conditions are really bad.
Ed and I will continue to document. Our region’s entire quality of life is at stake. Nothing affects our local economy more than our river. We all must continue pushing to send water south to be cleaned and conveyed to Everglades National Park as Nature intended. Call our elected officials at every level. And vote on Aug 30th in the primary.
Fondly,
Jacqui and Ed, #Skywarriors since 2013
Photos of SLR/IRL -Sewall’s Point, Sailfish Point, St Lucie Inlet, Sailfish Flat’s former seagrass beds, Jupiter Island, Atlantic Ocean’s “protected” nearshore reefs.
^-19-16 Ed Lippisch and Jacqui Thurlow-Lippisch view the confluence SLR/IRL over Sewall’s Point, Sailfish Point, Sailfish Flats, St Lucie Inlet, Jupiter Island, Atlantic Ocean.
Photos shared over weekend: Phipps Park, C-44 canal, St Lucie Locks and Dam, Sandspsprit Park also from family Father’s Day boat ride Harborage Marina, Downtown Stuart.
…
Foam and algae blooms in the area of Harborage Marina, Downtown Stuart, near the Roosevelt Bridge.
Harborage Marina near Roosevelt Bridge.
Lake O algae bloom shared by boater and posted by M. Connor just prior to weekend.
Pre weekend- Photos of an algae bloom in Lake Okeechobee on the east side of the lake. These photos were shared on Facebook by a river warrior and then by Michael Connor.
Sources of water ACOE/SFWMD june 2016SFWMD canal and basin map. According to Florida Oceanographic only 17% of water went into the SLR before the agriculture canals of C-23, C-24, and C-44 were dug in 1920s-1960s. Lake Okeechobee discharges on top of canal dumps are killing an already very stressed estuary. These waters must be redirected south and stored in other places that need the water. This overabundance of water is killing the St Lucie.River Kidz and Treasure Coast Rowing Club youth led a river clean up and planting of native vegetation to filter water during incoming and outgoing tides at Poppleton Creek. The creek was filled with an algae bloom. photo TC Palm
As many of us have read in Ed Killer’ excellent TCPalm article, the discharges from Lake Okeechobee have surpassed the level of 2013, the “Lost Summer.” As my husband Ed and I go up fairly regularly in the Cub, I will attempt to share shorter more frequent posts with more aerial photos of the St Lucie River/Indian River Lagoon in order to document this year’s continued destruction.
This destruction is not expected to stop anytime soon as Lake Okeechobee yesterday was reported at 14.77–very high for hurricane season. Last year, on 6-10-15, the lake stood at a “comfortable” 12.58. As we know, the entire reason we are being dumped on is because the water cannot go south as Mother Nature intended.
The photos below were taken 6-15-16. The ACOE has been releasing since January 29th, 2016. Today is June 17th, 2016. All charts below showing basin water inputs of area agricultural canals and tidal runoff are courtesy of the South Florida Water Management District and Army Corp of Engineers’ Periodic Scientists Call.
Aerial photos taken by Ed Lippisch at the confluence of the St Lucie River and Indian River Lagoon around Sewall’s Point, Sailfish Point, Manatee Pocket and St Lucie Inlet 6-15-16, formerly the richest seagrass beds in the county as well as North America.
All aerials in the area of Sewall’s Point and Sailfish Point by Ed Lippisch, 6-15-16.
Today I will share aerial photos of the Manatee Pocket area around Sandsprit Park taken yesterday by my husband, Ed Lippisch, and a short written update by Dr Gary Goforth dated 6-12-16.
Manatee Pocket lies close to the St Lucie Inlet just across from Sewall’s Point. It once was the mecca for the St Lucie River/Indian River Lagoon commercial fishing business. The Lake Okeechobee discharges continue having started by the Army Corp of Engineers January 29th of this year and are approaching the level for all of 2013. Lake Okeechobee yesterday was reported to stand at a very high for this time of year 14.77 feet—-There is no end to discharges in sight for the St Lucie River. Conditions are very bad and the state and federal government are stuck in a pattern that is killing our quality of life and economy.
There must be a better way…
For the St. Lucie, the 2016 Lake discharges: – exceeded 133 billion gallons (compared with 136 billion gallons for 2013) – dumped more nitrogen, phosphorus and sediment than the “Lost Summer” of 2013 – dirtier than 2013 (higher concentrations of nitrogen, phosphorus and suspended sediment) – have exceeded the nitrogen and phosphorus TMDLs for the C-44 Canal by 600% For the Caloosahatchee, the 2016 Lake discharges: – have exceeded 302 billion gallons (compared with 456 billion gallons for 2013) – are dirtier than they were in 2013 for nitrogen and phosphorus
Gary Goforth, (garygoforth.net), 6-12-16
Photos of SLR at Manatee Pocket, Ed Lippisch, 6-15-16.
Aerial of S-80 at St Lucie Locks and Dam. Visible cyanobacteria bloom flowing through S-80 from western area of C-44 towards the St Lucie River. These blooms were documented in Lake Okeechobee and around S-308 weeks ago and are now being released into our now fresh river. Photo Ed Lippisch.
I have been questioning the sick irony of the government sanctioned “toxic algae” releases into the St Lucie River since 2014. This was questionable, until now…
Let’s back up a bit…
My blog post on July 8th, 2014 was entitled: “Do the ACOE and SFWMD Release Lake Okeechobee Into to SLR When There is Toxic Algae?”
At that time there was a question for me; now there is not.
The 2014 post told the story of seeing cyanobacteria’s fluorescent blooms in the lake when my husband Ed and traveled through the St Lucie River to Lake Okeechobee by boat passing the St Lucie Locks and Dam (S-80) and Port Mayaca, (S-308) in 2009. This was just when I was beginning to focus my interests on the health of the St Lucie River/Indian River Lagoon as I had been elected to office in the Town of Sewall’s Point in 2008. During this trip it hit me that the algae started in the lake. Ed and I had traveled throughout the St Lucie River and C-44 canal, and when we got to Port Mayaca, at the lake, there it was….the fluorescent green algae.
Not being a scientist or biologist –it finally hit me “this is a fresh water bloom.” It blooms in the lake….not in the river that is more saline. But once the river is fresh from releases from the lake and canals, it can spread there too.
Hmmm?
The story of the blog continues into 2013, when I saw the SFWMD testing the water at S-80, St Lucie Locks and Dam, and to my surprise I could see the unmistakable flourescent green cyanobacteria that often becomes “toxic”going right though the gates! I found this unsettling. Obviously the SFWMD, the ACOE, DEP, the Florida Health Dept and other official entities were in full knowledge that these dangerous blooms were being sent down the river to the residents of Stuart, Florida. Here I was an elected official representing a peninsular community and I had no clue. I had never even heard of this. Something is weird here, I thought. There is no warning to local governments. There is no press for the public. This is just everyday business….the everyday business of quietly poisoning Martin County’s citizens.
How could this be? I wondered…Maybe I am missing something? Maybe I am exaggerating?
Over time, I wrote other posts about this too.
I decided that this concept could be widely shared and understood, but we needed a good visual.
Well the ultimate visual is here…
Thank you to my husband, Dr Ed Lippisch for these photos and two short videos taken on Memorial Day, May 30, 2016 of tremendous blooms knowingly being sent through the open gates at S-80 towards the St Lucie River. We don’t have to wonder anymore.
In broad daylight, for all to see. State and Federal agencies….you’re busted.
*Thank you to the Stuart News, the River Warriors, Bullsugar.org and other river advocates for all of their work identifying and reporting the blooms especially in the lake and around Lake O this 2016.
Toxic Algae blooms (Microcystis/Cyanobacteria) :https://en.wikipedia.org/wiki/Microcystis_aeruginosa
I was on the Army Corp of Engineers Periodic Scientist Call this past Tuesday. These are excellent calls and one learns quickly the difficulties and the burdens of water management for our state and federal agencies in the state of Florida. I have participated in the calls as an elected official for the Town of Sewall’s Point since 2012.
This past Tuesday, something was said that struck me. Mark Perry, of Florida Oceanographic, reported something to the effect that over 600 acres of seagrasses inside the St Lucie Inlet are now “sand bottom.” Six hundred acres….
I went home and asked my husband that night at dinner…”Ed could it really be six-hundred acres? The seagrasses dead?”
“Easy.” He replied. “Just think of when I lived at the house at 22 South Sewall’s Point road when we first got married in 2005, and we’d walk out with the kayaks and there was lush seagrass all the way out ….well that’s gone–its gone all around the peninsula–you can see this from the air.”
Ed took some aerial photos the day after this conversation. Yesterday. I am including them today.
—-So it’s true, 600 acres of seagrasses are dead in one of the most bio-diverse estuaries in North America, the St Lucie River/Indian River Lagoon or southern IRL —for many years, as many of us know, confidently cited as not “one of,” but rather, “the most diverse…”
The Army Corp has been releasing from Lake Okeechobee this year since January 29th, 2016. We are only in June and there is more to come. Yes there is…there is “more to come” from us. There has to be. Because we are losing or have lost —everything.
Please compare the 1977 photo and then the 2012 map to photos taken yesterday. Please don’t give up the fight to bring back life to this estuary.
Aerial of seagrasses in 1977 in and around Sailfish and Sewall’s Point displaying rich seagrass beds. FOSSeagrass map of seagrasses in area from SFWMD/MC ca. 2012. JTL
All aerial photos taken by Ed Lippisch, 5-25-16. St Lucie Inlet area, the Crossroads and Sailfish Flats between and around Sailfish Point and Sewall’s Point in the confluence of the St Lucie River and Indian River Lagoon near the St Lucie Inlet. This area has been inundated by release from Lake Okeechobee and area canals for many years most recently particularly Lake O during 2013 and 2016.
The photos below of a severe algae bloom were shared yesterday by Rick Solvenson and Brenda Brooks who live on the Caloosahatchee River near Olga. This is on the south side of Caloosahatchee River near Fort Myers’ shores, just downstream of the Franklin lock. There is a second set of photos taken last Sunday and yesterday by Michael and Michelle Connor of Martin County along the side of Lake Okeechobee and at Port Mayaca.
So far in 2016, algae blooms have been reported in Lake Okeechobee, the St Lucie Canal, Palm City, (C-44) and the Caloosahatchee (C-43). The ACOE continues to discharge these algae filled waters from the lake into the estuaries St Lucie and Caloosahatchee with the support of the South Florida Water Management District, the Department of Environmental Protection, the Florida Department of Health, and the knowledge of the Governor and Florida State Legislature.
From what I have read to date, the cyanobacteria toxic algae blooms reported thus far have not yet tested “high enough” to warrant concerns at the level of the World Health Organization…not yet, but if they do, —-expect some information, but don’t expect protection. Florida is not providing such these days, not to us anyway.
Google mapsmapPhotos by Rick Solvenson, Caloosahatchee River 5-23-16.23456789101112
_____________________________
Map of Port Maraca and south side of Lake O in MC.Port Mayaca 5-23-16 (Mike Connor)Lake OLake O’s south side in Martin CountyClose upRedirection of water to the estuaries supports and protects the EAA south of the lake. (Map Everglades Foundation.)
Lake Okeechobee’s S-308 at Port Mayaca, Ed Lippisch, May 13, 2016.
The first time I ever laid eyes on Lake Okeechobee, I was eleven years old. I remember thinking that I must be looking at the ocean because I could not see across to the other side. Just enormous!
In spite of its magnificent size, over the past century, Lake Okeechobee has been made smaller–around thirty percent smaller– as its shallow waters have been modified for human use–pushed back, tilled, planted, diked, and controlled. Today, it is managed by the South Florida Water Management District and the Army Corp of Engineers. Sprawling sugar fields, the Everglades Agricultural Area, (EAA), canals, highways, telephone poles, train tracks, processing facilities, a FPL power plant, and small cites surround it.
S-308, (the “S” standing for “structure), opens easterly into the St Lucie Canal, also known as C-44, (Canal 44). About twenty miles east is another structure, S-80, at the St Lucie Locks and Dam. It is S-80 that is usually photographed with its “seven gates of hell,” the waters roaring towards the St Lucie River/Indian River Lagoon, and the City of Stuart, but it is actually S-308 that allows the waters of Lake Okeechobee “in” from the lake in the first place.
Such a fragile looking structure to be the welcome matt of so much destruction…a sliver unto an ocean. So strange…
Today I will share some aerial photos that my husband took on Friday, May 13th, 2016 at about 700 feet above the lake. I asked Ed if from that height he could see the algae bloom so much in the news last week even though over time blooms migrate, “bloom” and then sink into the water column, becoming less visible but still lurking.
“Yes.” He replied.
” It’s harder to see from that altitude, and it depends on the light, but it’s still visible. It’s green in the brown water. The lighting shows were it is. You can see a difference in texture about 100 yards west of S-308. It is not right up against the structure, but further out. Boats are driving through it leaving a trail. It’s appears that is slowly being sucked in to the opening of the S-308 structure , like when you pull the drain out of the sink….”
S-308 at Port Mayaca, Indiantown, Martin County. Ed Lippisch, 5-13-16Dike and rim canal around Lake Okeechobee near S-308. Ed Lippisch, 5-13-16…ELopening S-308 EL…Looking towards S-308 from Lake O, boat going through bloom. Ed Lippisch, 5-13-15Remnants of bloom seen bunched in waves. Ed Lippisch 5-13-16.…EL…EL……ELC-44 or St Lucie Canal that is connected by S-308 to Lake Okeechobee.ELCloser view of algae bloom in C-44 near Indiantown “downstream” of Port Maraca and S-308 headed to Stuart. (JTL 5-10-16)SFWMD SLR basin and canal map showing S-308 and S-80 along with other structures.Algae Bloom in Lake Okeechobee: This aerial was taken last week by Will Glover as he was flying over Lake Okeechobee in a commercial airplane. It was shared on Facebook.
TC Palm’s Tyler Treadway reported on 5-13-16: “The lake bloom was spread over 33 square miles near Pahokee, the South Florida Water Management District said Thursday. The Florida Department of Health reported Friday the bloom contains the toxin microcystin, but at a level less than half what the World Health Organization says can cause “adverse health impacts” from recreational exposure.”
Pahokee is south and west of Port Maraca and S-308. (Florida Trails)
Today, I was looking though my family library of photos and saw one from 2005, the year Ed and I got married.
“Boy we looked young,” I thought…”We have really changed…”
Then I noticed these SFWMD nutrient loading maps in the same file, as they were “published” in 2005 as well. These awesome maps were shared by SFWMD’s Boyd Gunsalus, such a helpful and smart person when it comes to water.
These SFWMD maps were very helpful to me when I was first learning about phosphorous and nitrogen loading by basins and Lake Okeechobee. The lake’s cumulative pollution is even higher than the different canals/basins. I would bet these numbers have not changed much. The state’s approach with BMAPS and TMDL’s is to be appreciated but just too slow.
Well, Ed and I have clearly aged and changed… but the maps–I bet if they made new ones for 2005-2016, the numbers would look about the same. I can’t say I’m envious. We are meant to change. To get better.
___________________________________________
Maybe a scientist will chime in and let me know???
Today I am writing to ask you please sign a petition that was put together by a young attorney I very much admire. He has been working hard for the St Lucie River/Indian River Lagoon. Please read below and sign if you wish. If you have never signed an electronic petition before, you can check it out.
P.S. Thank you to the young people holding the torch and shining the light on water issues and bringing the new technologies and opportunities to the movement.
“Explain how & confirm that Army Corps discharges into the St. Lucie & Caloosahatchee Rivers comply w/environmental laws.”
The discharges from Lake Okeechobee into the St. Lucie & Caloosahatchee Rivers by the US Army Corps of Engineers are a national environmental disaster; public safety hazard; threat to the health, livelihood, & well-being of many Floridians & Florida communities; deterrent to visitors from across the country; & are devastating to the complex ecosystems of the Indian River Lagoon, Jupiter Inlet, Pine Island, Sanibel Islands & others. Moreover, the discharges are appallingly indifferent towards stewardship of Florida’s most precious resource: its environment.
How are these discharges compliant w/environmental laws? What oversight actions have your Administration & EPA Administrator McCarthy taken to ensure that these waters are protected pursuant to law? What actions are presently underway?
________
“We the People” (https://petitions.whitehouse.gov) allows anyone to create and sign petitions asking the Obama Administration to take action on a range of issues. If a petition gets enough support, the administration will issue an official response.
Today I am sharing a “gallery” of discharge photographs from my husband Ed’s flight over Ft Pierce, Sebastian, and Stuart’s St Lucie Inlets. The photos were taken yesterday, March 6th, 2016, around 2pm.
A picture speaks a thousands words…(In this case through about 106 frames.) Yesterday was an absolutely beautiful day, yet area waters estuarine and ocean were not necessarily so. —-Certainly not those surrounding the St Lucie River/Indian River Lagoon near the St Lucie Inlet.
The discharge levels and reports for Lake Okeechobee can be reviewed at the Army Corp of Engineer’s Jacksonville website here: http://w3.saj.usace.army.mil/h2o/reports.htm. Lake Okeechobee is reported at 15.68.
The ACOE will be releasing less according to a recent press release.
Ft Pierce, Sebastian, and Stuart’s St Lucie Inlet, 3-6-16, Ed Lippisch
…..Dead pelican floating in discharge water, recent photo from Jupiter Island’s, photo credit: The Guardians.
These aerial photos were taken around 4PM by my husband, Ed Lippisch, this past Sunday, 2-21-16. They show the Lake Okeechobee/area canals’ plume moving south along Jupiter Island over nearshore reefs. There are photos of the exclusive neighborhood, Sailfish Point, at the mouth of the St Lucie Inlet as well.
High levels of Lake Okeechobee and canal discharge water (7000 cfs +/- at S-80) continue to decimate the seagrasses, oysters, fish, and bird life of the St Lucie River/Indian River Lagoon. Our reef communities and property values are also affected.
Unfortunately, even with unprecedented state and federal actions of the South Florida Water Management District and the Army Corp of Engineers to “move water south” from the Water Conservation Areas to Everglades National Park, there is presently no end in sight for the northern estuaries.
There has to be a better way. “Finishing the projects” is not enough….
Over the weekend at my niece Julia’s lacrosse game I ran into a former fellow commissioner, and long time Martin County resident, Dr Paul Schoppe.
“Hey Jacqui,” he said. “I was just thinking about you…”
“Oh really, ” I replied.
“Yes. I was thinking about you when I went down to my dock and saw a dead Snook floating in the foamy dark water….. What are we doing about this river…..?”
Yesterday, I received a call from a Sewall’s Point resident informing me of a phone call he got from a friend in real estate. The friend was photographing the water at his listing on the St Lucie River and forwarding the photos saying: “I hope the buyers don’t cancel when they see the water. They are doing their walk through today.”
At Publix, that evening, I ran into an old-timer of Stuart. He said to me: “Jacqui of course there have been releases from the lake for years…the difference now is that the water is so polluted….”
Water Conservation Areas as seen below the Everglades Agricultural Area. South Florida is compartmentalized to control water to “protect” farms and people ….this does always work.
We are in rain-year not seen before….
The state is overflowing…..
Our St Lucie River/Indian River Lagoon is again being destroyed by too much fresh, dirty, water….
Why is it so hard to send this water south?
It is “so hard to move water south” because the state of Florida has been compartmentalized to protect the Everglades Agricultural Area south of Lake Okeechobee and to keep-dry much of the lands that we live on. And now our waters are polluted…
Imagine, if you would, what would be going on here in South Florida now if modern man had never “conquered” it….Basically it would be a clean free-flowing marsh all the way from Shingle Creek in Orlando through Lake Okeechobee to the Everglades.
Well that it is no longer the case, is it? Since the 1920s, and more so since the 1940s, these lands have been drained, and diked, and altered, so that humans can grow food, and live here –inadvertently polluting the system. It is an imperfect situation and we must try to understand it, so we can make it better as we all need clean water.
1850s map of FloridaToday’s flow into SLR and Caloosahatchee from Lake Okeechobee used to flow south.
So for the everyday person trying to figure out “what is going on” right now, let’s take a look at “today:”
It has been raining lot. Since the end of January, the St Lucie River/Indian River Lagoon and Caloosahatchee are being destroyed once again as the state of Florida and the U.S. Army Corp of Engineers dump incoming waters out of Lake Okeechobee so that the Everglades Agricultural Area south of the lake and surrounding communities are not flooded. Drainage and property in our area is part of this too.
A rare situation occurred this past week where Florida’s governor, Rick Scott, issued an order to release water south through a canal into the Everglades. He had to confer with the US ACOE to do this. (Due to poor water quality and safety, just “sending water south” is not allowed. But now with so much water, it is an emergency.)
The Water Conservation Areas south of the EAA, —these gigantic areas (see bottom slide) that are considered part of the Everglades and full of wildlife and in some places sacred Native American tree islands, are so full of water that they have to be dumped first. If they are lowered, then more water can enter from the Everglades Agricultural Area and hopefully Lake Okeechobee itself. Then, and only then, would there be less dumping into the St Lucie River/IRL and Caloosahatchee. We have a long way to go and its not even “rainy season.”
I commend all those working hard to alleviate the overflowing system and I encourage investment in working to improve this relic as well as investment in the children who must be part of the goal to re-plumb this system. Dr Gary Goforth shows us how it is working right now as I asked for a simple explanation to share with the River Kidz.
Gary Goforths’ image to explain “water going south.”
“Jacqui—
Due to increased stormwater pumping from the EAA and surrounding areas and direct rainfall, the water levels in the WCAs are too high. Last week the Gov. sent a letter to the Corps requesting authorization to raise water levels in the Tamiami Canal allowing increased flows into the Park through Northeast Shark River Slough. Yesterday the District began making those increased discharges through structure S-333. Whether or not the District will send additional Lake water south is yet to be seen – lowering the stage in the WCAs should help. See the map above. (from page 2 of the attached).”
FOR IMMEDIATE RELEASE
February 11, 2016
CONTACT: GOVERNOR’S PRESS OFFICE
(850) 717-9282
media@eog.myflorida.com
DEP and FWC Issue Orders to Allow Army Corps of Engineers to Ease Effects of Flooding
TALLAHASSEE, Fla. – Today, the Florida Department of Environmental Protection (DEP) and the Florida Fish and Wildlife Conservation Commission (FWC) issued orders that will allow the U.S. Army Corps to move more water south through Shark River Slough to ease the effects of flooding in South Florida. Click HERE (http://www.flgov.com/wp-content/uploads/pdfs/FFWCC.pdf)
to see the orders.
Earlier today, Governor Scott sent a letter to the U.S. Army Corps of Engineers to take immediate action to relieve the flooding of the Everglades Water Conservation Areas and the releases of water from Lake Okeechobee to the Caloosahatchee and St. Lucie Estuaries. To read the letter, click HERE (http://www.flgov.com/wp-content/uploads/2016/02/2.11.161.pdf).
Chart by Dr Gary Goforth accompanying his letter comparing pollutants into SLR/IRL from Lake O and C-44 basin area 1980-2015For many years Dr Gary Goforth led STA projects for the SFWMD. He is now independent.
“Death by the numbers”…
Simply click on the image above to view 1980-2015. Numbers showing Lake Okeechobee and C-44 Basin flow rates and pollutants into the St Lucie River/Indian River Lagoon as presented by Dr Gary Goforth in his letter to Martin County dated February 9th, 2016.
This letter indeed helped the Martin County Commission decide to call a State of Emergency and perhaps Senator Joe Negron shared it with the Governor as well, inspiring the Governors’ call to the Asst. Secretary of the Army Corp of Engineers to “stop the discharges.” Great requests.
It would probably be easier for the ACOE to achieve such with some significant land south of the lake…..
Hmmmmm?
Anyway—-
The state knows it. The federal government knows it. We all know it. The St Lucie River/Indian River Lagoon have been sacrificed —–not for the common good, but for the interests of agriculture and development.
It is “death by the numbers” and it should stop.
Excerpt from Dr Gary Goforth letter to Martin County, 2-9-16.:
1. The intentional destructive Lake releases knowingly cause environmental and economic damage to the region; the State of Florida and US government intentionally cause these by sacrificing our region in order to protect the area south of the Lake, and should therefore, the Lake releases should be considered Emergency Operations. The BOCC should declare a State of Emergency and ask the State/feds to do the same. This may free up funds to help the region’s businesses and residents that will suffer losses as a result of the discharges.
2. In addition to water, the Lake releases carry significant amount of pollution and sediment/muck – the amount of nitrogen from the Lake over the next few months will likely dwarf the amount coming from septic tanks, and greatly exceed the TMDLs for nitrogen and phosphorus.
3. We can’t forget that the River & Estuary also receive local basin runoff in addition to Lake releases, so the Lake releases are destructive above and beyond impacts from local runoff. The “local” watershed is more than twice the natural drainage due to addition of C-23, C-24, C-25 and C-44 Canals.
4. The BOCC should ask the State and Corps to stop the releases immediately. They should ask that inflows to the Lake be reduced, that the Kissimmee Chain of Lakes be operated per their regulation schedules and NOT FOR USFWS purposes, that Holey Land and Rotenberger be used to the maximum safe depth (temporarily exceeding their 0-1 ft operating schedules), that the STAs receive as much Lake water as possible – based on hydraulic not water quality criteria, allow the WCAs to temporarily be operated above the regulation schedules up to maximum safe depths to allow Lake inflows, and that the District temporarily put water on as many public lands (e.g., a portion of DuPuis) as dispersed water management.
SLR/IRL St Lucie Inlet 2-7-16 by Ed Lippisch.SFWMD canal and basin map. C-44’s S-80 is the canal most southerly in the image.SFWMD 1955-2015 history of discharges at S-80.
The idiomatic expression “death by a thousand cuts” has been used by many people in many situations…but the St Lucie River/Indian River Lagoon is the expression’s poster child…
Idiom: Death of a thousand cuts Idiom Definitions for ‘Death of a thousand cuts’
“If something is suffering the death of a thousand cuts, or death by a thousand cuts, lots of bad things are happening, none of which are fatal in themselves, but which add up to a slow and painful demise.”
The St Lucie River/Indian River Lagoon has been dying, has been “being killed” by our local, state, and federal governments since before I was born. Since the 1940s when the 1915 “slice” between Lake Okeechobee and the South Fork of the St Lucie River was deepened, widened and made permanent by the ACOE as requested by a state protecting agriculture and development interests.
Does this make it “right?” —That it has been happening for so long? Does this mean we should have nothing to say about the present very high level discharges killing our estuary? Absolutely not.
As in most instances righting cultural wrongs takes time. It takes many years of pain and realization. And then it takes people rising up for change.—- It takes bravery, determination, and exposure.
For instance, it wasn’t until the first TV stations in the 1960s showed black Americans displaying non-violence in the face of attack dogs and beatings; it wasn’t until a few brave women spoke out publicly and were arrested as displayed in the first newspapers of the day that these hundred year old issues began to change.
…….……
For Florida, we are that new issue. Our river is that “new issue.” Without the advent of social media and Go Pros allowing a pilot, like my husband Ed, to attach a camera to his plane and share formerly unseen images with the world, the cuts of Lake Okeechobee and area canal discharges at S-80 would happen again and again and again. But since 2013 images have been shared, social media has ripped through the hearts of people who want something different. Not just here but on the west coast and all across our state. The River Warriors, the Rivers Coalition and thousands of others have stood up. We are primed to do this again but even more effectively. Film it. Share it. Expose it.
The SFWMD chart below, found by my brother Todd, shows the Lake Okeechobee and C-44 area canal releases from Structure-80 displayed from 1955-2015. Dr Gary Goforth has shown us in a blog I wrote in 2013 that in the 1920s the release levels were even higher. We can see the destructive releases have happened many times at horrific levels. They are going down. Now they must stop.
These red lines are the historic destruction that is driving our actions today. Each line a new cut causing a weaker estuary. ——-We are the chosen generation to change this. We are the chosen generation to save the St Lucie River/Indian River Lagoon.
Yesterday, after the vocal encouragement of the River Warriors and others our Martin County Commission unanimously voted to send a resolution to Governor Scott asking for a “State of Emergency.”
In my opinion, this means that not some, but every commissioner must support the purchase of land south of Lake Okeechobee. Because the propaganda of “finishing the projects” as the answer— just isn’t going to cut it.
River Warriors protesting before the MCBOCC 7-9-16. Photo JTL.SFWMD 1955-2015 discharges at S-80.With SFWMD info on bottom of slide.Plume, Ed Lippisch 2-7-16.SL Inlet, 2-7-16, Ed Lippisch.Plume, Sailfish Flats discharges, photo 2-7-16 Ed Lippisch 2016.
View of convergence of SLR/IRL between Sailfish Point and Jupiter Island. Plume from Lake O discharges flowing out into ocean. Photo 2-7-16, Ed LippischCanals in Stuart, C-23, C-24, C-25 built in the 50s and 60s. C-44 connected to Lake Okeechobee constructed in the 1920/expanded in 1940s. The natural basins of the SLR have been tremendously enlarged plus Lake O water. This is killing the SLR/IRL. More water must go south.
It is important to know how to “speak the language” of the ACOE and SFWMD.
The St Lucie River/Indian River Lagoon is once again under siege. The Army Corp of Engineers and the South Florida Water Management District are doing the will of the reigning powers and discharging tremendous amounts of water and pollutants from Lake Okeechobee and altered surrounding lands (basins) into the St Lucie River/Indian River Lagoon.
We must learn how to interpret this destruction and how to use their language of “cubic feet per second,” (cfs), when talking about discharge amounts from Lake Okeechobee and area canals into the SLR/IRL.
I am not good at this interpretation, but someone I know is….
As in most families, each chid in my family was born with different talents. My brother, Todd Thurlow, got all the number and sharp analytical skills that I did not. I am very thankful to him for helping with my St Lucie/Indian River Lagoon educational efforts.
Todd has created a VERY EASY way to convert cubic feet per second (the language of the ACOE/SFWMD discharges) into gallons. All you have to do is click on this link below and put in the numbers. Seriously.
For instance if you click on the link today, it will show that S-80 is last reported to be releasing approximately 6800 (cfs) cubic per second, down from just under 7600. Just enter 6800 in the top box and it will be converted to 1. gallons per second; 2. gallons per day; and 3. “olympic size swimming pools” (in honor of Stuart News reporter Tyler Treadway’s common example for communicating with the public.)
Go to this link now, and try it! You will be amazed at how east this is. To win this war, we must be able to speak “their” language and to understand.
Click on chart below to get started. Save the link to have it handy for this year. It is going to be a difficult one and we are going to need to know what we are talking about in order to negotiate and to communicate.
An “S” structure south of Lake Okeechobee as seen on flight to Clewiston passing Bell Glade. (Photo JTL, pilot Shawn Engebretsen 2014).S-2 Image SFWMD image showing piled up vegetation against structure.SFWMD map. Notice the S-2 structure south of the lake, near Bell Glade. The SFWMD oversees the S-structures south of the lake. The ACOE oversees the structures going into the SLR and Caloosahatchee.Wider view of SFWMD map.S-80 releasing at StLucie Lock and Dam.
After much controversy, today the South Florida Water Management District has halted its recent “backpumping.”
“Backpumping” —kind of an odd word isn’t it? What does it mean? And why in spite of multiple law suits, some changes, appeals, and “back and forths” on what is allowed is it still going on?
Basically, in reference to Lake Okeechobee, backpumping means that water that would normally be flowing south is pumped north—Pumped back into Lake Okeechobee to keep it out of the Everglades Agricultural Area (EAA).(https://nicholas.duke.edu/wetland/eaa.htm)
The satellite/GIS image below gives one an idea. This image is from 2005, also a rainy year. Through this satellite image shared by the Captiva Conservation Organization one can see how the EAA remained dry(er) and yet southern and central parts of the state are wet. This is basically what the EAA is trying to achieve now.
My explanation and example is certainly oversimplified but gives an idea to those who may not quite understand all the controversy surrounding backpumping.
Let’s continue…
Many do know that when Lake Okeechobee is “too high” the ACOE and SFWMD work together to dump the water into the St Lucie River/Indian River Lagoon and the Caloosahatchee estuaries usually with devastating effects. Thus locals are protesting again.
….Satellite/GIS image 2004 /2005. Blue is water.
So why does the ACOE and SFWMD dump?
People, property, and farmlands are south of the lake. In 1926 and 1928 there were horrific hurricanes that killed thousands of people and destroyed property. We live in fear of this happening again, and oh yes, we need those sugar fields dry…don’t we?
So what is the answer for not destroying the estuaries and not flooding Bell Glade and other communities south of Lake Okeechobee?
That is for the experts to work on, and the “we, the people” to encourage….
One thing is for sure, there has to be a better way. We must have vision.
The Belle Glade Everglades experiment station after the hurricane of 1928. Palm Beach Post file photo BELLE GLADE — An undated photo taken in the aftermath of the 1928 hurricane shows the damage done to a cluster of scientific work stations. Thousands drowned on Sept. 16 that year when hurricane-force winds blew a wall of water from Lake Okeechobee through a makeshift dike. The official death toll is 1,836, but historians and hurricane researchers say it’s probably closer to 2,500 or 3,000. Palm Beach Post online.
Please note this correction to this blog post from Mark Perry. My post originally read under the first and second photos: “An “S” structure south of Lake Okeechobee as seen on flight to Clewiston passing Bell Glade. (Photo JTL, pilot Shawn Engebretsen 2014). These structures can pump forward (downhill) into the EAA to water fields or backwards (up hill) into Lake O when there is “too much” water.”–These pumps can work in both directions.”
Mark Perry, Florida Oceanographic, kindly corrected my mistake and I am thankful for the correction. We all learn from each other as we try to understand things. Thank you Mark!
“Hi Jacqui,
Thanks for you post of “Backpumping 101” but I need to offer a correction.
Below your aerial photo of the S2 pump station you stated that “These pumps can work in both directions”. This is incorrect as the S2 and S3 pumps only go in ONE DIRECTION, from the EAA canals INTO the Lake. The gate structures next to the pumps (S-351 & S-354) can flow both ways depending on which side has higher water elevation. (See Attached Photo- Note Blue Arrows for flow). As of yesterday, 1-31-16, the Lake was at 16.16 feet and the canals were at 11.11 feet (at S-354see below) so if the gates were opened, the water would flow from the Lake into the canals that is why they are keeping them closed. You can see the pump flows in cfs for S3 (745) and S2 (856) as of yesterday.
Hope this helps to make it clear. Backpumping in not good for the Lake or eventually the Estuaries where the water will go.
Call me if you want to discuss this.
Thanks for your posts.
Mark
Mark D. Perry
Executive Director
Florida Oceanographic Society
890 NE Ocean Blvd.
Stuart, Florida 34996
772-225-0505 x103
772-486-3858 (Cell)
772-225-4725 (Fax) http://www.FloridaOcean.org
Florida Oceanographic’s mission is to inspire environmental stewardship of Florida’s coastal ecosystems through education and research.
Please consider the environment before printing this e-mail. Reduce, Reuse & Recycle”
S-153 drains this area.S-153 drains into the C-44 canal and then the St Lucie RiverSFWMD canal and basin map. C-44 canal is the canal most southerly in the image. See S-153 northeast of the C-44 “basin” area.
Water, water everywhere….
The ACOE and South Florida Water Management District are scrambling….they will have to start dumping from the lake and the local basin runoff is exceeding targets ….But is all the runoff into the C-44 really from a local basin? No it’s not.
Let’s drill down a bit.
The ACOE’s recent press release reads:
“FOR IMMEDIATE RELEASE
Corps to increase flows from Lake Okeechobee
The U.S. Army Corps of Engineers Jacksonville District intends to release
more water from Lake Okeechobee starting this weekend as it continues to
manage the lake level in the midst of El Nino conditions.
Starting Friday (Jan. 29), the new target flow for the Caloosahatchee
Estuary will average 2,800 cubic feet per second (cfs) over seven days as
measured at W.P. Franklin Lock (S-79) near Fort Myers. The new target flow
for the St. Lucie Estuary is a seven-day average of 1,170 cfs as measured at
St. Lucie Lock (S-80) near Stuart. However, runoff from rain in the Caloosahatchee or the St. Lucie basins could occasionally result in flows
that exceed targets as the water passes through the spillway gates at the
Franklin or St. Lucie structures…”
What we have to remember is that the “basin,” the lands that water runs off of into the St Lucie River has been altered by agriculture and development ….so to call “all the water” going into the St Lucie its own basin water is really misleading and not respectful of history….
Let’s look at S-153 for instance, a spillway that is presently dumping approximately 1.2 billion gallons into the C-44 which then goes into the St Lucie River. If man had not altered this area, much of this water would naturally be flowing back into the lake…so again we really should not refer to it as “basin runoff” that belongs to the St Lucie River. Today large portions of this area are agriculture fields and an FPL energy plant so the run off water of this area has been redirected from the lake to us.
S-308 drain LO; S-153 drain area around FPL plant.
Hmmm?
Let’s reflect for a moment on this information from my brother Todd:
“Jacqui,
According to my C-44 page the gates at the locks are up 2ft and dumping 4451cfs which equals 2.8 billion gallons per day.
Nothing is coming from the lake so they will say that this is all local runoff because S-308 at Port Mayaca is at 0? That S-153 spillway is dumping 1.2 billion into C-44. It seems to pull water west of Indiantown that would have otherwise gone into the lake not to the St. Lucie?
Todd of course is right. And 1.2 billion gallons of extra fertilized, dirty water is worth noting. Don’t you think? The least they could do is filter it!
Todd and I will look into this further with historic maps of the old creek and ridge system prior to development and how the water historically flowed prior to S-153 flows, etc—– but for now, let’s not entirely be sold “up the creek,” by believing the all this water is “local” basin runoff.
Because it’s not. 🙂
Other basin changes are also bringing excess water into the river right now. This map shows general drainage changes to the SLR. Green is the original watershed. Yellow and pink have been added since ca.1920. (St Lucie River Initiative’s Report to Congress 1994.)
There are only a handful of people who are qualified to help us navigate the turbulent and murky waters of Lake Okeechobee and its effects on our beloved St Lucie River/Indian River Lagoon….
One of these rare individuals is Dr Gary Goforth. “Gary” has more than 30 years of experience in water resources engineering, encompassing strategic planning, design, permitting, construction, operation and program management.
For the last 25 years, his focus has been on large-scale environmental restoration programs in the Kissimmee-Okeechobee-Everglades ecosystem. He was the Chief Consulting Engineer during the design, construction and operation of the $700 million Everglades Construction Project, containing over 41,000 acres of constructed wetlands.
With all this experience Gary spends a tremendous amount of time at River Coalition and SFWMD meetings, and with every day people, advocating to local, state, and national officials telling the story in a manner that the average person can understand but with the power and expertise of a scientist.
Dr Goforth teaches us that we CAN HOLD THE ACOE, AND ESPECIALLY THE SOUTH FLORIDA WATER MANAGEMENT DISTRICT ACCOUNTABLE.
We can ask such questions as “are you sending the maximum practicable amount of water south?” “Is it 28% more than in 1994 as required by the Everglades Forever Act?” ” Is an average per year of 250,000 acre feet going south from the lake to the Everglades as required by the Everglades Forever Act?” “Are the Storm Water Treatment Areas being used to full capacity?” “Is the truth of the destruction of the estuaries being reported?” “Should 2008 LORS, Lake Okeechobee Regulation Schedule, been revised?” “Should the Everglades Settlement’s Q-Bell (limit of Phosphorus) be reviewed-is it realistic?” “Is a large reservoir being created in the Everglades Agricultural Area as is called for in the Central Everglades Restoration Plan?” “Who are the Lake and the STAs really serving?”
In order to hold the agencies accountable we must be educated! We must ask questions. We must look at the figures for water flowing south of the lake every year and compare.
Dr Goforth provides regular public updates on these issues, directly and indirectly holding the fire to the agencies. Today I am publishing in full his DRAFT–WET SEASON 2015 LAKE DISCHARGE report.
Please read it, study it, familiarize yourself with it. Dr Goforth has a website if you have any questions. Thank you Dr Goforth for the gift of shared knowledge. It is the greatest gift of all.
Draft – Wet Season 2015 Lake Discharges by Dr Gary Goforth:
Goforth – December 18, 2015
Flows into and out of Lake Okeechobee were examined for the period May 1, 2015 – October 31, 2015, corresponding to the first half of the annual water year (May 2015 to April 2016), and roughly corresponding to the south Florida wet season. The flows and associated Lake water levels were compared to same period from last year. In light of the influence of the current strong El Nino, Lake water levels were compared to the levels that occurred during May- November 1997 which preceded over 1 million acre feet (347 billion gallons) of destructive Lake releases to the St. Lucie Estuary between December 1997 and May 1998.
Flows into Lake Okeechobee – excluding rainfall. For the period May 1 to October 31, 2015, surface inflows to Lake Okeechobee amounted to 1.43 million acre feet (466 billion gallons) (Table 1). This is 20 percent less than for the same period in 2014 (Table 2 and Figure 1).
Flows out of Lake Okeechobee – excluding evapotranspiration. For the period May 1 to October 31, 2015, surface outflows from Lake Okeechobee amounted to 780,000 acre feet (254 billion gallons) (Table 3). This is 37 percent more than for the same period in 2014 (Table 4 and Figure 2). Approximately 30 percent more Lake water was sent to the EAA and L-8 Canals during 2015 than 2014, likely in response to higher water supply demands (due to lower rainfall than in 2014).
Lake Okeechobee water levels. The level of Lake Okeechobee varied from 13.81 ft on May 1 to 14.55 ft on October 31, 2015, reaching a low level of 11.96 ft on July 16 (Figure 3). For 2014, the level of Lake Okeechobee varied from 13.07 ft on May 1 to 15.85 ft on October 31, reaching a low level of 12.32 ft on June 11. Lake water levels rose only 0.74 feet during the 2015 wet season compared with a rise of 2.78 ft during the same period in 2014. The Lake level on October 31, 2015 was approximately 1.3 ft lower than it was a year earlier, and approximately 0.5 ft lower than October 31, 1997 (Figure 4). In addition, the Lake level on November 30, 2015 was approximately 1 ft lower than it was on November 30, 1997, which preceded over 1 million acre feet (347 billion gallons) of destructive Lake releases to the St. Lucie Estuary between December 1997 and May 1998. Two important differences between 1997 and today that could influence Lake discharges to the estuary include rainfall over the Lake Okeechobee watershed and the regulation schedules governing Lake operations. According to the South Florida Water Management District (District), November 2015 was the wettest November since 1998, indicating inflows to the Lake over the next month may be substantially larger than average. Additionally, the Lake is currently operated under the LORS2008 schedule which was anticipated to result in increased frequency and magnitude of Lake releases to the estuaries compared to the regulation schedule in place during 1997-1998.
Lake flows to the STAs. Beginning in August 2015, the District began operating the EAA A-1 Flow Equalization Basin (FEB), which is approximately 15,000 acres in size and can store water up to 4 feet deep. The FEB can receive Lake releases and EAA runoff, and distribute flows either to STA-2, STA-3/4 or to the EAA for irrigation. At this time incomplete flow records are available to the public through the District’s DBHYDRO database to fully account for the various flow paths, and until additional data are available, the estimates of Lake releases and runoff to STA-2 and STA-3/4 will be subject to revision. Using these preliminary estimates, approximately 13 percent less Lake water has been sent to the STAs in 2015 compared with 2014 (Figures 5 and 6 and Table 5). During the same period, approximately 32 percent less basin runoff was sent to the STAs, reflecting less wet season rainfall in 2015.
Flows to the estuaries. Lower rainfall in 2015 resulted in less basin runoff to the estuaries for the period May to October than occurred in 2014 (Table 6). However, due to the Lake releases that occurred during January through May 2015, Lake discharges to the estuaries in 2015 far exceeded Lake releases during 2014.
SUMMARY. Lower rainfall during the May to October 2015 period resulted in about 20 percent less inflows to Lake Okeechobee than in 2014. However, outflows from the Lake increased compared to 2014, likely in response to higher water supply demands (due to lower rainfall than in 2014). Lake water levels rose only 0.74 feet during the 2015 wet season compared with a rise of 2.78 ft during the same period in 2014. The Lake level at the end of October 2015 was about 1.3 ft lower than in 2014. In addition, the Lake level on November 30, 2015 was approximately 1 ft lower than it was on the same date on November 30, 1997, which preceded over 1 million acre feet (347 billion gallons) of destructive Lake releases to the St. Lucie Estuary between December 1997 and May 1998. However, differences in rainfall and Lake regulation schedules prevent a forecast of potential 2016 Lake discharges compared to the 1997-1998 discharges to the estuaries based on Lake levels at the end of November.
Dredge and fill, public photo, 2015.A multi-image of the area in the 1887 NOAA map, the 1925 shot (partially), 1940, a 1958 NOAA map, 1970 and today by Todd Thurlow.
Today’s blog is a full expansion of the 1925 aerial photo I wrote about last Friday.
My brother Todd took this photo creating a time line flight of 1925 and 1940 views of the Sailfish Flats, the Indian and St. Lucie Rivers, and the St. Lucie Canal (C-44).
Todd’s video is a history lesson in “dredge and fill” which was very common throughout all south Florida and the United States until national laws in the 1970s required more scrutiny and often no longer allow such due to heavy impacts and damages on waterways and the natural environment.
Our Martin and St Lucie County canals dug by the ACOE and water management entities C-44, C-23, C-24, C-25 are dredge and fill. Sailfish Point, Sewall’s Point, and Indian River Plantation, just to name a few, have large portions that are dredge and fill. The dike around Lake Okeechobee and the work abound the FPL plant in Indiantown by Barley Barber Swamp are dredge and fill. At the time, it was “how it was done.” People did not foresee the ramifications to the environment or to people living in these areas in the future.
The land was our Play Doh…
1925 aerial by Bob Higgins shared by Sandra H. Thurlow. SLR/IRL
I know you will learn a lot and enjoy watching Todd’s video. The link is above.
—My questions to Todd after I saw the video included:
Jacqui: “So Todd, what are the white lines on the edge of Stuart, Rocky Point etc…more piled white sand? Looks like Jupiter Island was smaller at one point…across from Sailfish…
So how in the world did they dig out the Sailfish Point Marina and what about the straight marina of Sailfish Point that was already there from the days of Mr Rand? Also what about the FPL Pond in Indiantown? Where do you think they put that fill? Holy cow! That’s a lot of fill!
(I have adapted Todd’s words after checking concepts with him so I could present info in a simple manner.)
Todd: “The lines on the edge of Rocky Point were probably a beachy shoreline. With it being more open water at the time and more exposed to the inlet; I’m sure there was more of a beach there. That shoreline matches perfectly the shoreline shown on the early NOAA maps – even before the inlet was there.
With respect to Jupiter Island, you are probably referring to all the spoil that was piled up at the entrance to the Great Pocket – some of that was put there when I was in middle school. The main part of Jupiter Island is more to the east and is now gone – and earlier connected to Hutchinson Island. The old Gilbert’s Bar Inlet was south of that point.
The marina on Sailfish Point was dredge fill. We have some aerials of it in the making. As was the case in areas of Sewall’s Point, the sand dug to build small marinas or subdivisions was piled on the land (Archipelago, Isle Addition) to make the land higher or to create completely new lands.
As far as the giant FPL pond, they probably just dug with a dragline and used the fill to make the dike around the outside of the pond and also to build up the land around FPL.”
Hmmm?
So we live in an environment altered by our forefathers, and now we are experiencing unintended consequences to the health of our St Lucie River/Indian River Lagoon. We must assist the next generation in understanding the past so that we and they can create a better water future. And that we can!
C-44 canal with Coca Cola’s Minute Maid Orange Groves, 1964. Photo Arthur Ruhnke courtesy of historian Sandra Henderson Thurlow.SFWMD including C-44 R/STA in blue, 2014. This area was once Minute Maid’s orange groves.
The C-44 Reservoir and Storm Water Treatment Area has been in the news over the past few years. Once completed by the SFWMD and ACOE with help funds raised locally, it will clean water from the tremendous and polluting C-44 basin. It is one component of the Indian River Lagoon South Project that is part of the Central Everglades Restoration Plan. But what was all that land used for in the past? That land was orange groves. Thousands and thousands of acres of orange groves! As far as the eye could see….
Today even with the area’s transformation to STA/Reservoir, “Coca Cola” and “Minute Maid” roads remain as reminders of an all too distant past…when oranges were healthy and the St Lucie River/Indian River Lagoon was not impaired.
Today I will share eleven incredible 1964 aerial Ruhnke aerials my mother stumbled upon while creating a presentation for the Martin County Property Appraiser’s office. Arthur Ruhnke photographs are so important to our understanding of our history and I thank my mother for sharing these treasures. Art was a well-known photographer in his day and my parents acquired many of his photos.
The following is an exchange with my mother, Sandy, and long time family friend Jack Norris, who was an executive for Minute Maid. In the exchange, they “talk”about these photographs. Their interplay tells the story best, so I have gotten permission to share.
—-Jack, Tonight Fred asked me if I had any images to illustrate the his Citrus Program. These are from a packet of 10 Ruhnke negatives marked Minute Maid Groves, Indiantown, 1964. Surely the canal shown isn’t C-44? Are those workers’ houses? Sandy
—- Sandy”Hi Sandy – The barn, equipment storage & office are located in the NW corner of the intersection, the buildings in the SW and NE are workers houses, and the buildings in the SE corner are supervisors houses. The canal running N&S was the main source of irrigation, originating at the St. Lucie at the site of the rodeo bowl. It is now substantially enlarged by the SFWMD to carry water to the new reservoir. The NS canal and l the main drainage canal was owned and operated by the Troup – Indiantown Drainage District.” Jack
So then my mother sends this email to me:
—-Jacqui, I am working on my program for the Property Appraisers and thought I needed to say something about western Martin County. I thought I might show the old Minute Maid Grove and say it is now a reservoir. I couldn’t find my aerials. I have finally found them and thought I would share them with you. Understanding them would be an education. Jack Norris was in charge of planting all of those millions of citrus trees.
So I today I am sharing the photos and started researching Minute Maid and the land purchase for the C-44 STA/R; this is what I found: According to a 2011 Stuart News article bout C-44 R/STA by Jim Mayfield:
“The project site, 12,000 acres of former citrus land, was purchased in 2007 for $168 million, $27 million of which came from Martin County taxpayers through the one-cent sales tax for conservation lands, South Florida Water Management officials said. The property is south of the Allapattah Flats Wildlife Management Area near Indiantown. Over the last year, the water management district has spent roughly $5 million to remove trees and rid the topsoil of copper deposits, officials said.” Jim Mayfield
I hope you enjoy these historic photos today. I find these aerials amazing! It is my hope that one day even more of this agricultural land will be converted to hold water as Nature intended. The C-44 STA/Reservoir is a great start.
Orange Groves and C-44 canal. All photographs below taken in 1964 by Arthur Ruhnke and shared by historian Sandra Henderson Thurlow.…..….…….….….………
“Here is one of your pictures – here and now”
(Cool video with historic maps and Google Earth fly over by my brother Todd Thurlow: (https://youtu.be/i9h1d1pzfww)
___________________________________________________
This ACOE sponsored video gives an artists rendition of what the C-44 R/STA will achieve for water polluted by agricultural runoff once complete:video: (https://www.youtube.com/watch?v=4BsC0BoIPJ4)
“Isle Addition” far left. March 1966. Peninsula of Sewall’s Point with roads at High Point are also visible. Looking south at confluence of St Lucie River/Indian River Lagoon. (Photo Arthur Ruhnke via Sandra Henderson Thurlow’s book Sewall’s Point.)
Today I am going to share some aerial photographs that showcase development in Sewall’s Point during the 1960s, specifically, Isle Edition and Archipelago. To give reference, I was born in 1964. During this time and before, the bulkheading of spoil islands was fashionable. Due to environmental restrictions that were put into law in the 1970s, development on such a scale is no longer allowed.
Bulkheading is basically when one creates a seawall. In the case of a some of the islands off the Town of Sewall’s Point, they were cleared, bulkheaded, filled with sand, and then developed. In some instances the fill is high enough that these islands are not completely in same flood zones as surrounding areas.
According to my mother’s book, “Sewall’s Point, A History of a Peninsular Community on Florida’s Treasure Coast:”
“High Point’s “Isle Addition” was developed by Bessemer in 1966, during the same years Perry Boswell developed Archipelago. Both subdivisions are on bulkheaded islands that were augmented by dredge-and-fill operations. Since laws no longer allow this type of development, there will never be another one on Sewall’s Point.” -Sandra Henderson Thurlow
Looking north. This aerial photograph taken in 1960 shows the spoil islands which were to become Isle Addition and Archipelago. Archipelago is further north. (Dillion Reynolds Aerial Photography via Sandra Henderson Thurlow’s book Sewall’s Point.)
The islands I am referring to are spoil islands. They are not natural islands. These islands were created by the ACOE. The 156 mile long Indian River Lagoon has 137 spoil islands; they were formed from 1953 to 1961 when the U.S. Army Corps of Engineers dredged the Intracoastal Waterway — the main channel through the center of the lagoon. The Corps left behind heaps of sand on either side of the channel.
Archipelago first developed in 1964. Photo courtesy of Sandra Henderson Thurlow.
I am including this video my brother Todd created about the spoil islands from an earlier blog as it is most fascinating as is the coast history of our St Lucie River/Indian River Lagoon region. Enjoy!
Aerial photo of plume from C-44; C-23, C-24, Tidal Basin, and 10 Mile Creek, along Jupiter Island south of St Lucie Inlet. Photo taken at 1000-1500 feet on 10-10-15 through a green glass canopy. Jupiter Narrows, part of the Indian River Lagoon, is visible west of Atlantic Ocean. Photo Cam Collins/Pilot Ed Lippisch.
Today I will be sharing aerial photos of the recent plume along Jupiter Island south of the St Lucie Inlet, taken this past Saturday, October 10th at 9:34 am. These photos are courtesy of friend Mr. Cam Collins. My husband, Ed, took Cam up in an acrobatic plane, the Extra 300, a plane I have not flown in yet. Doing “Half-Cubans” and “Loops” over the Atlantic Ocean is not my favorite way to see the St Lucie River/Indian River Lagoon….
Typically I am sharing photographs taken in the Legend Cub, an open aircraft; most photos are taken at around 500 feet. Cam’s photos are taken at about 1000-1500 feet, thus there is a much broader perspective. The effect is powerful.
I was surprised to see the giant plume considering the major rain event from tropical activity occurred on September 17th, 2015, over three weeks ago. Out of curiosity, I went back and looked at the ACOE Periodic Scientists Call information to review what the release numbers from C-44, C-23, C-24, the Tidal Basin, and Ten Mile Creek have been. No Lake Okeechobee so far. This is what I found:
8-25-15/8-31-15 was reported at 1985 cfs (cubic feet per second)
9-8-15/ to 9-14-15 was reported at 2108 cfs
9-15-15/9-21-15 was reported at 5877 cfs (rain event)
9-22-15/9-28-15 was reported at 2311 cfs
9-29-15/10-5-15 was reported at 1418 cfs.
Cubic feet per second is very hard to understand. For reference, I can share that at the height of releases from Lake O during 2013, the cfs were between 5000 and 7000 cfs at S-80. (http://www.midtel.net/~dccinc/sample_graph.html)
SFWMD discharge chart via ACOE 10-6-15.
So I wonder how long it takes the discharge water to travel through the St Lucie River/Southern Indian River Lagoon and out of the St Lucie Inlet? September 17th’s rain event was three weeks ago? It seems that water would have passed through by now…..what water is the water in Cam’s photographs? Is October’s plume September’s water? If you have an idea, please write in.
——In any case, thank you Cam and thank you Ed. We will continue to document the discharges, Lake O or otherwise, that are killing our St Lucie River and Indian River Lagoon.
SFWMD canal and basin map. These canals have expanded the basin of the SLR/IRL 5 times or more its natural water flow. (Florida Oceanographic Society)Cam Collins, 10-10-15.2.3.4.5.6.
To get involved, advocate, and learn about St Lucie River/Indian River Lagoon issues please attend a Rivers Coalition meeting: (http://riverscoalition.org)
St Lucie Inlet, plume exiting SLR at Crossroads of SLR/IRL. 10-3-15. Photo Dr Scott Kuhns.
I am supposed to be on a blog break, but I did not want to miss the chance for Dr Scott Kuhns’ photos to be documented. Dr Kuhns has a much better camera than Ed or myself who use our iPhones. These photos were taken on Saturday, October 3, around 11:00am, 2015, with a Nikon D750.
So far this year, the St Lucie River/Indian River Lagoon has avoided the releases from Lake Okeechobee, and we were fortune that Hurricane Joaquin did not hit Florida which certainly would have filled up that lake. Nevertheless, we have been getting the discharges from regional canals C-23, C-24, C-44 and C-25 up in Ft Pierce.
While this fresh water is running off Martin, St Lucie, Okeechobee, and Indian River County, and being dumped to tide through our ailing rivers, Lake Okeechobee is filling up from the Kissimmee and other tributaries.
10-3-15 plume rounds Jupiter Island south of St Lucie Inlet, Hutchinson Island over near shore reefs. Sailfish Point on right. (Kuhns)10-3-15 —-(Kuhns)10-3-15 over Sailfish Point. (Kuhns)SFWMD discharge chart from ACOE Per. Scientist Call 10-29-15SFWMD basin/canal map, 10-29-15.SFWMD salinity chart SLR Roosevelt Bridge.10-29-15.Thie big picture… image courtesy of the EF.
Lake Okeechobee’s level today is at 14.77 NGVD. (http://w3.saj.usace.army.mil/h2o/currentLL.shtml) Hurricane Season officially ends November 30th….When the lake gets over approximately 15.5 feet there is a high chance its waters will be directed through C-44’s S-308 and S-80 to the St Lucie River/IRL by the SFWMD and the ACOE.
Presently according to NOAA, there is an El Nino (complicated, but basically a wet “winter” predicted/fewer hurricanes in summer) so this 2016 winter and Florida-spring, during what is normally the “dry season,” it may be rainy.
We must keep an eye on Lake O’s level every day, all year-long. I would still like to get a bank in Stuart to sponsor a “Lake O. Level Screen,” next to the temperatures….like they do in Clewiston. Like Clewiston, the lake affects our lives and livelihoods along the St Lucie River/Indian River Lagoon on an everyday level—– whether we can “see” it or not.
Thank you Dr Scott Kuhns for the quality aerial photographs! Let’s keep documenting, learning, advocating, and affecting change.
What a wonderful world! Sunset on the St Lucie River, photo by Jenny Flaugh, 2009.
The words of Ernest F. Lyons, famed fisherman, environmentalist, and veteran editor of the Stuart News, can be used over, and over, and over again…
Lyons grew up in Stuart in the early 1900s and witnesses first hand the destruction of his beloved St Lucie River/Indian River Lagoon. In the 1940s and 50s, for “flood control” and EAA interests, he watched St Lucie Locks and Dam, C-44, and S-80 be “improved,” by the ACOE and SFWMD—-destroying fishing grounds that will never be replaced…He witnessed canals C-23, C-24 and C-25 be constructed to scar the land and pour poisonous sediment from orange groves and development into the North Fork and central estuary.
But even amongst this destruction, Lyons never stopped seeing the miracle of the world around him. And no where did life continue to be more miraculous than along his beloved river.
This week so far, I have written about things that bring light to the destruction of our rivers, I must not forget that in spite of this destruction, beauty and life still exist….To do our work as advocates for the St Lucie River/Indian River Lagoon we cannot become negative, we must be inspired….one of the best ways to achieve this is to recall the work and words of our forefathers….to “recycle inspiration.”
Although Ernie Lyon’s work was first read on the pages of the Stuart News, my mother historian Sandra Henderson Thurlow, has clipped old pages, been in touch with Ernie’s children, and transcribed many of Lyon’s columns as part of the work of Stuart Heritage. Stuart Heritage helps keeps our rich “river-heritage” alive. After all, our founding name was “Stuart on the St Lucie.”
……Ernest Lyons– copy of column, ca 1950.Copied from old Stuart News paper. Sandra H. Thurlow.
“What a Wonderful World”
I get an indescribable “lift” from the habit of appreciating life.
All of us, even the most harried, have moments when we are fleetingly aware of the glory that surrounds us. Like moles that occasionally break throughout their tunnels, we infrequently catch a glimpse of the natural beauty and awesome majesty outside the corridor within which we have bound ourselves.
And pop back into our holes!
The habit of appreciation—–the cultivation of the sense of awareness—are forgotten roads to enrichment of personal experience. Not money in the bank, or real estate, or houses, or the exercise of power are true riches. By the true tally, the only value is “how much do you enjoy life?”
All around each of us are the wonders of creation—the shining sun, a living star bathing us with the magic mystery of light…we look to the heavens at night and wonder at the glittering panoply of suns so distant and so strange, while accepting as commonplace our own.
We live in a world of indescribable wonder. Words cannot tell why beauty is beautiful, our senses must perceive what makes it so.
What we call art, literature, genuine poetry, and true religion are the products of awareness, seeing and feeling the magic which lies beyond the mole-tunnel view.
One man, in his mole-tunnel, says he is inconsequential, a slave to his job, of dust and to dust going. Another, poking his head our into the light, realizes that he is a miraculous as any engine, with eyes to see, a mind which to think, a spirit whose wings know no limitations.
The mole-man is bound to a commonplace earth and a commonplace life. He lives among God’s wonders without ever seeing them. But those who make a habit of appreciation find wonder in every moment, and every day, by the sense of participation in a miracle.
They see the glory of the flowers, the shapes and colors of trees and grass, the grace of tigers and serpents, the stories of selfishness or selflessness that are written on the faces men and women. They feel the wind upon their faces and the immeasurable majesty of distances in sky and sea.
And in those things there is the only true value. This a wonderful world. Take time to see it. You’re cheat yourself unless you appreciate it.—–E.L.
Ernest F. Lyons: (http://www.flpress.com/node/63)
St Lucie Inlet and Sailfish Point area after approximate 7-10 inches of regional rainfall in area 9-16-15. Photo taken on 9-23-15, Ed Lippisch.
“From 7 a.m. Wednesday to 7 a.m. Thursday, the heaviest rainfall was reported at the Savannas Preserve State Park in southeastern St. Lucie County, with 7.67 inches. Next highest in 24-hour rainfall, according to the Weather Service, was 6.87 inches at Hobe Sound.” —-from article y Elliot Jones, TCPalm, 9-17-15
SFWMD chart showing releases through canals recently. Note spike after recent rainfall.
Today I will share aerial photos of the St Lucie River/Indian River Lagoon taken by my husband, Ed, on 9-23-15. I asked Ed to document the after effects of the tremendous rainfall event in the region from September 16th through the 17th, 2015. After reviewing his photos, the St Lucie River/Indian River Lagoon has dark waters, this is evident, but first, let’s set some things straight….
We hear a lot about “local runoff,” however, it is becoming more and more understood, there is no such thing as “local runoff” for the St Lucie River/IRL…. The canals that dump into the St Lucie River/Indian River Lagoon are regional canals that have been “plumbed” over the past 100 years to drain and dump waters off the lands from as far away as western Martin County, Okeechobee County, and even what used to be the north flowing waters of the St Johns River in Indian River County! Then when things are really bad, since the water can’t flow south, “they” dump the overflow waters of Lake Okeechobee into the St Lucie River to boot.
The poor St Lucie River is inundated with “everyone’s water” not just “its own.”
Drainage changes to the SLR. Green is the original watershed. Yellow and pink have been added since ca.1920. (St Lucie River Initiative’s Report to Congress 1994.)SFWMD canal and basin map. The St Lucie’s natural basin as seen above in green has been very much enlarged by the C-44 canal built in the 1920s —with expanded basin and often Lake O overflow; also C-23, C-24 and C-25 were built ca. 1950 to drain lands in St Lucie County for orange groves/agricultural development and land development by General Development Corp and others.
It is critical that we study and understand what happens in our area after a huge rain, with or without the “extra-extra killing waters of Lake Okeechobee.” Why? Because maybe, just maybe, if the SFWMD, ACOE, as well as state and federal politicians will see how much the river is already suffering, they will do all they can, “not to kill it more.”
So here are Ed’s photos, taken one week after the rain event. It takes the water coming in through the canals some time to move through the St Lucie River; I imagine a lot had already exited the St Lucie Inlet. The 23rd was the soonest Ed could “get up in the air.”
I am thankful to my husband, as for me going up in that plane? It is really amazing to be flying, but also very stressful. Somehow to me it seems God only meant for birds to fly….
At least with the Cub, I feel like if something ever happened, over the ocean anyway…. we could just jump out!
2013 Ed Lippisch/Jacqui Thurlow-Lippisch.St Lucie Inlet at Sailfish Point. 9-23-15.Crossroads, Sewall’s Point and Sailfish Flats. 9-23-15.St Lucie Inlet 9-23-15.Water in Jupiter Narrows very close to St Lucie Inlet. 9-23-15.Unusual in that plume was flowing north and south. Here north at Sailfish Point at SL Inlet. 9-23-15.Northerly movement of plume. 9-23-15.Sailfish Flats of SLR/IRL confluence as seen from ocean over Hutchinson Island. 9-23-15.Heading back…9-23-15.On the way back to Witham Field. Sewall’s Point Crossroads 9-23-15.
 Today’s blog post is about western Martin County Florida’s Palm City. This post includes my mother’s inspiration, my brother Todd’s time capsule flight video, and my writing.
 -Below: A 1973 C&SFP update map, Army Corp of Engineers. Green never built thank God!