When Ed and I recently visited Flamingo and rented a boat to explore White Water Bay, my goal had been to find the Shark River. I never found it…
I had wanted to see this river because although there are many Everglades’ rivers, the Shark is the most associated with Shark River Slough. Even though this slough, this river of grass, has been amputated by the Everglades Agricultural Area, Tamiami Trail, and eastern coastal development, getting waters into Shark River Slough and the Shark River still translates and is actually improving: “Sending Water South.”
So we took a flight…
Ponce de Leon Bay, where much of this water exits, is particularly breathtaking to see. The geometric shapes, shades of green, brown, and blue create a giant puzzle. It makes me want to put all the pieces back tother again.
It was so wonderful to finally find the Shark River! I wanted you to see it too! The primary goal remains, to send more water south; this we must envision…
-Everglades Rivers flowing southwest out of Shark River Slough 1-21-21, photos JTL&EL-Ponce de Leon Bay where Shark River exits into Florida Bay–The Shark River is the primary river you see coming into this area of Ponce de Leon Bay. White Water Bay is to the right. It all kind of blends together.
Shark River, red dot follow northeast; 2. Shark River Slough, large most far right area above shark river -seemingly brownish green – running into Shark River 3. Water Water Bay appears as a dark green depression southeast of and connected to the Shark River; 4. Shark River exits at Ponce de Leon Bay into Florida Bay. Florida Bay is in dire need of more fresh water.
What should be normal, was a gift on Christmas Day, blue water in the St Lucie River/Indian River Lagoon. The peninsula of Sewall’s Point shone like the gem it is surrounded by aquamarine on both sides: the St Lucie River on its west, and the Indian River Lagoon on its east…
Feeling like the Bahamas, rather than the toxic-sludge we had to endure ~coming mostly from Lake Okeechobee this past summer, 2018, and yes, remember 2016, and 2013….the destruction must stop!
As 2019 edges into the picture, we will once again have to give everything we have to fight for clean water and encourage our state and federal government to support legislation “sending the water south.”
Seeing these beautiful blue waters once again is certainly encouraging. Now to keep the Army Corp and South Florida Water Management District at bay long enough, as projects proceed, and allow our precious seagrass beds to return so baby fish can once again hide, swim, and grow to maturity in these waters; once christened the “most bio-diverse in North America.”
Thank you to my dear husband, Ed, for these photos all taken 12-25-18. And from both of us, “Merry Christmas!”
Sewall’s Point lies between the St Lucie River and Indian River Lagoon
Sailfish Flats between Sewall’s and Sailfish Point. Seagrass remains bleak after years of discharges from Lake O, and other area canals
St Lucie Inlet opening to the Atlantic Ocean between Sailfish Point and the southern end of St Lucie Inlet State Park on Jupiter Island
Another angle of St Lucie Inlet area
Remnants of once lush sea grass beds off Sewall’s Point
Another angle: Evan’s Crary and Ernest Lyons Bridges on far right
A great shot of the now pathetic seagrass beds. This area was once considered “the most bio-diverse in North America,” with approximately 700 acres of healthy seagrasses in this area between Sewall’s and Sailfish Points
Photo below as a comparison ___________________________________________________________________________
NEVER FORGET! Town of Sewall’s Point, Martin County Florida, 9-2013 surrounded by polluted waters released from Lake Okeechobee. Even the ocean brown! Similar years were 2016 and 2018 both with cyanobacteria blooms along shorelines. This awful sediment, and nutrient filled water is dumped on us by our federal and state government and is a health hazard.
As you know, we are on a Road Trip. We are driving through not only to learn about the Glades, but also to learn about ourselves. Whether we realize it or not, we are all connected. We are related by history, by the drainage of the Everglades, and by a “better water future” we have no choice but to build together.
This map of the Glades is from the Florida Memory Project. It maps flood damage from two great hurricanes. Notice that the 1926 Hurricane damaged mostly the western part of the lake near Moore Haven, where as the 1928 Hurricane most intensely hit the eastern communities around Belle Glade. The towns/areas of Canal Point, Pahokee, Bacom Point, Belle Glade, South Bay, Lake Harbor, Bare Beach, Clewiston, Moore Haven and Newell all had to rebuild. “Chosen” near Belle Glade was chosen to be lost…
These past hurricanes define the history and the nature of some of the people of the Glades. The ones who “made-it” are survivors beyond anything we can possibly envision.
As Mr Lawrence E. Will an old family, a politician, and a prolific writer from the area wrote in HURRICANE:
“One word describes it. It was Hell. A raging inferno of rolling, swirling waters, of shrieking, demoniac winds, of lashing rain and of darkness, black and absolute. There were no atheists that night on the shores of Okeechobee! Then for the those still living came the second phase of hell; the phase of desolation and despair; of searching in the flooded woods and marshes, in elder clumps and sawgrass for the horrible remains of family and friends and neighbors; of loading them into trucks by unending scores; and finally of burning them in help of dozens when they could no longer be transported. It is hard to know which hell was worse…”
As we know in the 1930s the Herbert Hoover Dike was built to avoid such a disaster from happening again…but there is always the question of whether it will or not. It is dangerous to live on the low side of a dike.
As advocates of the St Luice River/Indian River Lagoon, we must be sensitive when discussing Senate President Joe Negron’s proposal for 60,000 acres to be purchased south of the lake to store, convey and move water south to the Everlgades. One can see how shouts of “Send the Water South” may send some people living south of the lake “over the edge…”
We must always make clear that when discussing Everglades resoration and improved health of the St Lucie River/Indin River Lagoon, safety, and economic prosperty for the Glades communties comes first. We know and respect their past…
“Chronology of Water Management Changes” map. Reconstructed pre-drainage landscapes, source, McVoyet al., 2011. Presentation of Robert Johnson, Director of South Florida Natural Resources Center at Everglades National Park,Everglades Coalition, 2015. (With words added: “Water Started Flowing South 2014, JTL”.)
After the horrendous “Lost Summer of 2013,” and public outcry, more water has been sent south to the Everglades by the Army Corp of Engineers and South Florida Water Management District in 2014/15 than in the past ten years. But we are still drowning…
Hanging over our heads is the fact that Lake Okeechobee is at 15.04 feet today, and chances are that to prepare the lake for a predicted El Nino rainy winter/spring, the ACOE is going to “have to” start releasing water soon. Although it’s being worked on right now, the system is not even close to being able to hold the ocean of overflow-lake water and “send it south….” plus we are handcuffed by 10 parts per billion phosphorus goals.(http://www.sfwmd.gov/portal/page/portal/xrepository/sfwmd_repository_pdf/derivation_wqbel_stas_toc_4-20-10.pdf)
With this in mind, the Everglades Coalition’s 30th Annual Conference (http://evergladescoalition.org) was a whirlwind; its theme “Send it South: Water for America’s Everglades.”
Let’s begin, by looking at some water/land maps and think about the big picture.
The image below is a “simplified chronology of water management changes,” and shows the canals and structures that waste water to the ocean destroying our precious estuaries. This map was shared by Robert Johnson during the coalition meeting. It made a big impression on me, because it gives historical perspective, is simple, and is clear.
Map again from above to review.
The red lines are canals that drain lake Okeechobee. We know them well: the Caloosahatchee (C-43); the Miami: the North New River: the Hillsboro: the West Palm Beach; and our own St Lucie (C-44). The grey shows the Herbert Hoover Dike built around Lake Okeechobee in the 1930s after the terrible hurricanes of the late 1920s; the Eastern Protective Levee is also in grey, on the far right, and basically is like a giant underground wall between the Everglades and eastern coastal development; the Everglades Agricultural Area Levee System, which I think is the grey line depicting a structure built south and almost around the Everglades Agricultural area; the Water Conservation Area Levees (WCAs-areas where water slowly travels south after being cleaned in Storm Water Treatment Areas (STAs) above them) are the grey lines around the WCAs; and last on this chart, the South Dade Conveyance System…
There are other canals as well. Thousands of miles of them….
These canals make our lives a living hell along the Indian River Lagoon, and must be re-plumed, but we must note that they also have allowed South Florida to rise above the poverty of our ancestors, and to develop some of the world’s most “productive” sugar and vegetable farms. Too bad they had to build their riches south of Lake Okeechobee blocking the flow of the lake! Also, much of this drainage system has allowed development of the east coast of south Florida, inside the Everglades’ boundary which is in yellow on the map above and red below.
The red line, shows were development has “crept into the Everglades.” This is obviously a problem for sending water south. Therefore, whatever is created to “send more water south,” must be created so as to avoid destroying lives or property.
West of the red lines shows the edge of what was once the Everglades in South Florida. Development has crept and continues to creep over this edge. (Photo/map courtesy of Chappy Young,/GCY Surveyors, 2014.)
So narrowing this down to “our” needs, how does one build a way to send more water south? And aren’t we already doing that? Let’s look at the projects being built first before we conclude our goals for more storage.
There are many projects on the books to help with sending water south: some include CERP (http://www.evergladesplan.org/about/about_cerp_brief.aspx) and CEPP…(http://www.evergladesplan.org/docs/fs_cepp_jan_2013.pdf), in fact parts of the Tamiami Trail are being raised right now, but according to many experts at the coalition, one thing is missing, enormous amounts of LAND. Land would help these projects come into being. There must be land to hold some of the tremendous amounts of water, and to clean it. Also realistically, the above projects will take generations to complete. Land purchase or no land purchase.
One thing is for sure, more land south of the lake would help the situation tremendously. As even a five year old can see, lack of lands south of the lake is the true disconnect. But where is there that much land and what are our options?
Below is a map of “Option 1,” and “Option 2”, lands in the Everglades Agricultural Area, lands that US Sugar agreed to sell in 2008. These lands remain for sale.
Perhaps US Sugar rather not sell these lands anymore. In 2008 they were going broke, but today, ironically after an infusion of cash from the South Florida Water Management District that was given to buy the paired down 26,800 acres purchased, and since the economy has improved since, US Sugar is thriving again.
But a “contract is a contract,” and thus there remains a contract allowing for the state of Florida to buy the option lands.
General consensus for many at the Everglades Coalition meeting was “buy the lands” with the new Amendment 1 (http://ballotpedia.org/Florida_Water_and_Land_Conservation_Initiative,_Amendment_1_%282014%29) monies starting with Option 1 because it is less expensive than Option 2, and can be traded for other lands, and because the option expires in October of 2015. The secondoption expires around 2020.
Option Lands Map SFWMD River of Grass
Would purchasing these slow everyone down even more, taking moneys and energy away from other projects?
Hmmmm? Maybe, but according to some very seasoned River/Everglades Warriors, it is worth it.
At the Everglades Coalition meeting Nathaniel Reed, Maggie Hurchalla, Mary Barely, former governor Bob Graham, and Mark Perry gave the group a “call to action” to purchase these option lands. It is a lofty goal and one that would change the game forever.
But there is not much time, and the legislature is in committee meetings “now.” (January through Feburary) and convenes (starts) March 3, 2015, and then ends in May! A rabbit race!
There is not a second to spare.
So long story short, there may be options as far a purchasing the sugar lands, but there is no option when it comes to advocating for such. Should this be your goal, you must start today! Start writing and calling below and thank you for being a part of history!
Map for the “Performance Configuration” co-authored in 2009, incorporating Plan 6 ideas for sending more water south.
First thank you to Dr Gary Goforth for providing much of this historical data.(http://garygoforth.net)
There is a lot of controversy surrounding the idea of “sending water south,” mostly because in order to do so privately owned lands would be taken out of sugar productivity. This post is meant to share some of the history of ideas over the years to do so, not debate it.
As we all know, before the lands south of Lake Okeechobee were drained for the budding agriculture industry in the late 1800s onward, when Lake Okeechobee overflowed, ever so gently its waters ran over the southern lip of the lake through a pond apple forest, creating a “river of grass” that became the Everglades.
In the 1920s at the direction of Congress and the State of Florida the Army Corp of Engineers (ACOE) redirected these overflow waters that had functioned as such for thousands of years through canals C-44 to the St Lucie River and C-43 to the Caloosahatchee.
This achieved better flood control for agriculture and development but has caused an environmental disaster for the northern estuaries and for the Everglades.
The environmental destruction and safety issues of the Herbert Hoover Dike were noted early on. As far as the destruction of a local industry, the fishing industry in the St Lucie River was the poster child. This and many other reasons caused many people over the years to seeks “improvements,” to the overall ecological system.
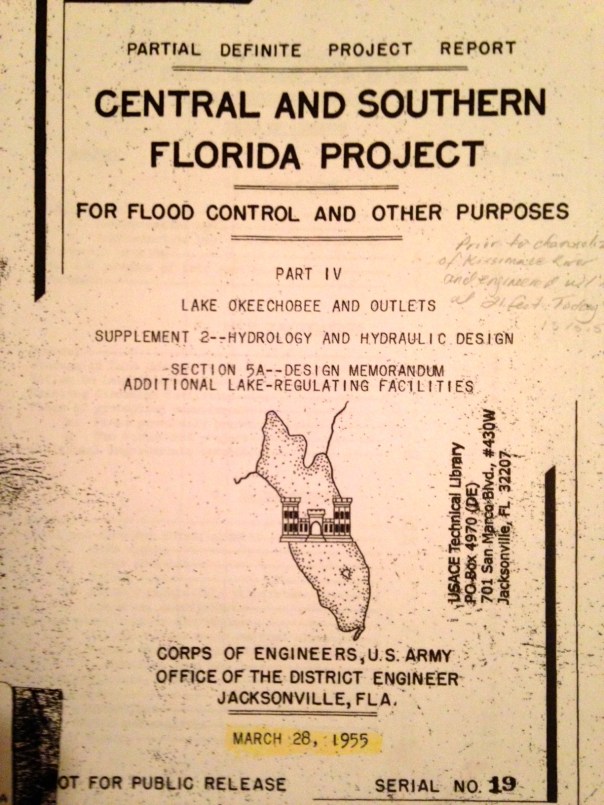
One of the first was the 1955 ACOE Central and Southern Florida Project Part IV. It was a proposal evaluating different options (plans) for “increasing lake outlet capacity. One component was “Plan 6,” a one mile wide floodway extending from the Herbert Hoover Dike to one mile into Water Conservation Area 3. For this report, Plan 6 was the recommended improvement. Dr Gary Goforth notes discharges to the St Lucie would have been lessened about by half, but “not eliminate lake discharges to the St Lucie River.” In the end, the entire plan was not acted upon as many tax payer paid plans are not…but Plan 6 was not forgotten…
Photos taken of 1955 ACOE CSFP Report courtesy of Dr Gary Goforth.
Floodway 1955
Various references to Plan 6 and a floodway.
Dr Goforth also notes a “more robust plan,”a plan co-authored in 2009 by Karl Wickstrum, Paul Gray, Maggy Hurchalla, Tom Van Lent, Mark Oncavgne, Cynthia Interlandi, and Jennifer Nelson. (See first photo in this blog.) This plan is referenced by Mark Perry in his well known “River of Grass” presentation.
Mark Perry’s drawing in his presentation for “River of Grass,”used today, 2014.
The Art Marshal Foundation (Art was one of the great conservationist of the early 1960/70s environmental movement and has a wildlife preserve named after him) also notes in their literature that Plan 6 is traceable to the Marshall Plan-1981.
“Marshall Plan 1981 to Repair the Everglades, Why Plan 6 Will Work.” Marshall Foundation publication 2013, Version 2.2.
Most recently in 2013, the Rivers Coalition published on its website “Plan 6 Flowway, River of Grass, Missing Link.”
You can learn more about this version of the plan by clicking on the above link.
All of these plans, I believe, are one way or another based upon the 1955 ACOE Report. it may not have come to fruition but it certainly provided a lot of inspiration!
Also last year, Senator Joe Negron was able to secure $250,000 for a University of Florida study that should occur in 2014 for “Sending more water south.” Wonder what their plan will recommend?
If history repeats itself, even more Plan 6 versions will be created. In any case, let’s keep pushing for change to save the estuaries and find some way to move more water south. And thank you Army Corp of Engineers for the inspiration…
Fresh water releases from basin runoff through local canals C-23, C-24, and C-44 as well as polluted fresh water from releases from Lake Okeechobee through C-44, cover near shore reefs off of Stuart and Jupiter Island. (Photo MC archives, 2011.)
The concept that fresh water is a “pollutant” is sometimes confusing as we typically associate pollution with heavy metals, nutrients like phosphorus and nitrogen from fertilizer, and muck accumulation, on the bottom of the river, from sediments running off of lands, through canals. Believe it or not, too much fresh water is just as polluting and has dire consequences for the St Lucie River/Indian River Lagoon.
This is historically ironic as well, as when the Ais Indians lived in this area, the St Lucie River was a large fresh water “stream.” Throughout history, most of the time, the “St Lucie,” was not connected to the ocean. The natural inlet at what was later called “Gilbert’s Bar” by the Spanish was sometimes open, sometimes not, but never for too long, and the inlet opening was much smaller and shallower than today’s St Lucie Inlet.
Yes, we are going back, before we go forward, but history is important to know!
The “St Lucie Inlet” was permanently opened by hand using shovels, in 1892, by local pioneers who wanted access to the ocean for trade and communication. They had no idea that by doing this they would create “the most bio-diverse estuary in North America.”
As the salt water came in and mixed with the fresh water of the St Lucie and the “fresher than today’s water” of the Indian River Lagoon, one ecosystem, a freshwater ecosystem was destroyed by the salt, and another was born.
Over time, more fish and critters entered the St Lucie/ Southern Indian River Lagoon than at any other time in known history. The forks of the St Lucie, north and especially north, remained more “fresh” as the salt water usually did not go up that high into those areas. Perfect! Salt and fresh water fishing! It was a unique situation and as mentioned in the day before yesterday’s blog, presidents and other famous people swarmed to the St Lucie for its amazing fishing during this era, and all enjoyed.
Then things changed. In the late 1920s and early 30s, due to flooding of agricultural lands and bad hurricanes killing people living and working in the southern area surrounding the lake, the Army Corp built the C-44 canal from Lake Okeechobee to the south fork of the St Lucie River. Then in the 50s and 60s they built canals C-23 and C-24 as part of the Central and South Florida Flood System, another “flood protection project.” Although all of these drainage programs helped agriculture, especially the sugar industry south of the lake, and citrus, in mostly St Lucie and parts of Okeechobee counties, as well as greedy developers, it did not help the St Lucie River. In fact, these drainage canals have been slowly killing the St Lucie and Indian River Lagoon ever since.
How?
Through many things, but believe it or not, mostly through fresh water.
Once the estuary (St Lucie/IRL) became brackish, a mixture of fresh and salt water, this delicate balance was important to the fish, mammals and others critters that made the river/lagoon their home in this new found paradise.
Briefly, I will summarize some of the killer effects of fresh water on its residents:
1. Fish: When there is too much fresh water the fish get lesions. This is from a fungus that only can live and operate in a fresh environment. The name of the fungus is Aphanomycesinvadans and its spores get into fish skin when temperatures are low and water is fresh causing horrible lesions. More lesions have been reported over time in the St Lucie River that any other site in Florida according to the FDEP report at the end of this blog. The worst outbreak was in 1998 after the ACOE had been releasing fresh water from Lake Okeechobee in the winter months due to heavy rains. Thousands of fisherman were reporting fish with lesions; it is well accepted in the literature of our state agencies that this outbreak was connected to the gigantic releases of fresh water from Lake O.
Striped mullet with lesions. St Lucie River, 1998. (Photo, DEP State of Florida.)
2. Bottle nosed dolphins: Dr Gregory Bossert formerly, of Harbor Branch, has done extensive research into lobo-mycosis, an awful skin disease, in dolphins of the SLR/IRL. The highest number of dolphins with lobo in the entire 156 mile Indian River Lagoon system from Jupiter to New Smyrna Beach, are in the Stuart to Sebastian area. Dr Bossert’s 2009-20014 “Application for a Scientific Research Permit” to NOAA states on page 59:
“Water quality in the central and southern segments of the lagoon, is influenced by infusion of water from flood control drainage canals, e.g., in particular, run-off form agricultural watersheds and fresh water releases from Lake Okeechobee. (Sime, 2005.) Discharges from these sources introduce higher amounts of nutrients, metals, pesticides and suspended solids into the system (Woodward-Clyde, 1994). Analysis of spatial distribution of presumptive cases showed that the highs rates occurred in the IRL segments 3 and 4 confirming our earlier observations.” (Mazzoil, 2003/Rief, 2006).”
(Sections 3 and 4 are the “south central” and “south” IRL/SLR-from-south of Sebastian Inlet, to Stuart’s St Lucie Inlet. IRL dolphins are “site specific” staying usually in a 30 mile range. The St Lucie River is considered part of the southern IRL.)
S. Indian River Lagoon Dolphin with lobo mycosis. (Photo Dr Gregory Bossert.)
3. Seagrasses: Seagrasses are the basis of health for the entire SRL/IRL. Seagrasses that live in an “estuary” need sunlight and brackish (part salt/part fresh) water to survive. among other problems, the fresh water releases cause turbidity in the water so the grasses can’t get light and they die. Mark Perry of Florida Oceanographic states that during the Lake Okeechobee and canal releases from 2013, that lasted five months, up to 85 percent of the seagrasses died around the St Lucie Inlet. All nursery fishes are affected by this and of course it goes right up the food chain. Manatees, an endangered species, that live exclusively off of seagrasses, are very affected and reduced to eating drift algae that in some cases kills them. Dolphins are swimming around saying: “Where are the fish?!”
Unhealthy looking seagrasses coated in algae as seen 6-14 near St Lucie Inlet at low tide. (Aerial photo, Jacqui Thurlow-Lippisch)
4. Near shore reefs: The reef system in our area is the northern most of a tropical reef system that goes all the way south to the Keys. It cannot survive with fresh water dumping sediment on its delicate system and altering the salinity of the St Lucie Inlet. Insaine. These reefs are supposedly “protected.”
Freshwater pollution and near shore reef, St Lucie Inlet. (MC archives, 2011.)
I could go on and on, but I will stop here. I’m sure you get the point. Salinity is a delicate and important part of a healthy estuary. Generally short lived fresh water releases during heavy rains by our local canals are bad enough, but long term dumping of Lake Okeechobee releases on top of that, is certain death. It must stop. Send the water south.
_______________________________________________
(NOTE: The links below were removed by the Florida Department of Environmental Protection in 2016. When I called and asked why, I was told they were archiving…JTL)
 When Ed and I recently visited Flamingo and rented a boat to explore White Water Bay, my goal had been to find the Shark River. I never found it…


 -Ponce de Leon Bay where Shark River exits into Florida Bay

 –The Shark River is the primary river you see coming into this area of Ponce de Leon Bay. White Water Bay is to the right. It all kind of blends together.