Tag Archives: over drainage

An Incredible Flight! 1958 USGS Quads ~Everglades, Loxahatchee Slough, Allapattah Flats, and St. Johns River Marsh, by Todd Thurlow

USGS 1958 Quad Western Martin and St.Lucie, slide Todd Thurlow, Time -Capsule Flights

Today, I present, yet another incredible Time-Capsule Flight by my brother Todd Thurlow. (https://jacquithurlowlippisch.com/todd-thurlows-time-capsule-flights/). This flight takes us on a tour over the Everglades, the Everglades Agricultural Area,  Loxahatchee Slough,  Allapattah Flats, Ten Mile Creek, and the St Johns River Marsh, fading in and out, so one can see what the landscape/waterscape looked like in 1958 using USGA topographical maps compared to today’s Google Earth maps.

What is most striking for me, is how undeveloped, how undrained, much of the land was in 1958, not really that long ago… 61 years ago.  For reference, my husband, Ed, is 62 years young!

More than we can image has happened to South Florida since 1958…

For instance, when Todd flies by notice how little sugarcane and other crop production was taking place in the Everglades Agricultural Area just south of Lake Okeechobee compared to today. Now there are about 525,000 acres of sugarcane, back then, there appears to have been fewer than 50,000 acres of sugarcane in acreage.

Everglades National Park had been in place since 1947, but look at the difference in Whitewater Bay,  as well as Taylor and Shark River Slough; and what about Florida Bay?

The Loxahatchee Slough region, near Jupiter, in Palm Beach County? Holy moley, notice how the once magnificent slough was made smaller by development encroaching  from every direction, eventually leaving “Grassy Waters” at the southern end – as the sole water supply, via rainfall for all of West Palm Beach…

When Todd travels north over Marin, St Lucie, and the southern edge of Indian River County, perhaps the biggest shock for me endures, as I grew up in this area ~(For reference, I’m 55 years old 🙂

You’ll see that on the USGA map, southern Indian River, St Lucie, and Martin counties are shown in wavy blue as a gigantic marsh, at certain times of year, FULL of clean water!!!! Crazy! Since 1958 these lands have been drained (Ten Mile Creek) that was hydrologically connected to the marsh, through canals C-23, C-24 and C-25; and the waters of the St Johns “Stick Marsh,”( the headwaters of the St Johns River), a north flowing river, are now also drained south into the St Lucie River.  Agriculture fields and nearby highways cover those most of those stick marsh lands today.

And the central larger marsh?  “Allattah Flats,” also known as “Allpattah Marsh,” or in old military Indian war maps, “Alpatiokee Swamp? Well, the City of Port St Lucie, with over 250,000 residents, and acres of ailing greening orange groves, and more agricultural fields fill these areas today.

Just unbelievable, isn’t it?

Talk about “taking control of one’s environment. “Kind of cool, but I’d say we have really over done it, considering that now our waters, critical for life itself, are almost entirely impaired.

It is my wish that as the residents of Florida push their governments to work for cleaner water, and restore some of these lands, that we all keep in mind the history of what the lands were, working with Mother Nature, not against her.

Todd’s Time Capsule Flights are an invaluable tool in recognizing how much human determination has changed these lands, and how a modern-day determination can restore them. Please click on below and enjoy! Thank you Todd!

An Incredible Flight! 1958 USGS Quads, the Everglades, Loxahatchee Slough, Allapattah Flats, and St. Johns River Marsh, by Todd Thurlow

(https://youtu.be/m7bOEAXbOyA)

1958 USGS Quads of the Everglades, Loxahatchee Slough, Allapattah Flats, and St. Johns River Marsh

This time capsule flight overlays three 1958 USGS Quadrangle Maps of southeast Florida from Florida Bay to the St. Johns River Marsh in Indian River County. You will see the following places:
0:30 Whitewater Bay
0:39 Shark River
1:44 The Everglades Agricultural Area (EAA)
2:20 Loxahatchee Slough
3:15 Allapattah Flats
3:35 Tenmile Creek
4:03 St. Johns River Marsh

Historical Topographic Map Collection legend

Kudos to the Young People! “A River Film: Pollution in the St Lucie Estuary,” by Student Geoffrey Smith, SLR/IRL

Cover of video
Cover of video by Geoffrey Smith Jr. See link or image below to access video.

Link to video: (https://www.youtube.com/watch?v=fLURypmsHOE&sns=tw)

The most rewarding part of my St Lucie River/Indian River Lagoon journey is working with young people. Today I share a video created by Geoffrey Smith Jr., a graduating senior at the Pine School in Hobe Sound.

Many of you may have viewed this video on Facebook as it has been a big hit and already has over 500 views, but in case you are not the “Facebook type, “today,  I am sharing it through my blog. The video production is part of Geoffrey’s Capstone Project for graduation.

I commend Geoffrey for his interest on the topic of water and pollution issues in Florida. His video required many hours and includes interviews those below.  I especially was impressed that Geoffrey interviewed Mr. Sonny Stein, president of Stein Sugar Farms, and multi-generational farmer in the Everglades Agricultural Area. Both sides must always be represented at the table of judgment…

As you will see, Geoffrey also had a chance to interview Michael Grunwald, author of  “The Swamp.”

I know my part chosen for the video is very hard on the agriculture industry…as you’ll hear later, I am doing my best to clean up my own yard…

How does the saying go?

“Shine the light, and the people will find their way….

“Thank you Geoffrey for shining the light, may we all find our way, good luck with graduation this week, and we all look forward to seeing more of your work in the future!

Nat Osbourn
Nathaniel  Osborn author of “Oranges and Inlets, An Environmental History of the Indian River Lagoon”
Mark Perry
Mark Perry, Executive Director of Florida Oceanographic
Sonny Stein
Sonny Stein, long time sugar family farmer
Jacqui Thurlow-Lippisch
Jacqui Thurlow-Lippisch, commissioner, Town of Sewall’s Point, Martin County
Marty Baum
Marty Baum, Indian Riverkeeper
Nic Mader
Nic Mader, Dolphin Ecology Project
Michael Grunwald
Michael Grunwald, author of “The Swamp”
Me and Geoffrey Smith
Geoffrey Smith and I at Town Hall during interview. Geoffrey is a senior at the Pine School.
Roseate Spoonbill...
Roseate Spoonbill…according to Florida Audubon, since the early 1900s, the bird population of Florida’s Everglades is down 95% due to the over-drainage of South Florida and the agriculture and development of the state.

The Pine School: (http://www.thepineschool.org)

Insight For Change, Development and Agriculture, North Fork, Ten Mile Creek, SLR/IRL

Contrasting images: Port St Lucie area along North Fork of St Lucie River, 1958 US Government aerials and Google Earth today. Courtesy Todd Thurlow.

Link to video: (https://www.youtube.com/watch?v=K1E8o2TExGs&feature=em-upload_owner)


It is an amazing thing to fly through time and space, and this is exactly what I did yesterday with my brother, Todd. He took me on a “flight” over a 1958/Today St Lucie River, North Fork, and Ten Mile Creek. All the while, the images flashing in and out of past and present….Please watch this short video yourself by clicking the link or image above.

At one point along our armchair journey, I said to myself, “Wow, I don’t feel so great,” –just like sometimes when I am with Ed, my husband, in the airplane. I actually got motion sickness having plastered my face right up to the screen to see every moving detail!

A few deep breathing exercises put the feeling off, but next time I’ll take my Dramamine!

Google Earth image at the northern reaches of what was Ten Mile Creek in St Lucie County. Algae in agriculture canals is very visible.

This flight, as the others you may have experienced on my blog with Todd, is amazing. It allows one to really see what the lands were originally like and how they have been developed as residential homes and endless agriculture fields.

Towards the end of the video, you can even see algae growing in the agriculture canals, off of Ten Mile Creek, St Lucie County–“bright green,” for all to see on Google Earth. I have witnessed these green canals too from an airplane.

Due to drainage canals— leading to drainage canals—leading to drainage canals, this water from the ag fields, and from all of our yards, ends up in the now sickly St Lucie River. This problem is exacerbated by ACOE/SFWMD releases from Lake Okeechobee and the basin area of C-44 in Southern Martin County. These canals and the expanded engineered runoff from the lands is what is killing our river.

It is my hope that with visuals like the video above, future generations will find a way, and want to be a part of a new water and land management generation “seeing” how to improve St Lucie River/Indian River Lagoon. Our generation seems stuck in a quagmire….

Like they say: “seeing is believing,” and seeing provides insight for change. 

*Thank you to my brother Todd, for this incredible journey using overlays of aerial photographs taken in 1958 by the United States Government, and marrying these aerials over images from today’s Google Earth. (http://thurlowpa.com)


Northern reaches of North Fork of St Lucie River, Ten Mile Creek in St Lucie County, 1958.
Northern reaches of the North Fork of St Lucie River, Ten Mile Creek in St Lucie County, 1958. Wetlands showing multiple small ponds are visible. These lands were drained in the 1950s by canals C-24, and further south C-23 and further north by C-25. These canals were part of the USACOE  and SFWMD’s effort for more flood control and to expand agriculture and development: These canals are part of the Central and South Florida Flood Control Project of the 1950s which allowed more non flooding development and agriculture, but also destroyed our valuable south Florida waterways.

DEP: C-24 as part of the Central and Southern Flood Control Project 1950s:(http://www.dep.state.fl.us/southeast/ecosum/ecosums/c24.pdf)

*The yellow lines are today’s roads for reference; 91 is the Florida Turnpike built in the 50s and 60s.


Drainage, Lake Okeechobee, the Everglades, St Lucie River/Indian River Lagoon

Historic 1913 postcard of canal in  Miami, Florida. Courtesy of the Thurlow Collection.
Rare historic 1913 postcard is titled: “Drainage canal and Everglades, Miami.” Courtesy of the Thurlow Collection.

My theme this week has been “that which is south of the lake.” The big lake that is, Okeechobee–big waters. The Everglades.

We must always keep in mind that we are all connected, and to fix our water problems with the St Lucie River /Indian River Lagoon we have to understand the rest of south Florida’s drainage system as well.

Last night my mother sent me the fabulous colorized historic 1913 post card above. It is titled “drainage canal and the Everglades, Miami. “So idyllic. So beautiful.  Except for the giant gash in the land to the right of the card that foreshadows the future we are all now living: over-drainage.

Canal ca. 1920 pubic photo,  "west of Ft Lauderdale."
Canal ca. 1920 pubic photo, “west of Ft Lauderdale.” Gunter Herman, 1885-1972. Florida Memory Project.

Drainage in Florida began as early as the mid 1800s and was the goal of Florida’s first government admitted to the United States on March 3, 1845. It remains the goal of our government today, as 1.7 billion gallons of fresh water a day goes to tide through south Florida canals.  I must say the state may be starting to catch on. Water farmers, the “latest rage,” will tell you that we spent the last 100 years taking the water off the land, and we will spend the next 100 years putting it back on….

As we know, the ACOE is directed through Congress as to what it is to do. “The State,” meaning Florida, plays a huge role in this “ask.” Today, I have a Treasure Coast Regional Planning Council meeting. This council plays a role as far as “intergovernmental coordination and review,” of coordinating between local governments and the federal government. (http://tcrpc.org)

The last two images of this blog show the photos included from the TCRPC packet. I found it rather ironic and “civilized” sounding that the areas around the lake are named “Herbert Hoover Dike Common Consequence Zones.” I assume the consequence is that if the dike breaks, there is death and destruction of property and people. Maybe it would help if there were an outlet south of that lake to relieve some of the pressure on the dike? A flow way perhaps?

Anyway, I can’t help but wonder, looking at the 1856 Military Map of Florida, if it wouldn’t have been better to work with nature, with the lake, instead of so against it?

War map of the Everglades created during the Seminole Wars, 1856.

The first video below is of the reenforcing the Herbert Hoover Dike in 2009. In 2005, after Hurricanes Francis and Jeanne, it was decided to reinforce basically the entire southern area of the dike as it is listed as one of the most dangerous and unstable in the United States. Reenforcement? I get it; nonetheless, what a crazy place to build an empire….


Take a look and see: ACOE’s building of dike: (https://youtu.be/BpgN8c2M1lg); History of dike and Lake O. according to ACOE (https://m.youtube.com/watch?v=KpkhJgV_mLo)

EAA below Lake Okeechobee, public image.


Canal and basin map SLR/IRL. (Public)
Canal and basin map of our area -SLR/IRL. (Public)


Surface drainage water map of south Florida,
HHD Common Consequence Zones and Projects Area, CCZ from Belle Glade to Lake Harbor, ACOE 2015.
HHD “Common Consequence Zones” and Projects Area, CCZ from Belle Glade to Lake Harbor, ACOE 2015.
"HHD original destination of reaches" ACOE 2015
“HHD original destination of reaches” ACOE 2015.

___________________________

The National Environmental Policy Act (http://en.m.wikipedia.org/wiki/National_Environmental_Policy_Actrequires the ACOE to do an Environmental Assessment for the Herbert Hoover Dike’s Rehabilitation Reports. This is the latest: (http://www.saj.usace.army.mil/Media/NewsReleases/tabid/6071/Article/580496/environmental-report-on-proposed-dike-repairs-available-for-review.aspx)

Herbert Hoover Dike, Lake O. ACOE: (http://www.saj.usace.army.mil/Missions/CivilWorks/LakeOkeechobee/HerbertHooverDike.aspx)

Good visuals of HHD rehab here: (http://www.news-press.com/story/news/local/2014/10/04/herbet-hoover-dike-region-risk/16737395/)

The Far Reaching Hand of Hamilton Disston/Our Savannas, and the Indian River Lagoon

Aerial photo over the Savannas, a mosaic of color comparable to one of Monet's most beautiful.
Aerial photo over the savannas.(Photo Jacqui Thurlow-Lippisch/Ed Lippisch 2013.)

I learned something recently that surprised me…

Hamilton Disston, the titan-developer and “drainer extraordinaire” who bailed Florida’s “Internal Improvement Fund” out of debt in 1881 owned land right here in St Lucie and Marin Counties. (http://en.wikipedia.org/wiki/Hamilton_Disston)

My first thought upon realizing this, was “what if he’d started draining here? “

Disston instead started along the Kissimmee River and Lake Okeechobee and was the impetus and inspiration for draining south and central Florida which has led to our state’s development but also our environmental destruction.

Disston 4,000,000 acres from the state of Florida in 1881, which included much of the land within the savannas. ( Public map, 1881.)
Disston purchased 4,000,000 acres from the state of Florida in 1881, which included much of the land within the savannas. ( Public map, 1881.)

The above map shows in pink the 4,000,000 acres of land that Hamilton Disston purchased which although hard to see  included much of the land within our savannas.

Plat map of St Lucie Gardens originally part of Disston's lands in the savannas, 1911. (Courtesy of historian Sandra Thurlow)
Plat map of St Lucie Gardens originally part of Disston’s lands in the savannas, 1911. (Courtesy of historian Sandra Thurlow)

Another wild thing I recently realized in relation to Hamilton Disston is that my friend Sam Henderson, of Gulfport, is the mayor of Disston’s first founded city. Gulfport is in Pinellas County near Tampa. Sam is certainly one of the most environmentally oriented mayors in the state; we know one another from our work on the Florida League of Cities’ environmental committee.  (http://en.wikipedia.org/wiki/Gulfport,_Florida)

Mayor Gulfport, Sam henderson and I at a recent Florida League Cities meeting, 2014.
Mayor of Gulfport, Sam Henderson and I at a recent Florida League of Cities meeting, 2014.

So for some reason, before my epiphany last week, I had no idea that Disston’s drainage machine went so far north beyond Tampa, to where Sam lives on the west coast, and so far east, to my home area near the savannas, along the Indian River Lagoon. You’d think I’d know such a thing!

Savanna State Park, Martin and St Lucie Counties. (Photo from their website.)
Savanna State Park, Martin and St Lucie Counties. (Public photo.)
The Savannas today are located  between Jensen Beach Boulevard to Midway Road.
The Savannas today are located  between Jensen Beach Boulevard to Midway Road. (Public map.)

Well my mother Sandra Thurlow did know, and when I ask her about it she told me that in her book  Historic Jensen and Eden on Florida’s Indian River, I could read all about the savannas ecosystem that was once almost 200 miles long and has been reduced to 10 ecologically intact miles between Ft Pierce and Jensen Beach, and how the railway running along its eastern edge ironically protected it.

She also noted that in 1854, a Florida state engineer/geologist proposed cutting a canal from the “Main Savanna” into the St Lucie Sound. This did not happen, but some of the land was developed as St Luice Gardens and development certainly has encroached…

What if they’d drained it all…..

To close, we are fortunate that Hamilton Disston did not start draining around the SLR/IRL and that we have a small remnant of the savannas left. Let’s continue building  friendships with other environmentally water-oriented people our across our state and put the drainage spirit of Hamilton Disston on the shelf where it belongs.

_______________________________

Many thanks to those who worked to create Savannas State Park like former Martin County commissioner Mrs Maggie Hurchalla.

Savannas State Park website: (http://www.floridastateparks.org/savannas/)


“Mueva el agua al sur!” South Florida’s Impacts and Needs, St Lucie River/Indian River Lagoon

Color graph showing land use and development possible through drainage and redirection of natural water flow in South Florida by 1953. (SOFIA, Robert Renken team 2000.)
Color graph showing land use and development in South Florida by 1972 made possible by drainage and re-plumbing of Lake Okeechobee waters to the northern estuaries. (SOFIA, Robert Renken team 2000.)

To understand the impacts on the St Lucie River/Indian River Lagoon, it is necessary to look in beyond our boarders.  One of the most telling documents helping to explain why the St Lucie River/Indian River Lagoon is forced to take the over flow water of Lake Okeechobee (which in some years, since 1923, has been above 2,000,000 acre feet) is a document entitled “Synthesis of the Impacts of 20th Century Water Management Land Use  Practices on Coastal Hydrology of South East Florida,” by Robert Renken and other scientists  for the 2000 Greater Everglades Ecosystem Restoration Conference.

The full document is here: (http://sofia.usgs.gov/geer/2000/posters/use_impact/index.html)

Today I will show parts of this document as “food for thought.”

Chart 1, 1900
Chart 1, 1900.

As one can see above, in 1900, Lake Okeechobee overflowed naturally to the Everglades  to Florida Bay. The green on the eastern coast was a Florida forest.

Chart 2, 1952
Chart 2, 1953.

By 1953, the year after my Thurlow grandparents came to Stuart from Syracuse, New York, the Everglades Agricultural Area, (EAA), just south of the lake had caused the destructive redirection of Lake Okeechobee waters; this water was directed to the northern estuaries, the St Lucie River/Indian River Lagoon on the east, and to the Calooshatchee on the west.  More agriculture can be seen in dark brown along the eastern coast and south to Homestead. Forests in some areas remain (green). The yellow is urban development. There is some urban development but it is not extensive.

By 1972 when I was 8 years old growing up in Stuart, the EAA had morphed to gigantic proportions and coastal development had moved into the eastern Everglades.
Chart 3, 1972.

By 1972, when I was 8 years old growing up in Stuart, the Everglades Agricultural Area (EAA) now mostly sugarcane, south of Lake Okeechobee, had morphed to gigantic proportions (dark brown), agriculture had also expanded along the eastern coast, and coastal development (yellow) had grown and moved into the eastern Everglades.  

Chart 4, 1995.
Chart 4, 1995.

By 1995, when I was 31 years old, and teaching English and German at Pensacola High School, the EAA had achieved its 700,000 acreage south of the lake, and although there remained extensive agriculture (dark brown) along the east coast, excessive urban development had taken over many of these lands (yellow.)

Today, there is nothing but more rapid population growth projected for this area. There were 5,564,635 inhabitants of the Miami-Dade metropolitan area as of the 2010 Census; it is the most populous in Florida, and southeastern United States. It is the eighth-most populous area in the entire United States. (http://en.wikipedia.org/wiki/Miami_metropolitan_area)

For me, this rapid population and agriculture growth is rather depressing, but I will say Ed and I had a great Cuban meal in West Miami at Islas Canarias Restaurant over the  Labor Day weekend…

At the end of the day, this area is going to need more water. With a growing population, documented salt water intrusion, and sinking aquifer level this part of the county will not stand the test of time unless it has more fresh water.  Perhaps they would reconsider re-plumbing the canals making releases to the estuaries?

“Move the Water South” may just start being chanted from Miami…

I hear it now, don’t you?

“Mueva el agua al sur!”

The History, the Future, of Plan 6 and “Sending Water South,” St Lucie River/Indian River Lagoon


plan 6 prototype
Map for the “Performance Configuration” co-authored in 2009, incorporating Plan 6 ideas for sending more water south.

First thank you to Dr Gary Goforth for providing much of this historical data.(http://garygoforth.net)

There is a lot of controversy surrounding the idea of “sending water south,” mostly because in order to do so privately owned lands would be taken out of sugar productivity. This post is meant to share some of the history of ideas over the years to do so, not debate it.

As we all know, before the lands south of Lake Okeechobee were drained for the budding agriculture industry in the late 1800s onward, when Lake Okeechobee overflowed, ever so gently its waters ran over the southern lip of the lake through a pond apple forest, creating a “river of grass” that became the Everglades.

In the 1920s at the direction of Congress and the State of Florida the Army Corp of Engineers (ACOE) redirected these overflow waters that had functioned as such for thousands of years through canals C-44 to the St Lucie River and C-43 to the Caloosahatchee.

This achieved better flood control for agriculture and development but has caused an environmental disaster for the northern estuaries and for the Everglades.

The environmental destruction and safety issues of the Herbert Hoover Dike were noted early on.  As far as the destruction of a local industry, the fishing industry in the St Lucie River was the poster child.  This and many other reasons caused many people over the years to seeks “improvements,” to the  overall ecological system.

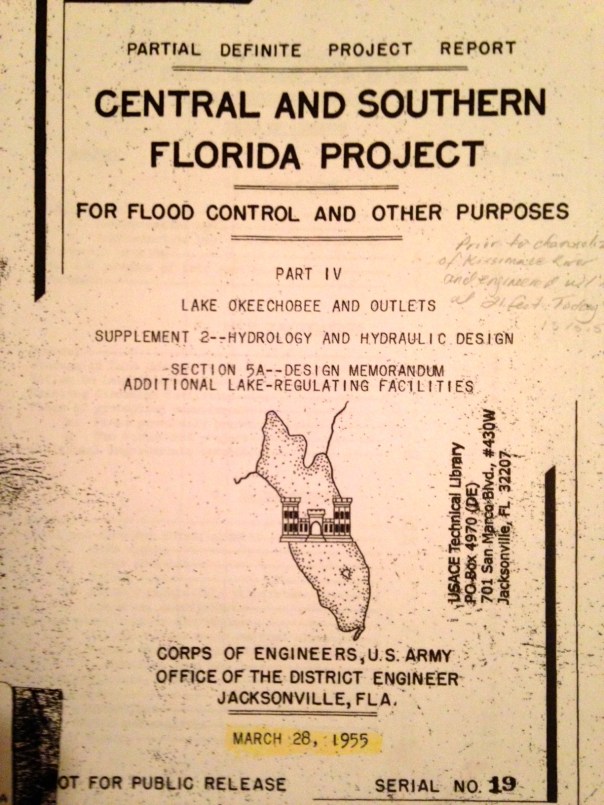
One of the first was the 1955 ACOE Central and Southern Florida Project Part IV. It was a proposal evaluating different options (plans) for “increasing lake outlet capacity.  One component was “Plan 6,” a one mile wide floodway extending from the Herbert Hoover Dike to one mile into Water Conservation Area 3. For this report, Plan 6  was  the recommended improvement.  Dr Gary Goforth notes discharges to the St Lucie would have been lessened about by half,  but “not eliminate lake discharges to the St Lucie River.” In the end, the entire plan was not acted upon as many tax payer paid plans are not…but Plan 6 was not forgotten…

photo 1
Photos taken of 1955 ACOE CSFP Report courtesy of Dr Gary Goforth.
photo 5
Floodway 1955

photo 3 photo 2

Various references to Plan 6 and a floodway.

Dr Goforth also notes a “more robust plan,”a plan co-authored in 2009 by Karl Wickstrum, Paul Gray, Maggy Hurchalla, Tom Van Lent, Mark Oncavgne, Cynthia Interlandi, and Jennifer Nelson. (See first photo in this blog.) This plan is referenced by Mark Perry in his well known “River of Grass” presentation.

Plan 6
Mark Perry’s drawing in his presentation for “River of Grass,”used today, 2014.

photo 1

The Art Marshal Foundation (Art was one of the great conservationist of the early 1960/70s environmental movement and has a wildlife preserve named after him) also notes in their literature that Plan 6 is traceable to the Marshall Plan-1981.

marshall
“Marshall Plan 1981 to Repair the Everglades, Why Plan 6 Will Work.” Marshall Foundation publication 2013, Version 2.2.

Most recently in 2013, the Rivers Coalition published on its website “Plan 6 Flowway, River of Grass, Missing Link.”

photo 2

Rivers Coalition Plan 6, the Missing Link, River of Grass, 2013.
Rivers Coalition Plan 6, the Missing Link, River of Grass, 2013 (http://riverscoalition.org/the-solution/)

You can learn more about this version of the plan by clicking on the above link.

All of these plans, I believe, are one way or another based upon the 1955 ACOE Report. it may not have come to fruition but it certainly provided a lot of inspiration!

Also last year, Senator Joe Negron was able to secure $250,000 for a University of Florida study that should occur in 2014 for “Sending more water south.” Wonder what their plan will recommend?

If history repeats itself, even more Plan 6 versions will be created. In any case, let’s keep pushing for change to save the estuaries and find some way to move more water south. And thank you Army Corp of Engineers for the inspiration…


Finding Out How Much Discharge is Killing Our SLR/Indian River Lagoon and Where it’s Coming From

C-44, C-23 and C-24 basin runoff discolor the waters of the SLR/IRL while exiting the St Lucie Inlet 7-19-14. (Aerial photo, Ed Lippisch.)
C-44, C-23 and C-24 basin runoff discolors the waters of the SLR/IRL while exiting the St Lucie Inlet 7-19-14. (Aerial photo, Ed Lippisch.)
All Photos were taken 7-19-14 and are showing C-44 basin runoff along with C-23 and C-24 runoff into SLR/IRL. (Photos by Ed Lippisch.)
All Photos were taken 7-19-14 and are showing C-44 basin runoff along with C-23 and C-24 runoff off. Pictured are Sewall’s Point and Sailfish Point  along the SLR/IRL. Water exits at the St Lucie Inlet going mostly south to Jupiter Island over nearshore reefs. The plume is significant but not as large as the summer of 2013 when the ACOE was releasing from Lake Okeechobee as well. (Photos by Ed Lippisch.)

The river looks awful right now as the photographs taken Saturday, 7-19-14, by my husband show. Why? They are not even discharging from Lake Okeechobee…yet.

We have terrible problems with our local canals and adding the Lake discharges on top of it is a crime. The state, federal and local governments are working slowly to improve the situation through CERP (Central Everglades Restoration Project) projects but improvement is very expensive and cumbersome.(http://www.evergladesplan.org/pm/projects/proj_07_irl_south.aspx)

IMG_5593IMG_5597IMG_5604IMG_5610IMG_5631IMG_5649

The C-44 Storm Water Treatment Area/Reservoir the governments are working on now will cost millions of dollars and store only some of the discharges from the C-44 we are getting today. But there must be more. We must learn more. We must keep pushing and helping our governments move along.

The best way to do this is to know how to read the information on water discharges yourself.

Last summer, when the discharges from Lake Okeechobee threw our already ailing river into toxic status, Boyd Gunsalus, one of the the leading scientists (and certainly coolest) at the South Florida Water Management District, showed me how to find the water discharge statistics, and  today, in case you do not know, and are interested, I am going to show you.

FIRST THE LAKE AND C-44 BASIN

This link (http://w3.saj.usace.army.mil/h2o/reports.htm) of the ACOE at Lake O. will show you the level of the lake, and whether the ACOE is releasing from the C-44 canal, and or Lake O.

Go to the site above and on the right hand side you will see, St Lucie Lock, S-80 Spillway. Click on it. A chart will come up arranged by dates. (The data is always one day behind.) Look for FLOWS CFS (cubic foot per second) in the 3rd column. Today’s is 260 cfs. : 20JUL14  14.46  0.58  260 0. 00  270  0.0 7 30.07  1018. 2 0.00

Now go back to the same link and look at, Port Mayaca Lock, S-308 Spillway. Click on it. Again look for 3rd column, FLOWS CFS.. Today reads “0.” The gates from the lake to C-44 are not open. 20JUL14  13.55  14.40  0 0.00  270 0.0  9 30.04  1017.3  0.33  0.00

Now if both S-80 and S-308 are open you have to add the numbers together to know how much total cfs are coming into the SLR/IRL. And to figure out how much water is coming in just from the lake, subtract the S-308 number from the S-80 number which will always be larger.

To learn how high Lake O. is go back to the link, go to the chart and hit CURRENT LAKE OKEECHOBEE LEVEL. Today it is 13.66 feet. “Current Lake level is: 13.66 (ft-ngvd)”

OTHER CANALS

OK, now for C-23, C-24 and C-25.

Now, go to this link, the SFWMD’s web site: (http://www.sfwmd.gov/portal/page/portal/sfwmdmain/home%20page) 1. Look for the tab “Managing and Protecting Water;” look under and to the left of this tab for a small title reading “Scietists and Engineers,” click on this and go to LIVE DATA. 3. Go to the top link “Water Conditions-Regional Realtime Data, Status of Water/ Control Gates.” 4. Go to FT PIERCE and click right on the Ft Pierce link. A confusing chart will come up.

Look for these things:

1. S-49. S-49 is the opening for C-24.

2. S-97. S-97 is the opening/gate for C-23

3. S-99. S-99 is the gate for C-25.

Mind you C-23 and C-24 run into the St Lucie River’s north fork and main area and C-25 dumps directly in the IRL at Taylor Creek close to the Ft Pierce Inlet. So C-25 is not coming through the SLR and St Lucie Inlet like the rest of the sludge but it is important to know C-25 too as it is heavily destructive to the IRL.

OK, if you have been able to follow me so far. Once you open the SFWMD pages and get to FT PIERCE and see the weird chart, find the corresponding gate numbers I gave you above, and click on the the second row’s PLOT little box and arrow. Once this opens up, you will see a chart corresponding to discharges that looks like a wave or like boxes. The hight of the box or wave corresponds to a number on the left side of the chart. For instance: Today, S-49 (or C-24) is 450 cfs; S-97 (or C-23 ) is around 350cfs; and S-99 (or C-25) is around 100 cfs.

(I know there are a duplicate gates sometimes but I ignore them and  just read  one. They seem to say the same thing.)

Now to add up the cfs for “today:”  C-23=350; C-24=450; C-44 at S-80 =260; S-308 from lake, 0. Today’s total incoming discharge water is around 1060 cfs cubic feet per second coming into the St Lucie River/Southern Indian River Lagoon.

Last week it was twice or three times this much. The discharges occur after it rains, long after and then finally slow down like they are now.

I do hope this has been helpful and that your head is not spinning or that you can save the links and instructions and try it when you have time. Call me if you have questions and want to learn, 772 486 3818.

It is important for the public to keep up with this and let the ACOE and SFWMD know we are watching what they are doing, so one day I don’t have to choke when I see the tab “Managing and “PROTECTING” water.

photo