It’s an honor to present:
“Florida’s Summer of Slime: Stuart and Lake Okeechobee,” photo essay by John Moran, August 2018
I reported last month on the plight of the Caloosahatchee River and its befouled waters flowing from Lake Okeechobee; delivering slime to waterfront neighborhoods in Fort Myers and Cape Coral along the way to the Gulf Islands of Southwest Florida.
Next up on our Summer of Slime photo tour is a visit to Stuart and Lake O… Stuart and environs is a glistening jewel born of water. It may well top the list of Florida cities in shoreline per capita. There’s simply water everywhere. Two forks of the St. Lucie River, the Indian River Lagoon, canals and peninsulas and islands, and the Atlantic Ocean beyond. Stuart is pictured above; below is neighboring Hutchinson Island.

 But it wasn’t Stuart’s reputation for abundant clean water that drew me south from Gainesville with my cameras. In effect, I’ve become a traveling crime scene photographer—and slime is the crime. A devastating outbreak of toxic algae has once again hit the St. Lucie River and the Treasure Coast, fueled by the polluted waters of Lake Okeechobee and the Kissimmee River basin to the north. Damaging headlines trumpet the story to the nation and the world and Governor Scott has declared a state of emergency. It’s déjà vu all over again.
 My hosts in Stuart were water blogger Jacqui Thurlow-Lippisch and her husband, Ed Lippisch.
 Ed took me up for a photo flight in his Piper Cub so I could get the big picture.
 Seen from a small plane at 500 feet, Florida is a beautiful place.
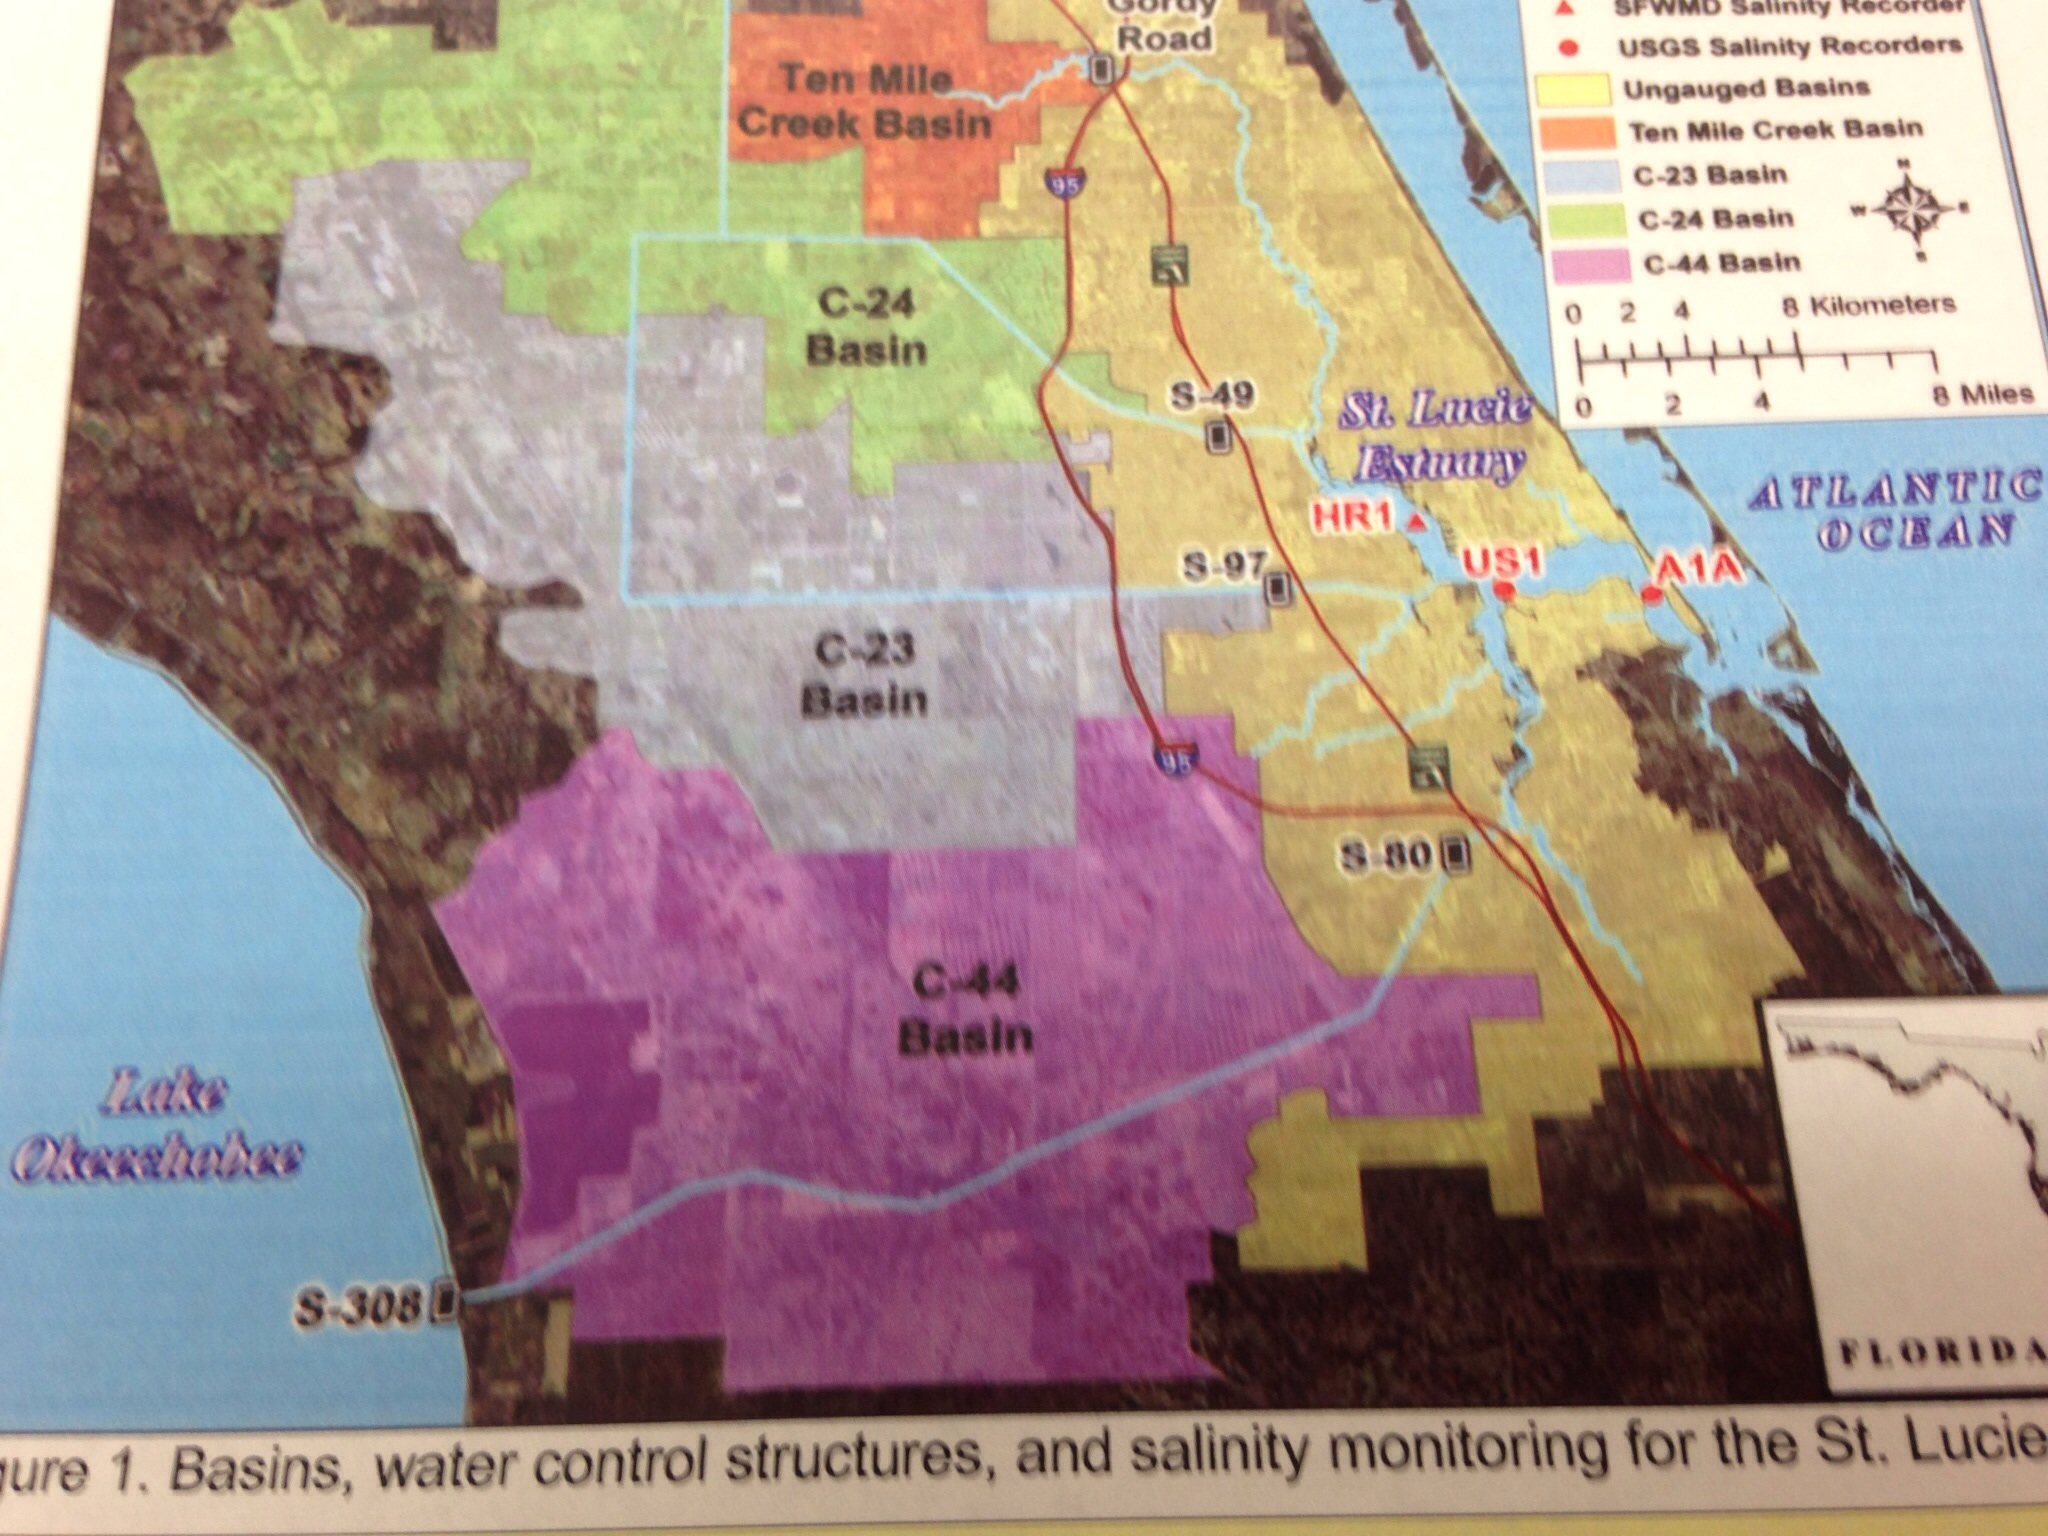
 Here’s Lake Okeechobee and the western terminus of the St. Lucie C-44 Canal. Administered by the U.S. Army Corps of Engineers, the Port Mayaca Lock and Dam has the capacity to discharge 14,800 cubic feet of water per second downstream to Stuart and the St. Lucie River Estuary, 26 miles away.
 Sugar industry representatives say the water coming out of Lake Okeechobee is not the problem and that the algae outbreak in Stuart is primarily caused by Stuart’s own septic tanks and urban stormwater. This claim is contradicted by the extensive algae mats seen along the C-44 Canal between the Port Mayaca and St. Lucie Locks, well upstream from Stuart.
 Lake Okeechobee historically drained south to Florida Bay, not east and west to the Atlantic and Gulf. The C-44 canal was built in 1916 to divert floodwaters to the coast.
 A view of the St. Lucie Lock and Dam, several miles southwest of Stuart. On the day of my photo flight in late July, the dam gates were closed, visibly holding back algae from flowing downstream. Look closely and you can see what some people call The Seven Gates of Hell.
 The St. Lucie Lock and Dam are an integral part of South Florida’s complex web of water management structures, born of an age when the Everglades was reviled as a watery wasteland and America was driven to drain it.
 Below the St. Lucie Lock and Dam, in Palm City and Stuart, you can still find waterfront homes untouched by the algae bloom. But that’s no consolation for the thousands of Martin County residents whose lives are in upheaval once again this summer. The familiar pattern of algae outbreaks is fueled by fertilizer, manure and urban sources of nutrient pollution, including septic tanks.
 All of this is compounded by denial and neglect by elected officials and agencies to whom we entrust the important work of environmental protection and public health.
 Jacqui Thurlow-Lippisch took me on a driving tour of the C-44 Canal from Stuart to enormous Lake O, which is more like a stormwater treatment pond than a biologically healthy lake. “There are toxic algae blooms across the globe, but only one place where the government dumps it on you: Florida,” she says.

 It’s not just the algae from Lake Okeechobee causing headaches along Florida’s east coast; the sheer volume of freshwater discharges is an environmental pollutant that overwhelms the estuary.
 The Lake O gunk visible in the satellite view, above, is shown in the detail photo below.

 Fishermen are still drawn to Port Mayaca. On the day we visited, I counted nine.
 Dinner in hand (speckled perch), Felix Gui, Jr. has been fishing Lake O for 30 years. “The algae doesn’t affect the fish,” he says. “They eat the same, algae or no algae, and I haven’t gotten sick.” Experts have warned against eating fish exposed to the algae.
 A Martin County Health Department sign at Port Mayaca warns against contact with the water but I saw no messaging about whether fish caught in these waters is safe to eat.
 Enroute home to Stuart, Jacqui and I stopped at deserted Timer Powers Park on the St. Lucie Canal in Indiantown.
 At the St. Lucie Lock, a surreal scene of impaired water, above, and a vortex of slime, below, waiting to be flushed downstream.

 A pair of jet-skiers signaled for the lock to be opened, and another pulse of algae-laden water is released towards Stuart and the coast.
 Wouldn’t want to anyway, thanks.
 Further downstream, the algae spreads…
 Nearing the coast, Rio Nature Park and the neighboring Central Marine in Stuart are slimed again. This was the epicenter of the infamous Treasure Coast algae outbreak of 2016.


 Reporter Tyler Treadway of TCPalm gathered a sample of the polluted water from a canal behind the offices of Florida Sportsman magazine in Stuart.
 Staff complaints of headaches, nausea and dizziness prompted Florida Sportsman publisher Blair Wickstrom to temporarily close the office in late July. “It smells like death,” he said.
 The Shepard Park boat ramp parking lot in Stuart was nearly empty on the day we visited.

 A man on a mission, Mike Knepper, above and below, posts videos on his Youtube channel documenting the degradation of natural Florida.
 “It’s totally unacceptable to me what we’re doing to this planet because we’re very rapidly destroying it,” Knepper says. “My children and grandchildren will be paying the price for all the bad decisions we’re making today. I want to be able to look them in the face and say, ‘I tried to make a difference.’”
 Dead-end canals along the St. Lucie River with their limited water exchange have been hardest hit by the toxic blue-green algae, which scientists refer to as cyanobacteria.
 A growing body of medical research links exposure to cyanobacteria with neurodegenerative diseases including Parkinson’s, ALS and Alzheimer’s. Google it.
 Meanwhile, we’re getting conflicting messages from officialdom. Martin County has erected signs warning against contact with the water but the Florida Dept. of Health website, under the heading How to Keep Your Family Safe While Enjoying Florida’s Water Ways, has this to say: “Cyanobacteria/ blue-green algae…are naturally occurring in Florida’s environment and are also found all over the world. They are part of a healthy ecosystem and help support a wide variety of aquatic life.” (http://www.floridahealth.gov/environmental-health/aquatic-toxins/cyanobacteria.html) In other words, Lighten up, Florida. This is just nature being natural.
 An open question remains: What will become of the value of the Florida brand when the world fully sees what we have done to our waters?
 Even in disaster, strange beauty emerges.
 Greg Fedele has lived in his water-front home since 1991. He grieves for his loss. “I have three kids who can’t enjoy the waterways of Martin County like I did growing up.”
 The sign at Ocean Blue Yacht Sales in Stuart echoes a wide swath of community sentiment. Asked to describe in a word how the algae outbreak has impacted his business, president Bryan Boyd replied, “Horrible. The last three years, our bay boat sales have been a third of what they used to be.”
 A roadside sign seen in Stuart in late July. If you’re wondering what you can do about the ongoing crisis of Florida waters, we are called to consider our own water footprint, learn about the issues and get involved. And never forget that elections have consequences. Vote for Clean Water. (https://www.bullsugar.org/#)

What we have here in Florida is not just a crisis of water, we have a crisis of democracy and civic engagement.
From the beleaguered springs of North Florida to the sickened rivers and coasts of South Florida, we must understand that no savior is waiting on the horizon who will fix this thing for us.
It took a group effort to create this mess and we need all hands on deck if are to reclaim our waters. Florida needs environmental patriots willing to face down politicians funded by wealthy interests who think nothing of sacrificing our public waters on the altar of their private profits.
We don’t have the luxury of time to get this right. We are losing our waters now. This is our moment. It’s time to set aside our differences and focus on what is at stake, for this is nothing less than a battle for the soul of Florida.
The pictures don’t lie. We the people of Florida bear witness today to nothing less than a crime against nature, and a crime against the children who shall inherit our natural legacy.
A long time ago, Florida political leaders—Republicans and Democrats in common cause—understood there can be no healthy economy without a healthy environment. They wisely enacted laws and regulatory safeguards accordingly.
But that was then and this is now. It’s time to end the popular fiction in Florida that we can plunder and pollute our way to prosperity.
Gov. Reubin Askew said it best when he declared in 1971, “Ecological destruction is nothing less than economic suicide.”
In this, our Summer of Slime, can I get an amen?
by John Moran
August 2018
web: http://johnmoranphoto.com
email: JohnMoranPhoto@gmail.com
cell: 352.514.7670
Feel free to forward or post this photo essay as you wish; attribution is appreciated. Please share this with elected officials and ask them: what’s their plan to clean up our waters?


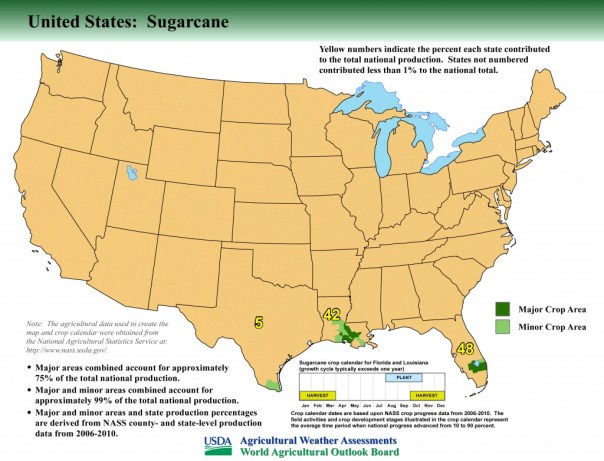
 Sugarcane and Indians