As I wrote about yesterday, Governor DeSantis’ Executive Order 19-12 calls for the Basin Management Action Plans around Lake Okeechobee to be “updated” by January 10, 2020.
Dr Goforth (http://www.garygoforth.net/Other%20projects.htm ) is a familiar and trusted friend in our fight to protect the St Lucie River/Indian River Lagoon. Today, I am sharing his comments made during the development of the Basin Management Action Plan for the St Lucie River; and also his easy to read charts presented at the June 10, 2019, SFWMD Northern Estuary Workshop. It is my hope, that my very oversimplified post from yesterday can be complemented by Dr. Goforth’s input.
From Dr. Gary Goforth, Ph.D
Subject: Estuary Water Quality Protection, July 8, 2019
Looking forward to a productive workshop on Wednesday…
2. Subject: RE: Estuary Water Quality Protection, July 12, 2019
Thank you for a very productive workshop Wednesday on water quality and its impacts to the northern estuaries.
I’ve been asked for copies of the documents I held up during my public comments. These were developed pursuant to the 2007 Northern Everglades and Estuary Protection Program (NEEPP), and were to serve as the technical foundation for an expanded Works of the District (Rule 40E-61) regulatory program administered by the SFWMD. These documents summarize the most comprehensive analyses of water quality and hydrology for the Lake Okeechobee and estuary watersheds. These were presented to DEP during the development of the BMAPs – but DEP chose not to take advantage of them. Even worse, prior SFWMD management worked with an agricultural lobbyist to remove all references to these documents from the 2015 SFWMD annual environmental report (“In 2014, South Florida water managers were on the verge of an agriculture pollution crackdown, but at the last minute reversed course. TCPalm obtained emails that show how a lobbyist influenced water policy. The South Florida Water Management District changed course immediately after a Dec. 3, 2014, meeting with U.S. Sugar Corp. lobbyist Irene Quincey, eventually halting its planned policy in favor of a plan that takes polluters at their word and holds no one accountable if water quality suffers.” http://www.tcpalm.com/story/news/investigations/2017/08/30/u-s-sugar-lobbyist-influence-over-florida-water-pollution-rules/464671001/).
They can be downloaded from the following links; I’m sure staff could provide hardcopies (they’re several hundred pages in length).
Executive Order 19-12 “What can we do to achieve more now for Florida’s Environment?”
Sometimes all the bureaucracy of water management makes it difficult to understand how things work. Today, I am going to summarize the goals and requirements of Governor DeSantis’ Executive Order 19-12 Section 1, C. in hopes of giving some simple insight into the responsibility of our state agencies to publicly come together to achieve the Governor’s goal; there are only six months remaining.
On January 10th, 2019, just days after being sworn into office, Governor DeSantis put forth Executive Order 19-12. This order has multiple components, but today, we will focus on Section 1, C:
It states: “Update and secure all restoration plans, within one year, for waterbodies impacting Soth Florida communities, including Lake Okeechobee, the Caloosahatchee, and the St Lucie Estuaries. These updates will ensure the Blue-Green Algae Task Force has the necessary information to provide guidance to the Department of Environmental Protection on maximizing the investments in water quality improvements.
This means that the Basin Management Actions Plans, the system the state uses to try to improve water quality through lessening phosphorus and or nitrogen runoff have to be “updated” by January 10, 2020.
Prior to the Governor’s Executive Order 19-12, there was no unified update date, nor a clear deadline date. Why? Because state statute doesn’t give one. How come? Because over the years special interest has lobbied our state legislature to make it this way. Governor DeSantis’ order complicates this by giving a hard deadline to find out how these BMAPS are working or not working.
An update is an “update on the status of implementation at the end of the first phase and an opportunity to provide recommendations for future phases of the BMAP.”
The three Basin Management Actions Plans that need to be updated include the Okeechobee BMAP; the St Lucie BMAP and the Caloosahatchee BMAP.
The agencies that oversee this process are the Department of Environmental Protection (regulation of water quality standards); the Dept of Agriculture and Consumer Services (BMPs or Best Management Practices); and the South Florida Water Management District (water quantity or “projects)
You will see as you read about these BMAPS they are more of a soft than hard science. These maps were developed to meet a “total maximum daily load” reduction of phosphorus and or nitrogen, overtime – like 20 or 30 years!
To do this, basins and stakeholders are identified, and best management practices for agriculture and other stakeholders are implemented. Then the Dept of Environmental Protection models how much the best management practice will help remove phosphorus and or nitrogen and a certain amount of credit is given for using the Best Management Practice.
It’s kind of like giving a grade based on participation instead of performance. It’s time to raise the bar. In order for the Blue-Green Algae Task Force to have the necessary information to provide guidance to the Department of Environmental Protection on maximizing the investments in water quality improvements,” we must truly know the numbers.
~Monitoring not Modeling!
P.S. Why are the three BMAPs together in the executive order? Lake O is discharged into the St Lucie River and Caloosahatchee so for them to meet their goals, Lake Okeechobee has to meet its goals. For now, we are all connected.
I am once again honored to share Dr. Goforth’s work:
Excerpt from: A Brief Discussion of Lake Okeechobee Pollution G. Goforth, PhD. 9/18/2018:
“For calendar year 2017, the phosphorus loading to the Lake Okeechobee approached 2.3 million pounds, the highest level ever recorded, and the 5-yr average phosphorus loading to the lake was more than 5 times the pollution allocation established for the watershed. This pollution target is called the “Total Maximum Daily Load” or “TMDL.” The result: an algae bloom covered 90 percent of the lake this summer (NOAA 2018).
In addition, the state’s annual “progress report” on efforts to reduce pollution of the lake underestimates the actual loading to the lake. For the last two years the FDEP has published reports indicating phosphorus loading to the lake has decreased – yet these claims conflict with the measured loads to the lake, e.g., the average load measured in 2017 was 60% higher than reported by FDEP…”
Gary Goforth PhD, http://garygoforth.net/, has more than 30 years of experience in water resources engineering, encompassing strategic planning, design, permitting, construction, operation and program management and is an outspoken advocate for the St Luice River/Indian River Lagoon.
Today I will try to provide some insights for every day people trying to figure out what a basin management action plan is, why we have one, and how we are doing so far….
Before we begin, we must first note that in 2002 the state of Florida declared the St Lucie River “impaired.” Impaired as in “its health”— with too much nitrogen and phosphorus and other pollutants from fertilizer and other sources that run off agricultural and developed lands…If you want, you can read the 2002 report below.
Today we hear more about BMAPs (Basin Management Action Plans) and TMDLS (Total Maximum Daily Loads) than the original impairment report, but we must be aware that the only reason we have a BMAP is because the river is “impaired.” A BMAP is put in place by the state to “fix” impaired water bodies.
Our Martin County/St Lucie St Lucie River (SLR) impairment is compounded by the fact that the watershed has been heavily altered over the past 100 years. The Everglades Agricultural Area (EAA) south of Lake Okeechobee blocks the natural flow of Lake O. water going south to the Everglades; therefore the “overflow” waters of Lake Okeechobee are released into the St Lucie.
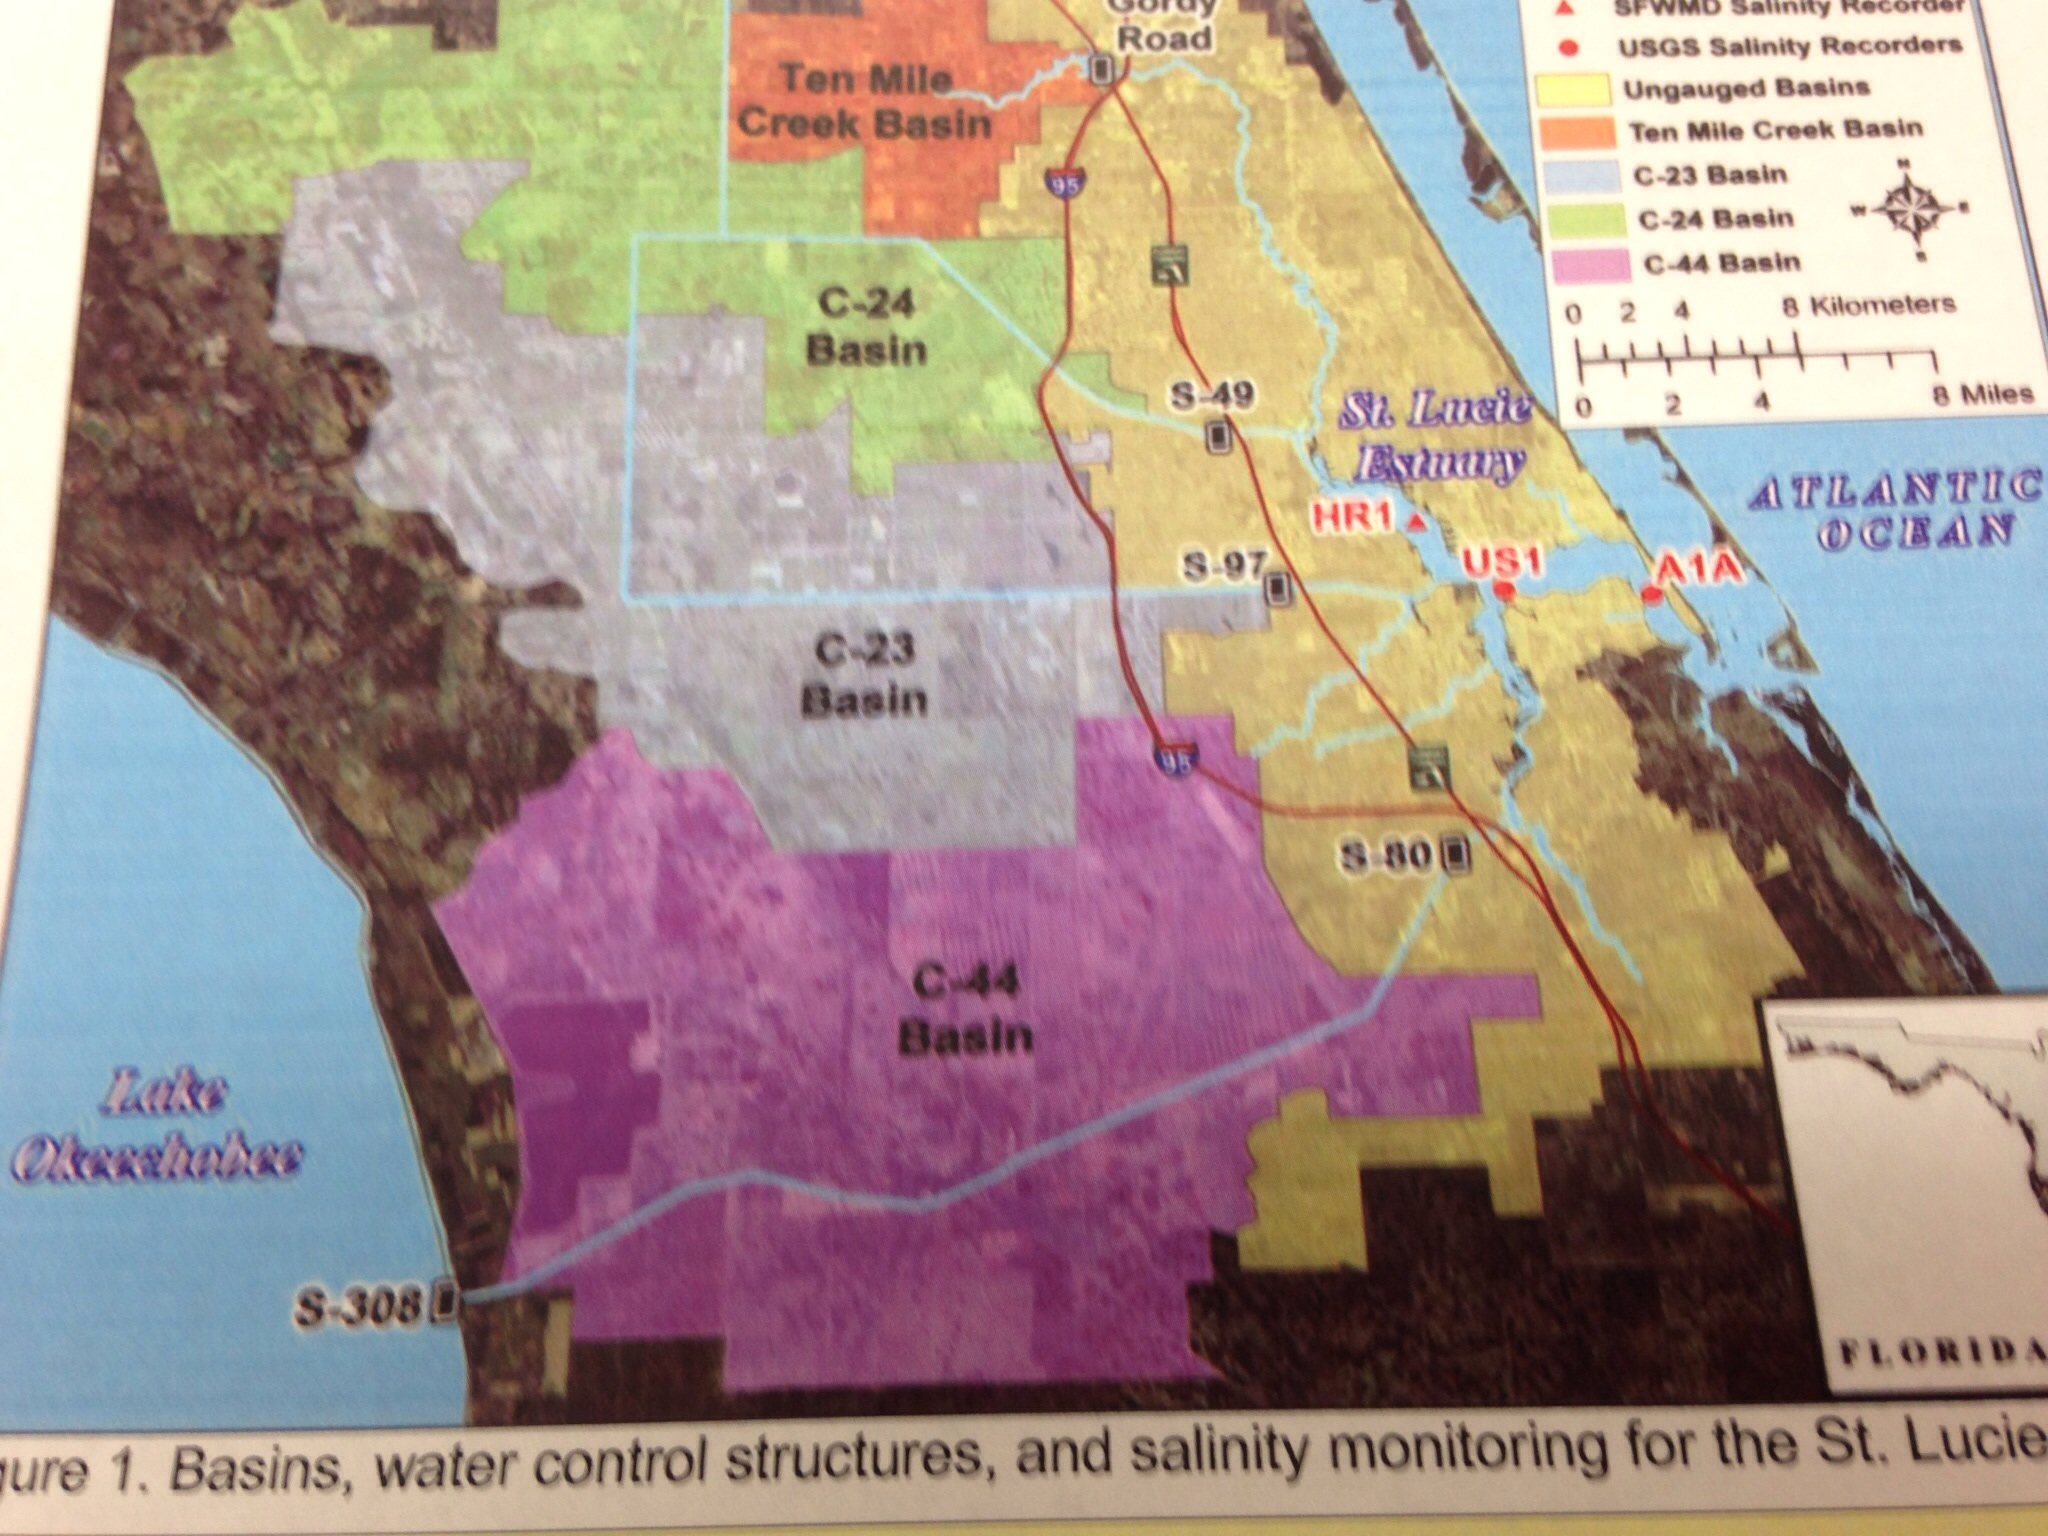
On top of that are canals C-23, C-24, C-25 that go way out west expanding the St Lucie River’s basin, draining parts of Okeechobee and St Lucie counties and even waters of the St John’s River that used to go north once located near Vero! Road runoff, marinas, agriculture, our yards, tributaries, non-functioning septic tanks, and other things all add up to create a pollution cocktail encouraging toxic algae blooms that kill seagrasses and wildlife and lower our property values for the entire area.
According to the St Lucie River Initiative our canals expanded the “flow” into the St Lucie River by as much as five times what Nature intended. See map below. The BMAP doesn’t really deal with this problem; it does not try to reroute these canals, it rather tries to “better the situation” we are in now as far as water inputs.
Drainage changes to the SLR. Green is the original watershed. Yellow and pink have been added since ca.1920. (St Lucie River Initiative’s Report to Congress 1994.)
So with that in mind, let’s get back to the state of Florida’s created Basin Management Action Plans implementing “total maximum daily loads” (TMDLs) for nitrogen and phosphorus. “Everyone” is part of lowering their loads to the river through building projects that help lower loads and implementing Best Management Practices for fertilizer etc…. Everyone in the basin that is. (Not Lake O- They have their own plan). Not everyone is an equal polluter but everyone tries to lower their load.
The stakeholders agreeing to do projects and implement Best Management Practices to lower their inputs are:
Agriculture
City of Fort Pierce
City of Port St. Lucie
City of Stuart
FDOT District
Hobe St. Lucie Conservancy District
Martin County
North St. Lucie River Water Control District (NSLRWCD) 10
Pal Mar WCD
St. Lucie County
Town of Sewall’s Point
Troup-Indiantown WCD
These stakeholders work together with the help of DEP, the Department of Environmental Protection, and others to lower their measured inputs of Nitrogen and Phosphorus into the river over a period of fifteen years, in five-year increments beginning in 2013. The draft report now is just reviewing the first two years of the first five years. We have a long way to go….
This slide of the summary report provides some overall insights. You can see the load originally compared to now and how far they have to go together to achieve the first increment.
DEP chart for SLR BMAP. (Draft 2015)
1.1 Summary of Accomplishments
Table 3 summarizes the projects completed during the second annual BMAP reporting period. These resulted in an estimated reduction of 118,163.3 lbs/yr of TN and 26,998.8 lbs/yr of TP. The reductions are in addition to those projects given credit before BMAP adoption. Therefore, the total reductions to date are 595,952.0 lbs/yr of TN and 157,540.8 lbs/yr of TP, which are greater than the required reductions in the first BMAP iteration of 316,024.2 lbs/yr of TN and 121,250 lbs/yr of TP. These reductions, in addition to those shown as completed in the BMAP, are 56.6% of the required TN reductions and 39.0% of the required TP reductions of the Phase I BMAP.
The progress towards the TMDL TN and TP load reductions in the St. Lucie River and Estuary Basin are shown in Figure 2 and Figure 3, respectively. The first bar in these figures shows the baseline load for stormwater runoff. The second bar shows the current estimated loading with the implementation of projects. The third bar shows the total allocation for stormwater runoff to meet the TMDLs. The line shows the target for the first BMAP iteration. (DRAFT REPORT)
____________________________________
So the St Lucie River BMAP is making “pretty good” progress according to the report. I imagine there is still a lot to improve. It is a process. We are learning….
These programs are definitely a major “participatory decision-making process” to be commended. I cannot imagine what it takes to coordinate this effort! It would be a nightmare actually. I rather just reroute the canals!
In closing we must note the Indian River Lagoon of which the St Lucie River is a tributary, has a BMAP, but it is for the central and northern lagoon not the southern lagoon where we are in Martin County. I don’t quite understand this. The river does not seem healthy in this area either.
Maybe one day soon the southern IRL will soon have its own BMAP too? A very complex process for two very sick rivers…A process we should all try to understand and help with too.(DEP BMAPS http://www.dep.state.fl.us/Water/watersheds/bmap.htm)
Florida BMAPs DEP.Close upList of Florida’s impaired water bodies and BMAPS.
*According to the Department of Environmental Protection: a BMAP is a “blueprint” for restoring impaired waters by reducing pollutant loadings to meet the allowable loadings established in a Total Maximum Daily Load (TMDL). It represents a comprehensive set of strategies–permit limits on wastewater facilities, urban and agricultural best management practices, conservation programs, financial assistance and revenue generating activities, etc.–designed to implement the pollutant reductions established by the TMDL. These broad-based plans are developed with local stakeholders–they rely on local input and local commitment–and they are adopted by Secretarial Order to be enforceable.
*Also for the first five years of the fifteen years the BMAP will take place, the stakeholders are getting extra credit because their SLR BMAP” credit includes storm water management strategies and projects that have been put in place since 2000 or will be implemented during the first five years of implementation June 2013-June 2018).”
I am adding a comment from Dr Gary Goforth to this blog post at 1:00 PM 8-13-15. I think his professional insights are helpful even to the lay person; he did attend the BMAP meeting yesterday; and he is a regular contributor to my blog. Thank you Gary. (http://garygoforth.net)
3-18-15 at 7:17 AM Gary Goforth commented on 2015 Annual Update, St Lucie River and Estuary Basin Management Action Plan, SLR/IRL
Inside cover of the Draft 2015 SLR BMAP Report. I …
Hi Jacqui
I am very familiar with the TMDLs and BMAP for the St. Lucie River Basin. I attended the BMAP progress meeting yesterday along with Mark Perry and others. There were nice updates by Diane Hughes and her counterpart in St Lucie County on construction and operation of what should be good, effective projects for reducing nutrient loads to the St. Lucie River and Estuary. It is clear that local communities and others are working hard to reduce nutrient loading.
However that’s where the good news ended.
While the progress report leads the public to believe that great strides have been made by landowners in cleaning up their stormwater pollution, unfortunately the BMAP process and progress reporting is seriously flawed and present an overly optimistic assessment of the region’s water quality, and the progress made towards achieving the desired endpoint. I expressed this opinion to FDEP, FDACS and SFWMD staff at the meeting yesterday, with the following support:
1. The nutrient loading data in the progress report are not real (measured data), rather they are a combination of potential load reduction estimates superimposed on simulated data. No where in the progress report will you find the observed amount of nitrogen or phosphorus that actually entered the St. Lucie River and Estuary during 2015. As was discussed at the meeting, FDEP does not plan to bring real data into the progress reports until 2017.
a. The real data show a very different story, for example, phosphorus loading from the C-44 Basin (excluding Lake releases) has increased more than 50% from the 1996-2005 Base Period.
b. Until real data are shown, there can be no assessment of how well the BMAP program is working, and no mid-stream corrections will be made.
c. The majority of load reductions are attributed to agricultural land uses as a result of BMPs. However, FDACS and FDEP staff acknowledged that they have not yet documented the actual effectiveness of any ag BMP in the region – they repeatedly stated they were short on staff.
2. The progress report (and the BMAP) ignores the nutrient and sediment load from Lake Okeechobee discharges. In the 2015 reporting period, the assessment ignores over 400,000 pounds of nitrogen and 47,000 pounds of phosphorus that entered the River and Estuary from the Lake. And don’t expect future reports to reflect this loading – the BMAP process will continue to ignore loading from Lake Okeechobee, assuming instead that the Lake will achieve its own TMDL (another sad subject altogether).
3. The nutrient loads for the BMAP base period are not the actual loads that occurred in each of the basins – instead it is a simulated load that differs up to 25 percent from the observed load. Without an accurate base period load, true progress cannot be assessed.
I could go on for a while; I made many more suggestions how to improve the process and will follow up with written comments to the FDEP.
Anyway, today I will once again to try to boil-down some fancy government terms to help you understand what our state is doing to try to fix the “impaired waters of the state…” such as our St Lucie River and Indian River Lagoon. I will focus on a report about “what is impeding its progress.” This report will be discussed at the Treasure Coast Regional Planning Council on 6-19-15.
“Impediments to Implementation of the Indian River Lagoon Basin Management Action Plans” by the East Central Florida Regional Planning Council and the Treasure Coast Regional Planning Council was prepared with technical assistance from the Florida Department of Economic Opportunity, 5-27-15.
For a full copy of this report please contact Mr Michael Busha at mbusha@tcrpc.org
Here we go:
The Background section of the report notes:” …In the past century the IRL has been affected by many activities including the creation of inlets, dredging of navigational channels, impoundment of mangroves for mosquito control, shoreline development, and alteration of the watershed basins draining into the lagoon. Today water quality the single most important issue impacting the lagoon. The decline in water quality is attributed to an increase in nutrient input, sedimentation, turbidity, atmospheric deposition, nutrient releases from legacy muck deposits, and changes in salinity due to freshwater discharges. The issue is complex because the impact comes from a variety of sources, including non point sources of stromwater entering the lagoon through major canals systems as well as through smaller creeks, tributaries, and individual outfall structures.”
State BMAP 2015. TCRPC
Here I must state something not noted in the report in case you don’t know: Not until a water body is declared as “impaired” does it get the help of the state creating a Basin Management Action Plan through the implementation of TMDLs—-or the determination of Total Maximum Daily Loads.
I wrote something in the past about this and likened a “total maximum daily load” to a “maximum daily allowance of cigarettes that one is allowed to smoke before one gets cancer…..a “total daily maximum daily load” of phosphorus and or nitrogen is what the government is talking about with the river. How much it can take before it gets sick/impaired.
Phosphorus and nitrogen come from different sources; I always note fertilizer as an example because it is written right there on the bag, and fertilizer from farming and people’s yards is a huge source of the LOAD of phosphorus and nitrogen going into our St Lucie River/Indian River Lagoon….
Right now all our water bodies get too much nutrient pollution (too many cigarettes) so now the government is figuring out how to cut back slowly over time….the problem is the river may die while we are “trying to kick the habit…”
Now, back to the official document: There are currently 20 adopted BMAPs in Florida. Portions of the IRL are addressed by four of the adopted BMAPs. They are North IRL; Banana River: Central IRL; St Lucie River and Estuary.
IRL BMAPs 2015.
Each plan varies but has the same goal: to lessen nutrient pollution, to improve water quality, and whether the plan says it or not, to increase sea grasses….The plans outline specific project that are expected to provide load reductions of phosphorus and nitrogen. All plans are implemented in 5 year periods spread out over 15 years. Plans can be many things, turning dirt, holding water, implementing best management practices not to allow runoff….
Polluted runoff causes impairment…
The St Lucie River was determined as “impaired” in 2002. (Report at end of blog.)
The SLR/IRL BMAP was adopted in 2013. So to figure out how this plan will work….in 2018 the state will have a goal for load reduction; then again in 2023; and then again in 2028. Each time period the load numbers should be going down, and if they are not, cities, counties, and other stakeholders, like agriculture, and other polluters, should be in trouble if there is not a reduction in loads. DEP oversees all of this.
Kind of confusing isn’t it? And I am not sure my dates are correct, but hopefully you get the idea….Perfect science? No. But at least there is a plan…I just wish they’d get us off the cigarettes faster. Like make us go “cold turkey.”
The report list the following impediments the BMAPs.
1. Inadequate Funding….
2. Nutrient Load from Muck not Addressed. (Muck holds nutrients so when it get stirred up from winds or storms it is “re-released…” (Second hand smoke….)
3. Nutrient Loads from ground water are not being addressed. (Groundwater comes up from the ground as tides rise and bring nutrients like from septic tanks into the river and lagoon—gross.)
4. No Incentive for Stormwater Management. I am not really sure about this one but obviously it has to do with incentives; seems like the government could help create incentives if we would reward clean water….(inventions, lessen people’s taxes if they achieve clean water “loads.”) Hey doesn’t the Dept of Economic Opportunity do stuff like this?
5. Incomplete water quality data. Collecting data is expensive. Maybe high school kids could get credit if they did it…..and let’s face it: WE KNOW the WATER’S DIRTY. Focus on the source and stop acting like we don’t know where all this nutrient pollution is coming from!
6. Inadequate Water Quality Monitoring. Same thing as above. Figure it out. Guess….
7. Unequal treatment of public and private entities, agriculture, and water control. This is complicated, but basically in my opinion the Right to Farm Act puts less stringent standards on agriculture to prove they are lessening loads than on municipalities and counties. BMPs vs NPDS (Best Management Practices vs. National Pollutant Discharge Elimination System…)This is a huge problem. Ag has to enter the 21st century. All ag. Best Management Practices are “voluntary.” This is not enough!
8. Onerous conditions attached to BMAP projects
9. Inadequate technology to meet TMDL goals
10. BMAPS are based on flawed TMDLs
11. Trends in nutrient loading from atmosphere not being considered. (Phosphorus and nitrogen come in from rains and winds from as far away as the Europe, Africa and other nations polluting too…
12. Legacy Loading in Lake Okeechobee. THIS IS MY FAVORITE. How can surrounding governments and stakeholders be held responsible for lowering loads when periodic releases from Lake O through the C-44 canal pollute the water as fast as we can clean it up? For instance this year the ACOE and SFWMD have released into the estuary since January 16th and just stopped three weeks ago…MAJOR SECOND HAND SMOKE!!!!!!
13. Lack of Operations Monitoring
14. Load allocation process is not consistent between BMAPs. This has to do with undeveloped land being removed from the maps as nutrient reductions are not required on those lands…
There is a lot more to the report but that is a summary.
This whole process of BMAPS and TMDLs is confusing, but I wanted to at least give you an idea of the report. We must remember not to be too negative for the state workers implementing the BMAP. Negativity will not inspire more work, it will inspire less. Also it is not their fault. Fault lies in leadership.
Rather that telling businesses, citizens, and most of all agriculture to QUIT SMOKING, leadership —-and this is going back many years and includes Democrats and Republicans—is basically paying for our rehab over a period of 15 to 35 years.
Florida’s waters do not have time for rehab. They must be fixed today. Tough love is really the only answer.
Secretary Hershel Vinyard, of the DEP, fields questions from river activist Benjamin D’Avano about a toxic SLR/IRL, “TMDL Celebration” Downtown Stuart, 2013.
Right before Thanksgiving, I heard the news, “Secretary Hershel Vinyard announced he is retiring from the Department of Environmental Protection….”
Even though there were many times over the past few years, that I felt like the DEP was not doing its job, and that the Scott administration had “demoralized” the agency, I felt saddened to hear this news….
Why? Because Hershel Vinyard was someone who went out of his way to build relationships in Martin County. Who will I call now? Clifford Wilson, the 35-year-old interim Secretary for the DEP? Don’t think he’d recognize my name and maybe not even be that familiar with the problems facing the St Lucie River/Indian River Lagoon…
Clifford Wilson, interim Secretary for the DEP.
After thinking for a while, an image came to mind of the first time I saw Secretary Vinyard deal with an angry public. He did a good job and from that moment on I liked him.
I have to say that Secretary Vinyard did a good job handling an angry crowd and over time I came to know him and appreciated that he took the time to visit Stuart on many occasions and learn the history and polluted plight of the St Lucie River and Indian River Lagoon. He would listen. He helped bring Governor Scott here to see the river. He saw how much we cared and responded even though he could not single-handedly fix the situation. Martin County is not known for getting much attention–I am appreciative that it was given…you can’t start changing things until those in power know who you are.
Group shot, Town of Sewall’s Point Commissioner, Jacqui Thurlow-Lippisch; Stuart Former mayor and Commissioner, Jeff Krauskoph; SFWMD Board Member, Kevin Powers, DEP Secretary Hershel Vinyard; SLC Commissioner, Chris Dzadovsky ; Martin County Commissioner, Ed Fielding; River Kidz member, Mary Thurlow, 2013.Speakers talk about the clean up of the SLR, 2013.Mary, Secretary Vinyard and me, 2013.
One time, when I emailed the Secretary about the SLR/IRL, I made the mistake of writing “Secretary Walker…” as in “Hershel Walker,” a very famous Georgia football player from my era who tortured the Florida Gators. As always, Mr Vinyard was a gentlemen and did not make me feel like an idiot.
In spite of people or parties we “like or dislike,” we must remember that it is relationships that will help heal the St Lucie River/Indian River Lagoon, and these must be built with whomever is in office. And although it may have been political, Secretary Vinyard was on the Army Corp of Engineer Calls at the end of this summer asking the agencies NOT TO RELEASE LAKE OKEECHOBEE WATER THROUGH S-308 into the St Lucie River/Indian River Lagoon. I will never forget these words….this is progress.
Yes, I am thankful for the times Secretary Vinyard took an interest in Martin County and since he resigned Thanksgiving week, I want to mention this. I hope that the next person who takes the position of Secretary of the DEP comes to know the St Lucie River/Indian River Lagoon too. We are entering a critical time with the possibilities of land acquisition in the Everglades Agricultural Area though Amendment 1; it’s a lot easier to work this with people we know or knew…
Something the every day person may not know because the communication feedback loop between state agencies and the public doesn’t really function, is that in 2002, the Department of Environmental Protection, a state agency, declared the St Lucie River, part of the southern Indian River Lagoon, “impaired.”
The 2002 report reads: “Anthropogenic impacts to the St Lucie River have impaired its function as an important estuarine ecosystem and resource. Stream channelization, wetland drainage, conversion, construction of drainage canal systems, urbanization, and agriculture activity have so completely modified the watershed that it can no longer function as a healthy ecosystem…although it was once one of the most productive in the world…” (http://www.dep.state.fl.us/southeast/ecosum/ecosums/SLE_Impairment_Narrative_ver_3.7.pdf)
A tremendously loss to say the least. Why did we have to wait until it was dead to do something?
Unfortunately that is the case, so what’s important to know now about this “impaired” status is that it triggered a program to help the water body called a Basin Management Action Plan (BMAP) and Total Maximum Daily Loads, (TMDLs).
You may have heard of them.
So now that the water body is impaired, there is an action plan for the water basins limiting the total maximum daily loads of nitrogen and phosphorus that flow into the estuary.
Municipalities and counties will be held eventually responsible for the maximum levels of pollutants allowed to enter the water before the water would become “impaired.”
This gets confusing, I know. I think of it like this: how many cigarettes one is allowed to smoke before one is on the verge of dying of cancer…your total maximum daily smoke, before you become “impaired.” But what if you been smoking a pack a day for 80 years? Is there time to cut back? Shouldn’t you just quit?
Crazy isn’t it?
The real catch for the St Lucie River is that much of the water that runs into the river is from Lake Okeechobee through C-44. So even if the St Lucie met its TMDLs they would be destroyed by releases from Lake O.
The state is working on this problem and many others. This might take awhile to fix. They are figuring 5, 15, and 30 year implementations before they can really measure improvements…
Time is of the essence, but this is the best the state can do.
Hmmm…I’m not a smoker but I am so frustrated, I think I’ll go have a cigarette.


 Dr Gary Goforth