Monthly Archives: July 2014

Historic Descriptions of “Indian River Country,” Sewall’s Point-1891, St Lucie River/Indian River Lagoon

Sunset photo, oak hammock, Sewall's Point, 2011. (Photo by Jacqui Thurlow-Lippisch)
St Lucie River sunset photo, oak hammock, Sewall’s Point, 2008. (Photo by Jacqui Thurlow-Lippisch.)

History is a window, a  window into understanding why and where we are today. The Town of Sewall’s Point along the St Lucie River/Indian River Lagoon has some of the most wonderful historical descriptions of its original beauty, and I believe that is why we try so hard as a town to keep remnants of that historic beauty today.

The town is a “Tree City;” a bird sanctuary; and there are very strict fines for cutting down trees with over a two inch across  trunk.  Development rules are supposed to be protective of wooded uplands and wetlands, sometimes this does not seem to be the case.

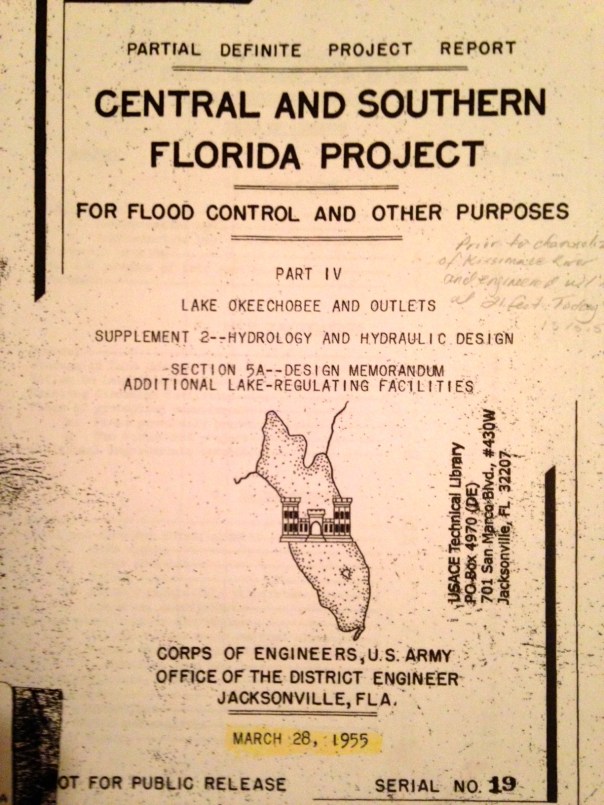
Nevertheless, today I will quote from a “Description of Indian River County,” as it was called, from a Maine Journal , The East Coast Advocate, April 24, 1891 by Rufus King Sewall. This document was transcribed by my mother, historian Sandra Henderson Thurlow in 2009.

Here we go and remember 1891 was the year before the St Lucie Inlet was opened permanently so the river waters were fresher..

_____________________________

“At the Indian River Hotel, Titusville, we lodged for the night and were lulled with the song of two mosquitoes…at 5 a.m. the Indian River steamers called for embarkation south-bound and all aboard, most comfortable quarters in neat staterooms, spacious saloon and good service are found… The banks of the Indian River are general sops-wood, of cabbage palm, pine and cactus—uncleared because used as a screen against the fierce east winds which whip the orange and banana to death…Fine oysters, big trout, mullet, pompano, with channel bass abound…

The climate is the great charm of travel in the region. Within an hour of Titusville, the heavy, hot depressing , suffocating atmosphere of the interior of Florida suddenly changes to soft exhilarating, and cool refreshing inhalations, which the lungs expand to draw in with gateful sensation.

Cover of book "Sewall's Point," Sandra Henderson Thurlow. Sewall's Point Post Office last 18002.
Cover of book “Sewall’s Point,” Sandra Henderson Thurlow. Sewall’s Point Post Office late 1800s.

It was 2 a.m. when the whistles sounded for San Lucie Landing at Sewall’s Point starting to wing acres of and acres of sleeping ducks whirring, splashing and diving, in dismay, before the lights of the rushing steamer and we rested on shore, while the St Sebastian turned toward Jupiter below. The river scene and surroundings were enchanting , sea and shore burnished with tinted rays of a sunrise and indescribably grand and novel.  The ducks had grouped in shoals on their feeding grounds.

Fish were leaping in the light and the hum of her life stirred the evergreen prospective with a marked absence of bird song. In the east across the sound tree miles away, over Gilbert’s Bar, the broad ocean stretched beyond sight, the pathway of big ships southward bound clear to the naked eye. In front, Mangrove Islands bounded the horizon whose channel fretted the outgoing tides of Jupiter Narrows. Northward and west the broad reaches and pitch-pine plains of the deep and wide San Lucia shut off vision.

Underfoot and around the rock-bound bluff of the Peninsula of Sewall’s point in gorgeous green and gold, of satin-wood, oak, palmetto and rubber forest trees dazed the eye.

All strange and primitive with novel tropical surroundings out of reach the peninsula separating the Indian and San Lucie waters is a  rockbound elevated ridge with bluff frontage on San Lucie shores in L. N. 27 degrees 15 min.

It is crowned with tall  grown palmettos with tufted  tops of palm leaves, naked branchless stems like the mast of a ship.

The water is pure and good…The largest trout I ever saw abound and shoals of mullet.

Sharks and alligators abound in the waters, and turkeys, bear and deer on shore in their season. In the creek opposite Point Manatee the fishermen linger with nets and gun to catch the sea-cow as they feed along the shore….”

The airs and winds are soft and balmy expect the northwest, refreshing, grateful to the lungs with wonderful healing properties and purifying effect exciting to outdoor activity and stimulating to vital forces…The entire atmosphere environment pregnant with healing…

_____________________

Interesting. Like poetry but for me “disturbing” as it talked about people hunting manatees. This at least highlights how we have changed historically, as manatee are protected today.

Sewall's Point, photo by Ed Lippisch, 2011.
Sewall’s Point, photo by Ed Lippisch, 2011.

I hope you enjoyed that reading….

It was a beautiful world, there for the taking and we have taken it. For better or for worse we have. Let’s remember our history and that no matter what this place, this St Lucie River/Indian River Lagoon is today, it has always been “a place of beauty.”

May we revive her waters and her shores in respect to that which created this sacred place,  and for those who have loved and documented her before us. Thank you Rufus King Sewall. 

How Can We Know How Much Water the ACOE/SFWMD are Sending South or to the St Lucie River/Indian River Lagoon?

System Status Update is a presentation slide from the ACOE periodic scientist calls. It shows how much water is going east/west and south to the Everglades.
System Status Update is a presentation slide from the ACOE periodic scientist calls. It shows how much water is going east/west and south, in this slide, from the Everglades Agricultural Area (EAA) to the Everglades.

Today I am going to share an entire 25 piece slide presentation from the Army Corp of Engineers’ Periodic Scientists Call, 7-25-14. It’s a lot of slides, but I think you’ll enjoy trying to interpret them, and I’ll help the best I can. These presentations include a lot of information and show how the ACOE decides how much Lake Okeechobee water is going to go the estuaries, south, to the Everglades, and held, or released, to other places.  This information is UNCLASSIFIED so I can share it.

I first was invited to sit in on these calls in 2012, as I was former mayor and continued commissioner, as today, for the Town of Sewall’s Point. I have talked about this before in my blog but I will restate. I felt like a complete idiot for the first  six months as the ACOE kind of speaks in their own language. A military language.

Eventually, I started to catch on, and even gained the confidence to comment. Although not a scientist, as an elected official I am allowed to give succinct perspective.

These calls take place approximately every two weeks depending on the circumstances. During the terrible 2013 releases from Lake Okeechobee into the St Lucie River/Indian River Lagoon and the Caloosahatchee, calls took place every week.  “Stakeholders” from the lakes south of Orlando to the  Everglades participate in these calls. Representatives from agriculture, the state agencies, counties and others are present.

Here is the entire presentation from the last call on July 25, 2014.

7-25-14 Periodic Scientists Call, ACOE. UNCLASSIFIED.

In the slides one sees weather outlooks; inflows/outflows (west, east, south) from Lake Okeechobee and/or the southern flow of water from the EAA or Storm Water Treatment Areas into the Water Conservation Areas and Everglades;  position/historical analysis of water levels in the lake; Lake Okeechobee Regulation Schedule (LORS) guidance for releases; estuary salinities; basin and lake runoff/releases into the estuaries; ongoing emergency storage of water…

In all honesty, it’s a lot for me. I mostly pay attention to the level of Lake Okeechobee and how much they may or may not decide to release into the St Lucie River/IRL. Here the LORS guidance said they could release 1170 cfs cubic feet per second into the SLR/IRL but the ACOE chose not to. Yes, many times the ACOE actually cuts us a break. But when the lake is really high, over 15 feet or so,  there is no break.

I also pay more attention to how much water is going south, as this would help alleviate our situation. It appears to me that usually the water “going south” is from the Everglades Agricultural Area (EAA), not from the lake, as in this presentation, the canals just south of the lake are not noted or say “0.” Understandably, the agriculture people like to hold the water in the lake, in case a drought comes, as they need water for their crops.

I will never interpret these calls like a scientist and some the scientist may cringe when I make my non-scientific statements. But that’s OK. I am “trying.”

I think the ACOE and shared South Florida Water Management District (SFWMD) slides have gotten better and show more information than when I first started attending. I think they know the people and some politicians of Martin and St Lucie Counties, really all over the state now,  are watching like hawks and demanding more disclosure and transparency in how the ACOE and SFWMD decide to manage Lake Okeechobee and surrounding areas.

I do hope you find this information interesting and not overwhelming. You can find some of it on the ACOE Facebook page (Jacksonville District, U.S. Army Corps of Engineers) or on their website (http://www.saj.usace.army.mil).

(http://w3.saj.usace.army.mil/h2o/reports.htm) is also a great website but very technical.

Personally, I still find the info for the SLR/IRL hard to find. I wish the ACOE  would devote a special area on their website to us like the SRWMD has because the more we as citizens can easily learn and pay attention, the better chance we have, one day, for a healthier St Lucie River Indian River Lagoon for our children.  

IMG_6991 IMG_6992 IMG_6993 IMG_6994 IMG_6995 IMG_6996 IMG_6997 IMG_6998 IMG_6999 IMG_7001 IMG_7002 IMG_7003 IMG_7004 IMG_7005 IMG_7006 IMG_7007 IMG_7008 IMG_7009 IMG_7010 IMG_7011 IMG_7012 IMG_7013 IMG_7014 IMG_7015 

The History, the Future, of Plan 6 and “Sending Water South,” St Lucie River/Indian River Lagoon


plan 6 prototype
Map for the “Performance Configuration” co-authored in 2009, incorporating Plan 6 ideas for sending more water south.

First thank you to Dr Gary Goforth for providing much of this historical data.(http://garygoforth.net)

There is a lot of controversy surrounding the idea of “sending water south,” mostly because in order to do so privately owned lands would be taken out of sugar productivity. This post is meant to share some of the history of ideas over the years to do so, not debate it.

As we all know, before the lands south of Lake Okeechobee were drained for the budding agriculture industry in the late 1800s onward, when Lake Okeechobee overflowed, ever so gently its waters ran over the southern lip of the lake through a pond apple forest, creating a “river of grass” that became the Everglades.

In the 1920s at the direction of Congress and the State of Florida the Army Corp of Engineers (ACOE) redirected these overflow waters that had functioned as such for thousands of years through canals C-44 to the St Lucie River and C-43 to the Caloosahatchee.

This achieved better flood control for agriculture and development but has caused an environmental disaster for the northern estuaries and for the Everglades.

The environmental destruction and safety issues of the Herbert Hoover Dike were noted early on.  As far as the destruction of a local industry, the fishing industry in the St Lucie River was the poster child.  This and many other reasons caused many people over the years to seeks “improvements,” to the  overall ecological system.

One of the first was the 1955 ACOE Central and Southern Florida Project Part IV. It was a proposal evaluating different options (plans) for “increasing lake outlet capacity.  One component was “Plan 6,” a one mile wide floodway extending from the Herbert Hoover Dike to one mile into Water Conservation Area 3. For this report, Plan 6  was  the recommended improvement.  Dr Gary Goforth notes discharges to the St Lucie would have been lessened about by half,  but “not eliminate lake discharges to the St Lucie River.” In the end, the entire plan was not acted upon as many tax payer paid plans are not…but Plan 6 was not forgotten…

photo 1
Photos taken of 1955 ACOE CSFP Report courtesy of Dr Gary Goforth.
photo 5
Floodway 1955

photo 3 photo 2

Various references to Plan 6 and a floodway.

Dr Goforth also notes a “more robust plan,”a plan co-authored in 2009 by Karl Wickstrum, Paul Gray, Maggy Hurchalla, Tom Van Lent, Mark Oncavgne, Cynthia Interlandi, and Jennifer Nelson. (See first photo in this blog.) This plan is referenced by Mark Perry in his well known “River of Grass” presentation.

Plan 6
Mark Perry’s drawing in his presentation for “River of Grass,”used today, 2014.

photo 1

The Art Marshal Foundation (Art was one of the great conservationist of the early 1960/70s environmental movement and has a wildlife preserve named after him) also notes in their literature that Plan 6 is traceable to the Marshall Plan-1981.

marshall
“Marshall Plan 1981 to Repair the Everglades, Why Plan 6 Will Work.” Marshall Foundation publication 2013, Version 2.2.

Most recently in 2013, the Rivers Coalition published on its website “Plan 6 Flowway, River of Grass, Missing Link.”

photo 2

Rivers Coalition Plan 6, the Missing Link, River of Grass, 2013.
Rivers Coalition Plan 6, the Missing Link, River of Grass, 2013 (http://riverscoalition.org/the-solution/)

You can learn more about this version of the plan by clicking on the above link.

All of these plans, I believe, are one way or another based upon the 1955 ACOE Report. it may not have come to fruition but it certainly provided a lot of inspiration!

Also last year, Senator Joe Negron was able to secure $250,000 for a University of Florida study that should occur in 2014 for “Sending more water south.” Wonder what their plan will recommend?

If history repeats itself, even more Plan 6 versions will be created. In any case, let’s keep pushing for change to save the estuaries and find some way to move more water south. And thank you Army Corp of Engineers for the inspiration…


Do the ACOE and SFWMD Release Toxic Lake O Water Into the St Lucie River/Indian River Lagoon?

Paint colored shocking green algae at the gate entering Lake Okeechobee,     2009. (Photo from video by Jacqui thurlow-Lippisch)
Paint colored shocking green algae at the gate entering Lake Okeechobee, 2009. (Photo from video by Jacqui Thurlow-Lippisch.)

I am well aware that the St Lucie River and Indian River Lagoon have location specific e. coli bacteria problems, as well as “overall water quality problems,” due to our local canals. This summer has been a great example of such with our SLR/IRL waters colored putrid brown all the way to the St Lucie Inlet just from releases from C-44, C-23, and C-24 canal basin runoff releases.

This is why it is beyond my comprehension, that with such terrible local water issues, our state and federal agencies can legally and in good conscious, “if necessary,” on behalf of flood control, release more nutrient, sediment filled waters into our SLR/IRL through Lake Okeechobee when they know that those waters often contain Microcystis Aeruginoas, a cyanobacteria that can produce health threatening toxins through its blue-green algae blooms.(http://www.doh.wa.gov/CommunityandEnvironment/Contaminants/BlueGreenAlgae.aspx)

Various SLR 2013 photos of cynanobacteria. Bob Voisenet, Mary Radabaugh, Jenny Flaugh, Douglas Ashley.)
Various 2013 SLR photos of  microcystis aeruginoas, cynanobacteria. (Bob Voisenet, Mary Radabaugh, Jenny Flaugh, Douglas Ashley, Gary Hendry.)

photo

photo

photo 1

In 2013, the Martin County Health Department, through spokesperson, Bob Washam, urged residents to avoid contact with the algae in the entire estuary from the St Lucie Canal to the St Lucie Inlet. Luckily with our local, “yuk” releases, we have not had that situation occur yet in 2014.

I have had two personal experiences witnessing these blue-green blooms. The first was during a boat ride into Lake Okeechobee, September 5, 2009, and the second was last year (2013)  with the Everglades Foundation team, at the St Lucie Locks and Dam when the ACOE was releasing. As we walked over the gates,  I clearly saw bright blue-green algae on the side of the dam allowing in Lake O water. Believe it or not, the SRWMD was testing the water right there… Mark Perry from Florida Oceanographic was with me and I ask him:

“Mark, is that “toxic” blue-green algae?”

Mark replied:

“Yes, blue-green algae can be toxic is most prevalent in fresh water systems. It is often in the lake.”

“And they are releasing it into our river?!”

I stood there in a daze….amazed.

Then I recalled the boat trip I had taken with my husband and dogs in 2009,  and how we had seen the blue-green algae clearly along the edges of the locks while going into the lake and I had videotaped it.  I am including some photos I took of that video below.

photo 5 photo 2 photo 3 photo 4

boat ride

When Senator Rubio visited  Stuart on behalf of the SLR/IRL, I told this story….I have told it many times at many official meetings to no avail. I think it a significant issue. Anyway…

So far this year, with the releases from our local canals, toxic algae, or Cyanobacteria, has not been reported in the SLR/IRL. It could be in the future, but it is less likely than when the ACOE is releasing from the lake. Why? Because often when they release from the lake it is TREMENDOUS amounts of freshwater, even more than comes from our local canals. Plus the blue-green algae is already in the lake as its fresh.

According to Bob Washam, blue-green algae was first reported around 1995 and it was blue! They thought it was a paint spill. The outbreaks have been more common since this time the worst being in 1998. Whether blue or green in color, it is bright. Very bright. You can see it.

How could our government, in essence, “poison its own people,” and how can we allow this, especially when we can see it?

We must push our government for change. Health, safety and welfare is something we rightfully deserve. Send the water south. 

_________________________________

Army Corp of Engineers (http://www.usace.army.mil)
South Florid aWater Management District (http://www.bing.com/search?q=south+florida+water+management+district&form=APMCS1)

83 Years of Asking the State and Federal Governments to “Close the Gates,” St Lucie River/Indian River Lagoon

South Florida Developer headline 1931, "Locks in Canal Closed; Fishing to be Benefited. (Newspaper courtesy of historian Sandra Thurlow.)
South Florida Developer headline 1931, “Locks in Canal Closed; Fishing to be Benefited. (Newspaper courtesy of historian Sandra Thurlow.)
Written minutes from a Martin County Commission meeting in 1931 asking  the ACOE to close the locks and  the importance to its citizens.  (Photo Martin County archives.)
Written minutes from a Martin County Commission meeting in 1931 asking the state to close the locks, mentioning  destruction to the river, and the importance to fishing industry. (Photo Martin County archives.)

The St Lucie Canal connecting Lake Okeechobee to the St Lucie River was constructed at the request of the state of Florida, the US Federal Government, and the local Martin County Chamber of Commerce, by the Army Corp of Engineers from 1915-1928. As this antique newspaper article of the Florida Developer above shows, by 1931 the Martin County Commission was already asking the state of Florida to close the gates and reporting clear evidence of the destruction of the St Lucie River/Indian River Lagoon.

I must thank my mother, historian Sandra Thurlow, for sharing this information and the photos in this post. She transcribed the 1931 article from the Florida Developer, a Stuart paper of the era. It reads:

South Florida Developer, November 6,

1931, LOCKS IN CANAL CLOSED; FISHING TO BE BENEFITED

Job of Checking Water Movement Was Completed Saturday TO KILL HYACINTHS; Fishermen Look For Decidedly Good Fishing the Winter

The east locks of the St Lucie Canal were closed Saturday, after being open nearly two years. In that time the level of Lake Okeechobee has been reduced from 18 to 14 feet. 

The work of closing the locks began Friday morning under  the direction of engineers for the Okeechobee Flood Control District. When they finished the job Saturday night, water continued to pour over the dam about as fast as before, in spite of the fact that the level of the canal had been raised 7 feet. 

This morning the crew went to the west end of the St Lucie Canal to close the locks there and thus check the flow of water from the Lake. 

The closing of these locks is regarded as highly important to the people of Stuart and adjacent communities, primarily because  as long as they remain open, the ingress of water from the Lake made the St. Lucie River fresh, driving out the salt water fish and bringing in hyacinths. With the water cut off from the Lake, it is expected that the St Lucie River will again become salt and this should bring back the fish and kill the hyacinths. Fisherman say it will take about 30 days for the effects of the is change in water to be felt, but they are exultant that this change had come about in time to promote good fishing in local waters.  

The minutes from the Martin County Commission meeting in 1931 also shown above are a bit harsher. The minutes state:

Be it resolved that the Board of County Commissioners herby instruct the Clerk to write the Trustee of the Internal Improvement Fund petitioning that they closed the gates at the Lake end of the St Lucie Canal until April 15, 1931, for the reason that the constant  discharge of a large volume of dirty fresh water into the St Lucie River has killed all the shell-fish, driven out salt water fish from the river, filled the river with hyacinth and polluted the St Lucie River as to completely take away its attractive features and ruin its commercial value to our community.

According to local Everglades SLR/IRL expert, Dr Gary Goforth,  (http://garygoforth.net/resume.htm), 1931 was the first year the amount of water released from Lake Okeechobee in to the St Lucie River was documented. Although there is no documentation of the releases that occurred prior to 1931, in 1931 it is documented that 1,414,414 acre feet of water was released from the lake into the river. This is over three times as much as was released into the SLR from Lake Okeechobee in 2013, (419,951 acre feet.)

The historic photos below document and show local people taking the water hyacinth issue into their own hands.

Downtown Stuart in 1931 showing over abundance of water hyacinth in SLR.
Downtown Stuart in 1931 showing over abundance of water hyacinth in SLR.(Thurlow collection.)
South Fork of the St Lucie River, hyacinth removal,     Rod and Gun Club-effort to solve problem with herbicide and dynamite, 1949.( Thurlow collection.)
South Fork of the St Lucie River, hyacinth removal, Rod and Gun Club-effort to solve problem with herbicide and dynamite, 1949.( Thurlow collection.)
SLR filled with hyacinth, near Treasure Island. (Thurlow collection.)

On August 3rd at 10AM the people of Martin and St Lucie counties, on behalf of their government, will ask one more time for the state to close the gates from Lake Okeechobee to the St Lucie River/Indian River Lagoon.

As we have seen this summer, we have enough problems with our own local runoff that has been expanded since 1931 to include the building of C-23, C-24 and C-25 as well as  the widening and deepening of C-44 for its enlarged “local” runoff. Things must change, we have known this for a very long time. Finally there are enough of us to make a difference.

Hope to see you at the rally and may the state and federal government know that we will never stop asking, some would say demanding, that the ACOE, through the federal government  and the state of Florida “close the gates!” 

river rally 2014 


Where Do We Draw the Line on Water? St Lucie River/Indian River Lagoon

West of the red lines shows the edge of what was once the Everglades in South Florida. Development has crept and continues to creep over this edge. (Photo/map courtesy of Chappy Young,/GCY Surveyors, 2014.)
West of the red line shows the edge of what was once the Everglades in South Florida. Development has crept and continues to creep over this edge. (Photo/map courtesy of Chappy Young,/GCY Inc. Surveyors, 2014.)

We in Martin and St Lucie Counties make up what is referred to as the “Northern Everglades.”  Before the Army Corp of  Engineers, (ACOE), changed the course of Lake Okeechobee’s waters in the 1920s and directed it to go east and west through canals to the estuaries, Lake Okeechobee’s water would slowly crest over the southern edge of the lake and flow south. For many, myself included, the long term goal of saving our St Lucie/IRL and Caloosahatchee estuaries  includes recreating  a type of “flow way, or floodway south” to Everglades National Park. The parched park needs our water just as Nature intended.

There are many challenges to this scenario but the most visual are the following.

The first is the Everglades Agricultural Area, (EAA), 700,000 acres located just south of the lake; the second is east coast development that has crept in over the years “into the Everglades.”

The red colored blocks south of Lake O. are the EAA-700,000 acres of sugar lands and vegetables. South of the EAA are the water conservation areas.(SFWMD map, 2012.)
The red colored blocks south of Lake O. are the EAA,700,000 acres of sugar lands, vegetables, small historic agricultural communities, and infrastructure. South of the EAA are the water conservation areas in purple and green. (SFWMD map, 2012.)
The red line shows the designated "Everglades." As we can see humankind has filled a lot of it in. (SFWMD map, 2012.)
The red line surrounding Lake O. shows the Everglades wetlands that historically filtered the water before it got to Florida Bay. As we can see humankind has “filled in” a lot of this. (SFWMD map, 2012.)

I have written before about the “seepage barrier” an underground permeable wall  that runs along the east coast to keep the water out of these developed areas through pumps that send the seeping water back inside the Everglades. Crazy. If needed, the EAA also pumps its ground water and surface water off its lands to keep the level as needed for the crops. They are assisted by the SFWMD. This is a historic relationship. It is how our state was “built.”

This satellite photo shows water on lands in 2005. One can see the lands in the EAA are devoid of water. This water has been pumped off the lands into the Water Conservation Areas, sometimes back pumped into the lake, and also stored in other canals. (Captiva Conservation 2005.)
This satellite photo shows in blue the water on lands in 2005. One can see the lands in the EAA just south of the lake are devoid of water. This water has been pumped off the lands into the water conservation areas, sometimes back pumped into the lake, and also stored in other canals. The water would flood the crops if it were on the lands. (2004-2005 SFWMD aerial photography.)

The above photo shows the EAA dry while surrounding lands are wet.

I really do not have an answer of how to build a flow way through all this agriculture, infrastructure, and development as I am not a scientist. But I have not given up the idea. I have faith one day there will not be another choice.

What I confidently can say is that we all know water is valuable, “the new oil.”  Water issues whether they be pollution or the need for water usage in a growing state demand attention and we know with  the future coming we should not build anything else inside those red lines. No port, no windmill farms, no more development, no more agriculture.

FWC map for 2060 projected population growth, state of Florida, 2011.

If the the Florida Wildlife Commission’s map is right and Florida’s population in 2060 is around 36 million,  (today it is 19 million), we are going to need more fresh water.  Also if we are to save the northern estuaries and the Everglades so our children have some semblance of what the planet once was, we must redirect more water to go to where it once did, south.

Let’s draw a new line for water. A line that clearly shows we know its value not just to agriculture and development, but to the environment, and the children of the future. 

_____________________________________________________________

1000 Friends of Florida 2060 Population: (http://archive.tallahassee.com/assets/pdf/CD52924126.PDF)
Northern Everglades DEP: (http://www.dep.state.fl.us/everglades/neepp.htm)
SFWMD/Natural Systems Model: NSM-4.5 (http://www.sfwmd.gov/portal/page/portal/xrepository/sfwmd_repository_pdf/nsm45.pdf)

A Time for Alligators Along the St Lucie River/Indian River Lagoon

An antique post card reads," A Florida Native." ca 1910. (Thurlow collection.)
An antique post card reads, “A Native of Florida,” ca. 1910. (Thurlow collection.)

I have always liked alligators. I have  been around them as long as I can remember in one way or another. When I was a kid and we would go water skiing near North River Shores close to the North Fork of the St Lucie River, we would see small ones leisurely resting in storm pipes coming out of people’s seawalls;  in my household everyone was always cheering for them as my grandfather Henderson, my parents, and later myself and brother also graduated from University of Florida. Jenny my sister is a traitor and went to Emory. 🙂

My parents have an awesome collection of alligator postcards that I will share today, and I figured now is a good time to write about gators as their babies should be hatching soon in nests along the fresh and some brackish areas of the St Lucie River/Indian River Lagoon. The females lay their eggs in early June and the little ones  hatch out about 65 days later.

“Crocodilla” fossil records show alligators have been on the earth for more than 200 million years. That’s pretty amazing in and of itself. But they have had many hardships.

According to Sandra Thurlow’s history writings on our Treasure Coast, when many of the first pioneers came to Florida and took river tours, they often just shot as many as they could “for fun.” This went for egrets and herons too. Sorry. But what a bunch of idiots. I know, I must be open minded and look at things “historically” within the context of the times….kind of like how people drained the whole state with out thinking…

As far as alligators, more recently, hunting, poaching, the fashion industry, pollution, and loss of habitat pushed the Florida alligator to the brink of extinction by the 1950s. In 1967 the US government listed alligators as an endangered species and gave them protection.  In one of the great comebacks of the “endangered,” alligators were increasing in numbers by the 1980s. They still have protections today, but are off the “endangered” list. 

Here are some of the antique postcards from my parents’ collection.

Alligator post card collection ca. 1910. (Thurlow collection.)
Alligator post card collection ca,. 1910-20 (Thurlow collection.)

IMG_6693 IMG_6691 IMG_6694 IMG_6690 IMG_6688 IMG_6686

Recently, a friend called me up and asked if there was someone who could move a small alligator on her property in Palm City. I called trappers recommended to me, and each of them said by law, if the alligator was reported as a “nuisance” and was over four feet, it would be removed and killed, not relocated.

I found this depressing but this is how the state manages the “nuisance gators.” Apparently they may be used for their leather and meat keeping the population in check.  Hmmm? The trapper also said, “If you don’t want it killed, just leave it alone, chances are it will move in time to another area.” This makes sense to me.

According to a Stuart News article by Ed Killer in 2010, in the state of Florida, the Florida Wildlife Commission from 1948 to 2009 documented that there were a total of  512 allligator bites; unprovoked: 330; provoked, 182; fatalities, 22. There have been two deaths in our Martin/St Lucie area. In 1978 a 14 year old boy was killed while swimming across Hidden River Canal off Bessey Creek and in 1984 an 11 year old boy was killed while swimming in a canal in St Lucie County. The alligators were 11-12 feet long.

This is terrible and heartbreaking. Like sharks, alligators share our environment are dangerous when large; we must be careful in their presence.

To end on a more positive note, in my reading I learned alligators have been noted using tools, like humans, a trait that belongs only to a few “intelligent” species. Yes. Alligators have been documented purposefully diving under the water putting sticks on their heads so water birds will land on them when looking for sticks to build their nests. Ingenious!

Maybe if we destroy the Indian River Lagoon and St Lucie River completely, along with the rest of the planet, they will return walking on two legs? Perhaps they would manage the waters of South Florida a lot better than humans…

_________________________________________

LINKS OF INTEREST

Florida Memory Project/Alligators: (http://www.floridamemory.com/photographiccollection/photo_exhibits/alligators/protection.php)
FWC/Alligator Facts: (http://myfwc.com/wildlifehabitats/managed/alligator/facts/)
FWC/Alligator Management: (http://myfwc.com/wildlifehabitats/managed/alligator/)
Encyclopedia of Life/Alligators: (http://eol.org/data_objects/15661319)

An Ironic Hope for the Future, Water Farming, St Lucie River/Indian River Lagoon

Caulkins Grove off of Citrus Blvd. is a pilot project of the SFWMD for water farming. (Photo Jacqui Thurlow-Lippisch 7-18-14.)
Caulkins Grove off of Citrus Blvd. in Martin County is a pilot project of the SFWMD for water farming. (Photo Jacqui Thurlow-Lippisch 7-18-14.)

On Friday, July 18th, Dr Gary Goforth (http://garygoforth.net/resume.htm) and I met at Indian River State College just after noon. I jumped in his truck, wearing my dress and heels, and we drove the back roads to find our destination. Our destination was long time Martin grove, Caulkins Citrus, located off Citrus Boulvard, near Indiantown, adjacent to the C-44 canal which of course connects to the St Lucie River/IRL and to Lake Okeechobee.

Kevin Powers, of the South Florida Water Management District governing board, longtime Martin County resident, and family friend, had invited Gary and I to see a pilot project of “water farming.” Water farming is idea that has been in the works for the past few years and is now finding its reality. If it works, thousands of acre feet of polluted water along the C-44 canal, in this case, will not find its way to the St Lucie River/ Indian River Lagoon. Farmers are paid for this service and their lands are not sold to development.

How could this be? Farmers “growing” water?

First we have to go back a bit.

In a Stuart News article dated April of 2013, Doug Bournique, executive vice president of the Indian River Citrus League, is interviewed by reporter Paul Ivice. Ivice writes:

“Diseases, (greening and canker), hurricanes and urban expansion have all cut into Florida’s citrus acreage which is down 38% from 1996…Nowhere in Florida has acreage fallen as sharply as in Martin County. It has less than 15% remaining of the 48,221 acres in production in 1994. The county has suffered the greatest loss for four consecutive years and and been declining sine 1994.”

A diseased citrus tree stands in what was once a thriving orange grove. (Photo JTL)
A diseased citrus tree stands in what was once a thriving orange grove, Caulkins Citrus. (Photo JTL.)

As the citrus industry is dying, so is our economy. While farmers figure out what else they can grown on their land, the idea for some farmers to hold precious fresh, all be it polluted, waters on their lands came into being. This helps the river and it helps the farmers and it helps our local economy. Boyd Gunsalus, among other scientist at the SFWMD, has worked long and hard for the past many years on this concept.

Caulkins Citrus is in a prime location and were one of the farms that competed for a bid to try out the new technology and receive a DEP/SFWMD grant.

An example from Google Maps showing C-44's close proximity to Citrus Blvd. Hwy. 76 is south of canal and Citrus is north.
An example from Google Maps showing C-44’s close proximity to Citrus Blvd. Hwy. 76 is south of canal and Citrus is north.

When Gary and I arrived we were met by Tom Kenny, Kevin Powers, and Ronnie Hataway. After introductions, they explained to us how the “farm”operated, how it was created, their hopes for the future, and gave us a walking and driving tour. It was pretty amazing if not surreal. Egrets and herons perched in the dying orange trees surrounded by water. A deer track was at my feet. Water was everywhere and from what I was told could one day go to the horizon.

Although Gary and I had been somewhat skeptical, we left feeling very hopeful and impressed.

So how did they create it?

Basically the grove is fallow due to poor health, and although the farm is much larger, (thousands of acres) a  berm was constructed around a few hundred acres of the grove for the pilot study. Then water was/is pumped from the C-44 canal into the old grove. The berm holds the water inside.

The water can go as high as four feet but according to Mr Kenny it is percolating so well through the soft sandy soils that basically the pump can stay on all the time. The nitrogen and phosphorus and other pollutants are cleaned and eaten by healthy bacteria as the water filters through the earth.

The pilot’s long term goal is to hold 6600 acre feet of water but things are looking like they will be able to hold more. The water is slowly filtered into the water table replenishing the aquifer about 40 feet below. Caulkins is installing a number of apparatuses that they call “wells” that will read where the water is going and what is happening underground. If things work out, Caulkin’s acreage to hold water will be expanded.

Various photos of the SFWMD pilot water farming project at Caulkins Grove: fallow orange groves surrounded by brim, pumps bringing in water form C-44 canal, sand, deer track.
Various photos of the SFWMD pilot water farming project at Caulkins Grove: fallow orange groves surrounded by berm, pumps bringing in water from C-44 canal right next door,  sandy soil, and deer track.

IMG_6579 IMG_6585 IMG_6588 IMG_6591 IMG_6596 IMG_6599 IMG_6602 IMG_6605 IMG_6608 IMG_6611 IMG_6577 IMG_6589 IMG_6594 IMG_6606 IMG_6575 IMG_6578 IMG_6581 IMG_6587 IMG_6595 IMG_6604

Although this is wonderful, we must note that it would take many water farms to offset the water flowing into the SLR/IRL.

Dr Goforth states in a recent writing: “For the 34 days between June 13 and July 17, approximately 51,000 acre feet of C-44 runoff was sent to the St Lucie River…”

With that in mind, if a water farm similar to Caulkins could hold 10,000 acre feet, we would need five just to hold the water that has come in this summer SO FAR from C-44 basin runoff. Of course in time, 2020 maybe, the C-44 Storm Water Treatment and Reservoir and Storm Water Treatment Area will be one line, and hopefully working, and that is said to hold  about 56,000 acre feet. (http://www.tmba.tv/broadcastanimation/everglades-restoration/everglades-restoration/)

In the end, really though, no one knows how much water can be held until these projects are working. Hopefully all of them, like Caulkins Grove seems to be so far, will exceed expectations. 

As we tied up our tour, shook hands and left the property Mr Hataway said, “I have been telling them for years to keep this fresh water on the land….”

Mr Kenny noted, “The goal is to have less water going into the river and out the inlet…”

It is an ironic twist of fate. We worked for 100 years to drain the lands so we could grow agriculture. Now we are trying to keep the water on the land for the health of the river, because fresh water is extremely valuable, and because the citrus industry needs a new crop. 

Words such as these about “keeping the water on the land,” especially from successful agriculturally minded businessmen, are an inspiration to me, and give hope for a better water future.

_________________________________________________

After the fact, I am including  this 2 page summary provided to me  by the SFWMD when I asked about costs on behalf of blog reader George Gill. Click to enlarge.

photo 1 SFWMD summary WF

__________________________________________________

RELATED LINKS:

DEP/SFWMD Water Farming Grant: (http://www.sfwmd.gov/portal/page/portal/xrepository/sfwmd_repository_pdf/dep_nr_2014_0429_water_farming.pdf)

Citrus Greening UF:(http://okeechobee.ifas.ufl.edu/News%20columns/00%20citrus_greening.htm) 

Finding Out How Much Discharge is Killing Our SLR/Indian River Lagoon and Where it’s Coming From

C-44, C-23 and C-24 basin runoff discolor the waters of the SLR/IRL while exiting the St Lucie Inlet 7-19-14. (Aerial photo, Ed Lippisch.)
C-44, C-23 and C-24 basin runoff discolors the waters of the SLR/IRL while exiting the St Lucie Inlet 7-19-14. (Aerial photo, Ed Lippisch.)
All Photos were taken 7-19-14 and are showing C-44 basin runoff along with C-23 and C-24 runoff into SLR/IRL. (Photos by Ed Lippisch.)
All Photos were taken 7-19-14 and are showing C-44 basin runoff along with C-23 and C-24 runoff off. Pictured are Sewall’s Point and Sailfish Point  along the SLR/IRL. Water exits at the St Lucie Inlet going mostly south to Jupiter Island over nearshore reefs. The plume is significant but not as large as the summer of 2013 when the ACOE was releasing from Lake Okeechobee as well. (Photos by Ed Lippisch.)

The river looks awful right now as the photographs taken Saturday, 7-19-14, by my husband show. Why? They are not even discharging from Lake Okeechobee…yet.

We have terrible problems with our local canals and adding the Lake discharges on top of it is a crime. The state, federal and local governments are working slowly to improve the situation through CERP (Central Everglades Restoration Project) projects but improvement is very expensive and cumbersome.(http://www.evergladesplan.org/pm/projects/proj_07_irl_south.aspx)

IMG_5593IMG_5597IMG_5604IMG_5610IMG_5631IMG_5649

The C-44 Storm Water Treatment Area/Reservoir the governments are working on now will cost millions of dollars and store only some of the discharges from the C-44 we are getting today. But there must be more. We must learn more. We must keep pushing and helping our governments move along.

The best way to do this is to know how to read the information on water discharges yourself.

Last summer, when the discharges from Lake Okeechobee threw our already ailing river into toxic status, Boyd Gunsalus, one of the the leading scientists (and certainly coolest) at the South Florida Water Management District, showed me how to find the water discharge statistics, and  today, in case you do not know, and are interested, I am going to show you.

FIRST THE LAKE AND C-44 BASIN

This link (http://w3.saj.usace.army.mil/h2o/reports.htm) of the ACOE at Lake O. will show you the level of the lake, and whether the ACOE is releasing from the C-44 canal, and or Lake O.

Go to the site above and on the right hand side you will see, St Lucie Lock, S-80 Spillway. Click on it. A chart will come up arranged by dates. (The data is always one day behind.) Look for FLOWS CFS (cubic foot per second) in the 3rd column. Today’s is 260 cfs. : 20JUL14  14.46  0.58  260 0. 00  270  0.0 7 30.07  1018. 2 0.00

Now go back to the same link and look at, Port Mayaca Lock, S-308 Spillway. Click on it. Again look for 3rd column, FLOWS CFS.. Today reads “0.” The gates from the lake to C-44 are not open. 20JUL14  13.55  14.40  0 0.00  270 0.0  9 30.04  1017.3  0.33  0.00

Now if both S-80 and S-308 are open you have to add the numbers together to know how much total cfs are coming into the SLR/IRL. And to figure out how much water is coming in just from the lake, subtract the S-308 number from the S-80 number which will always be larger.

To learn how high Lake O. is go back to the link, go to the chart and hit CURRENT LAKE OKEECHOBEE LEVEL. Today it is 13.66 feet. “Current Lake level is: 13.66 (ft-ngvd)”

OTHER CANALS

OK, now for C-23, C-24 and C-25.

Now, go to this link, the SFWMD’s web site: (http://www.sfwmd.gov/portal/page/portal/sfwmdmain/home%20page) 1. Look for the tab “Managing and Protecting Water;” look under and to the left of this tab for a small title reading “Scietists and Engineers,” click on this and go to LIVE DATA. 3. Go to the top link “Water Conditions-Regional Realtime Data, Status of Water/ Control Gates.” 4. Go to FT PIERCE and click right on the Ft Pierce link. A confusing chart will come up.

Look for these things:

1. S-49. S-49 is the opening for C-24.

2. S-97. S-97 is the opening/gate for C-23

3. S-99. S-99 is the gate for C-25.

Mind you C-23 and C-24 run into the St Lucie River’s north fork and main area and C-25 dumps directly in the IRL at Taylor Creek close to the Ft Pierce Inlet. So C-25 is not coming through the SLR and St Lucie Inlet like the rest of the sludge but it is important to know C-25 too as it is heavily destructive to the IRL.

OK, if you have been able to follow me so far. Once you open the SFWMD pages and get to FT PIERCE and see the weird chart, find the corresponding gate numbers I gave you above, and click on the the second row’s PLOT little box and arrow. Once this opens up, you will see a chart corresponding to discharges that looks like a wave or like boxes. The hight of the box or wave corresponds to a number on the left side of the chart. For instance: Today, S-49 (or C-24) is 450 cfs; S-97 (or C-23 ) is around 350cfs; and S-99 (or C-25) is around 100 cfs.

(I know there are a duplicate gates sometimes but I ignore them and  just read  one. They seem to say the same thing.)

Now to add up the cfs for “today:”  C-23=350; C-24=450; C-44 at S-80 =260; S-308 from lake, 0. Today’s total incoming discharge water is around 1060 cfs cubic feet per second coming into the St Lucie River/Southern Indian River Lagoon.

Last week it was twice or three times this much. The discharges occur after it rains, long after and then finally slow down like they are now.

I do hope this has been helpful and that your head is not spinning or that you can save the links and instructions and try it when you have time. Call me if you have questions and want to learn, 772 486 3818.

It is important for the public to keep up with this and let the ACOE and SFWMD know we are watching what they are doing, so one day I don’t have to choke when I see the tab “Managing and “PROTECTING” water.

photo

The Indian River Lagoon,”The Most Significant Bull Shark Nursery on the U.S. Atlantic Coast”

Baby bull shark navigates shallow waters. (Photo public files.)

Having grown up in Martin county water skiing, tubing, swimming, boating and fishing, I was surprised to learn as an adult that the Indian River Lagoon is one of the most important bull shark nurseries along the US Atlantic Coast.

Obviously the young sharks must display a different behavior than some of the older ones we learn about, as bull sharks are listed in the top sharks that attack humans. From what I have read, there have been no reported attacks in the St Lucie/Indian River Lagoon itself.

Personally, I was fascinated with sharks as a kid, (I am from the movie JAWS generation,) and know they play an important role in the food web and in the health of our oceans. I respect them which, yes, holds a certain element of fear. But there is no fear to be had for the many baby and juvenile sharks living in the St Lucie River and Indian River Lagoon.

Netted bull shark juvenile to be studied and returned to the IRL. (Public photos)

In 2011 a study was published by The American Fisheries Society by Tobey Curtis, Douglas Adams, and George Burgess entitled “Seasonal Distribution and Habitat Association of Bull Sharks in the Indian River Lagoon, Florida: A 30 Year Synthesis.” The study covers years 1975-2005. Impressive!

Major points of interest for me were:

1. In the spring, female bull sharks enter the lagoon through inlets, and have live baby sharks in the northern lagoon. The females’ gestation period is around 10-11 months. She does not enter the lagoon until she is ready to have birth and will bear between 1-13 “pups.” She leaves afterwards. The pups are on their own and will eat seagrass critters, rays, fishes, turtles, and even take chunks out of bottle-nosed dolphins.

2. These baby sharks show “site fidelity,” (they stay in certain areas,) but beginning  in October or November they appear to migrate south. Catch and releases of these young sharks have been documented all the way south to the St Lucie River although the majority were found in the area of the Sebastian Inlet.

3. Sharks under three feet represent the “dominant size-class” in the lagoon.

4. “Sharks greater than about 190 centimeters, or just over 6  feet, appear to have reached the size at which they leave the nursery and fully transition to offshore adult habitats.” Yikes! 🙂 Sharks this size are thought to be sexually mature but data is sparse, and some studies note up to 15 years for sexual maturity.  (Some of the largest documented bull sharks in the ocean are 9-11 feet and over 500 pounds and are estimated to live from 20 to 30  years but no one really knows yet.)

5. Bull sharks are tolerant of both salt and fresh water and known to go far up into the rivulets of estuaries.

6. Bull sharks slow growth and reproduction rate means they do not populate easily or rapidly.  Bull sharks, as many sharks, are on the edge of “threatened status,” and should be protected.

7. Because baby bull sharks use inshore and nearshore systems like the SLR/IRL that are “suffering from dramatic anthropogenic alteration and habitat loss, this potentially affects the survival of the species.

8. Bull shark juveniles are frequently observed at heated power plant outfalls, brackish and saltwater creeks, around piers, over seagrass flats, open and muddy bottoms and in dredged channels.

9. The authors note that “although seagrasses in some areas are stable or increasing, seagrasses have declined up to 70% in some areas over a 50 year period. (And this paper was compiled before the crash of 60% seagrasses that occurred from 2011 to 2013 in the northern and central lagoon due to the super and brown tide algae blooms.)

Adult bull shark. (Public photo/Pinecrest.)

10. The bull sharks of the Indian River Lagoon are their own genetic stock, unique from bull sharks of other areas.

The is no reason to be afraid and every reason to be fascinated! If you catch a baby bull shark please release it back into the lagoon. He or she has a long  journey ahead to clean up our oceans and fulfill its destiny as a top predator of the sea. 

Adult bull shark swimming. (Public photo for "wallpaper." )
Adult bull shark swimming. (Public photo for “wallpaper.” )

________________________________________________________________

Seasonal Distribution and Habitat Association of Bull Sharks in the Indian River Lagoon, Florida: A 30 Year Synthesis: (http://research.myfwc.com/engine/download_redirection_process.asp?file=11curtis_2543.pdf&objid=61673&dltype=publication)

If above link will not load try this: (http://www.researchgate.net/publication/233147673_Seasonal_Distribution_and_Habitat_Associations_of_Bull_Sharks_in_the_Indian_River_Lagoon_Florida_A_30-Year_Synthesis)

FWC/Bull Sharks: (http://myfwc.com/research/saltwater/sharks-rays/shark-species/bull/) 


The National Academy’s “Clean Coastal Waters” and the Irony of “More Studies” for the Indian River Lagoon


Toxic Algae bloom washes up  along the shoreline, St Lucie River, Riverside Drive, Stuart, Florida. (Photo Jenny Flaugh, 7-13)
Toxic Algae bloom washes up along the shoreline. St Lucie River, Riverside Drive, Stuart, Florida. (Photo Jenny Flaugh, summer 2013.)

RECENT HEADLINE: “FUNDING FOR  82 Million in NEW RESEARCH/CAUSES/CONTROL OF ALGAE BLOOMS IN US AND IRL– SPONSORED BY U.S. SENATOR BILL NELSON D-FL”

As much as I am thankful for the politicians and policy makers who have recently gotten monies allotted to fight the “toxic algae in Florida’s waterways,” I am slightly miffed. From what I understand, and have learned over the past years,  much of the research to understand these problems has already been accomplished, particularly by the National Research Council.

In 2008, when I was just beginning to really plow in and try to understand why the St Lucie River and Indian River Lagoon issues were happening and basically at the time being ignored publicly and politically, I was recommended to read “Clean Coastal Water, Understanding and Reducing the Effects of Nutrient Pollution,” published by the National Research Council in 2000.

The National Academy of Sciences (NAS) is a non-profit organization in the United States. Members serve pro bono as “advisers to the nation on science, engineering, and medicine”. Election to the National Academy is one of the highest honors in U.S. science. The academy was signed into law under the presidency of Abraham Lincoln in 1863. These public documents are available to all and these agencies give presentations to the US House and Senate and have done such on “algae blooms in coastal waters.”

The National Academy of Sciences is part of the National Academies, which also includes:the National Academy of Engineering (NAE); the Institute of Medicine (IOM); and the National Research Council (NRC).

It is an honor to be a member or to do research for a member and nearly 200 members have won nobel prizes. These scientists and their affilliatoins are the “best of the best.”

Locally, Dr Brian LaPoint working in St Lucie County, helped with the publication. He is from Harbor Branch/FAU. Also  Dr Margaret Leinen, the Executive Director of Harbor Branch at the time, now of Scripps Oceanography in California, was invited to speak before Congress on the subject.

Toxic algae, photo by Mary Radabaugh of St Lucie Marina, July 2013.)
Toxic algae, photo by Mary Radabaugh of St Lucie Marina, summer months of 2013.)

So, in 2000, the National Research Council’s book Clean Coastal Waters, Understanding and Reducing the Effects of Nutrient Pollution, was published and it is very clear in its studies, and recommendations. I will quote from the executive summary:

“What common thread ties together such seemingly diverse coastal problems as red tides, fish kills, some marine mammal deaths,  outbreaks of shellfish poisonings, loss of seagrass habitats, coral reef destruction, and the Gulf of Mexico’s dead zone? Over the past 20 years, scientists, coastal managers, and public decision makers have come to recognize that coastal ecosystems suffer a number of environmental problems that can, at times, be attributed to the introduction of excess nutrients from upstream watersheds…the driving force is the accumulation of nitrogen and phosphorus in fresh water on its way to the sea. For instance, runoff form agricultural land, animal feeding operations, and urban areas, plus discharge from water water treatment plants and atmospheric deposition of compound releases during fossil fuel combustion all add nutrients to fresh water before it reaches the sea.”

On page 34 the writers note:

” Inorganic fertilizer accounts for more than half of the human alteration of the nitrogen  cycle. Approximately half of the inorganic nitrogen fertilizer ever used on the planet has been  used in the last 15 years… The increased use of commercial fertilizer over the last 50 years has contributed to dramatic increases in per acre crop yields. But it has also brought problems, (e.g., adverse changes in soil properties and offsite environmental problems caused by runoff.)

Later in the book nutrient pollution is recognized as an enormous, complex and difficult issue but the NAS’s advice is to implement policies in a coordinated effort, locally, state and nationally to control nutrient pollution at its sources. Guidance for this is provided in chapter 9 “Source Reduction and Control.”

For me as a  Sewall’s Point commissioner, our commission fought and passed a strong  fertilizer ordinance in 2010, and since that time many others have as well along the Indian River Lagoon.  This is just a start and local governments will have to do more in the future.

NAS states nutrient pollution problems come from “agricultural land, animal feeding operations, and urban areas plus discharge from water water treatment plants and atmospheric deposition of compound releases during fossil fuel combustion all add nutrients to fresh water before it reaches the sea.” We along the coast in cities, etc..qualify as the “urban areas.” And locally that is all we have the jurisdiction to control. The rest, particularly  agriculture issues of “best management practices” and more, has to come from the state and federal governments. 

So back to Senator Bill Nelson, who I admire very much, and who grew up in the Melbourne area along the IRL, spearheaded a recent bill by the US Senate that will “fund research into the causes and control of large algae blooms.” This is terrific, but guess what? “We” basically already know the causes.

Let’s get some nerve politicians, and use this money to help and demand those who are not making fast enough efforts to lower their output of nitrogen and phosphorus. Let’s break the wall of not being allowed to implements restrictive laws on the agriculture industry that is protected by the “”right to farm act;” and let’s assist them in the funding they need to make these changes and find other ways to grow crops or different crops to grow…

Lets continue dealing, moving and helping dairies and animal operations close to waterbodies; let’s implement even stricter laws  on water treatment plants like the one along the Banana River in the Coca Beach area, in the northern central lagoon, where all the Unusual Mortality Events (UME) occurred last year of manatee, dolphin, and pelican deaths, and the majority of the 60% seagrass loss in the IRL since 2009 has occurred.

Atmospheric compounds? Perhaps require /inspire higher emission standards for cars in our Treasure Coast and continue the fight for clean air on a National/Global level through are Congressional representatives. Learn to “make money” for people from this problem rather than limiting people.  No easy task…

“Invasion of government,” you may say. “Yes it is.” And I don’t like it either, but at this point in order to to save the SLR/IRL, is their any other way?

If  we need the local data, then lets get it, but I do believe we already know where to start and I do believe we already know what to do.

_________________________________________________________

National Academies Press: (http://nap.edu)

National Academies of Science: (http://en.wikipedia.org/wiki/United_States_National_Academy_of_Sciences)

Sunshine State News: (http://www.sunshinestatenews.com/story/bill-nelson-and-bill-posey-team-pass-bill-fighting-algae-outbreaks) 


C-25 Canal/Taylor Creek Impacts the “Best of the Best” of Our Indian River Lagoon


Aerial photo of C-25 canal carrying what DEP and SFWMD district note as "nutrients and agriculture chemicals to the Indian River Lagoon." (Photo Ed Lippisch, July 10, 2014.)
Aerial photo of C-25 canal depositing what DEP and SFWMD note in their Eco-Summary literature as “nutrients and agriculture chemicals into the Indian River Lagoon.” (Photo Ed Lippisch, July 10, 2014.)

Ed and I returned from California on July 9th and within 24 hours he was up in his plane and took these photos of C-25’s Taylor Creek outlet in Ft Pierce releasing excessive rain water runoff into the Indian River Lagoon. Still recovering from the three hour time difference, I gladly stayed home!

C-25 runoff into IRL. (Photo Ed Lippisch 7-10-14.)

The C-25’s  canal outfall, although not connected to Lake Okeechobee, is one of the most dramatic and heartbreaking sites of our Indian River Lagoon’s destruction as it releases very close to the Ft Pierce Inlet so the difference in the water color is extreme. C-23, C-24, and C-44 releasing into the St Lucie River are probably quite similar, however, because the St Lucie River is dark in color and not close to an inlet to the ocean–the brown on brown water does not give the same effect as C-25’s brown on blue.

C-25 canal in Ft Pierce. (Photo Ed Lippisch 7-10-14.)

During last year’s heavy releases from Lake Okeechobee by the ACOE, my husband Ed and I flew up to Ft Pierce and flew the entire length of the C-25 canal which attaches  to the C-24 canal, which in turn attaches to the C-23 canal. The water can be”made” to go in any direction by the South Florida Water Management District for agriculture purposes or otherwise. So water from C-23 or C-24 could theoretically be moved into C-25 and visa versa.

So anyway, Ed and I were taking a video for Dr Edie Widder of ORCA who is studying the water issues of the area. The ride was so bumpy and windy I became very sick which is not unusual for me in airplanes.

“Ed can you turn around?” I think I am going to puke.” I muffled through the microphone.

“Sorry babe, we’re in for the long haul with this wind; we should just  follow the canal in this direction and ride it out….”

At that point my jacket  in the back storage area flew out of the Cub and I envisioned it going over Ed’s face and us crashing, but it did not, and instead floated to the ground below. I held my stomach wondering what the person or cow who saw the jacket fall to the ground thought, hoping it did not land on someone’s windshield.

That trip, along the C-25, C-24 and C-23 back to Stuart was the worst ride of my life and I got sick many times while looking over mostly acres of orange fields and other agriculture. I saw some cows and then development as we got closer to the coast.  I really just remember that is was acres and acres of land.

In the wind, the trip took over an hour from Ft Pierce, inland, south, and then back to  the east coast of Stuart. The map below shows how the canals are connected and you can see the path we took–like a giant tall open rectangle.

Canal and basin map SLR/IRL. (Public)
Canal and basin map SLR/IRL. (Public.)

There is great literature on the C-25 and from what I have read the state agencies have been aware of the destruction caused by the canal for many years.

The ECO SUMMARY written by the Florida Department of Environmental Protection 1998, unfortunately, mostly still applies today, as the Indian River South Plan, has not come into being yet. The Indian River South Plan is a component of the Central Everglades Restoration Plan or CERP, that was approved by Congress around 2000. This plan would and hopefully will, one day, acquire lands, to hold water so it doesn’t just run untreated into the lagoon.

C-23, C-24 and C-44 are part of this IRL Plan as well, and as we know we have been fortunate this year and in recent past years to have been appropriated partial monies by our US Congress, the state of Florida and Martin County to build the C-44 Storm Water Treatment and Reservoir system–they are building it now.

But back to the C-25 the Eco-Summary. This link  below interestingly states:

“The C-25 Canal was created as past of the Central and Southern Florida Flood Control Project (1950/60s) and discharges into the Indian River Lagoon…The section of the lagoon currently impacted by discharges from C-25 comprises one of  the best remaining segments of the lagoon, namely the area just north of Harbor Branch Oceanographic Institution to the Ft Pierce Inlet…Thus C-25 potentially impacts the best of the best.”

“C-25 delivers a greater volume of water and thus a great net pollutant load that the other major upper east coast drainage canals C-23, C-24, and C-44. ( A surprise to me.) C-25 has been shown to transport pesticides, polyaromatic hydrocarbons, and heavy metals into the estuary as well as offshore…”

DEP: (http://www.dep.state.fl.us/southeast/ecosum/ecosums/c-25.pdf)

As you would expect, the C-25 is an “impaired” water body and was determined as such by the Department of Environmental Protection in 2003. Yet the IRL, from Vero to Ft Pierce Inlet, has been designated by the state as  a protected Aquatic Preserve since 1975.  

Did I just write that?

An impaired canal full of heavy pollutants has been running into an Aquatic Preserve?

 Yes, I just wrote that. This is the truth. 

This to me is even more heartbreaking than the photo. To know  “we” have known the situation since the 1970s really and have not fixed the issue is a crime. We are all guilty as it is we that direct the course of our government.

So please don’t forget:

“The power of the government is derived from the consent of the governed….”Let’s keep pushing our elected officials and be prepared ourselves to do what it takes to fix this mess! 

Thank you for reading my blog and for caring about our rivers.

_________________________________________________________ 

Department of State/Impairment C-25 Canal: (http://www.dep.state.fl.us/southeast/ecosum/ecosums/C-25_Impairment.pdf)

IRL Aquatic Preserve Vero to Ft Pierce: (http://www.liveoakproductiongroup.com/AquaticPreserve/indian_river_south.html) 

Aquatic Preserves DEP (http://www.dep.state.fl.us/coastal/programs/aquatic.htm)

SFWMD: Indian River Lagoon South Project/CERP: (http://www.sfwmd.gov/portal/page/portal/common/pdf/irl_south_042804.pdf)

C-44 Basin Runoff 2014, Another Summer of Dirty Water For Our Indian River Lagoon, Why?

Aerial of the confluence of the SLR/IRL off of Sewall's Point, July 27th, 2014. (Photo courtesy of Scott Kuhns.)
Aerial of the confluence of the SLR/IRL off of Sewall’s Point, June 27th, 2014. (Photo courtesy of Scott Kuhns.)

If there is one thing constant about the St Lucie River/Indian River Lagoon’s problems, it is that they are multi-layered and complex. I believe this is one reason it has been so hard to “fix.” If there were just one problem, it would be easier, but there is not one problem, there are many.

So, today I wanted to focus  on C-44 basin runoff, again, as it has been in the news a lot, especially the two weeks since I was gone as I heard it really rained and we even got our first named hurricane.

The photo above shows the waters just off of the tip of Sewall’s Point on June 27th, 2014. Disgusting.

Basin map Martin/St Lucie SLR.

The basin map above reminds us of the C-44 basin’s location  in southern Martin County. The “basin” is the large area surrounding the C-44 canal in black lines.  As we know, this area is largely agricultural and was expanded over the years to drain more land than nature intended.

Through permits with the South Florida Water Management District the agricultural businesses are allowed to use water from the C-44 canal for irrigation when needed, especially during the “dry” season. The Army Corps of Engineers manages the level of the canal mostly for agricultural use; this is an historic relationship. In spite of “best management practices” much of the water used to irrigate their fields, runs back into the canal, over and over again, filled with fertilizers, pesticides, herbicides, etc…This is the untreated, polluted water that goes straight into our rivers.

As we can see looking at the canal map, over the years, the C-44 basin has become tremendous in size in order to drain land for agriculture and development.  Millions of gallons of water come off these lands when it rains, as has been the case the past couple of weeks.

This recent photo below by local river activist and fishing guide, Michael Conner, shows what the C-44 basin water looks like when it comes out of the S-80 gates at St Lucie Locks and Dam, the same gates that are used when water is released from Lake Okeechobee when the ACOE opens S-308 at the lake. This can be confusing because usually we associate this type of photo with releases from Lake Okeechobee. S-80 can release just C-44 canal water or “just lake water,” or both lake and C-44 water…

S-80 releases water from S-80 into the C-44 canal at St Lucie Locks and Dam, July 2014. (Photo  courtesy of Michael Connor.)
Releases from S-80 from the C-44 canal at St Lucie Locks and Dam, July 2014. (Photo courtesy of Michael Connor.)

So why haven’t we talked  about the C-44 basin until this summer, or seen or very much about it in the newspaper “before?”

Well, it is confusing to the lay person, and I don’t claim to know everything, but I will explain what I can.

Generally, in the past,  the ACOE did not usually release the C-44 into the river during the summer…but this summer they are. Why?

Well according the the “Environmental Impact Statement (EIS) for the 2008 Lake Okeechobee Regulation Schedule (LORS),” the document the ACOE uses to manage Lake Okeechobee:

“All alternatives assume back flow from the St Lucie Canal, C-44, to Lake Okeechobee to be allowed to occur at lake stages of 14.50 ft or 0.25 from the bottom of the the lowest non-baseflow regulatory zone, whichever is lower.”

Basically this means that under most circumstances if the lake is under 14.5 feet,  which it is now, (13.38), the ACOE will “back flow” C-44 canal runoff water into the lake through S-308, rather than sending it east to the SLR/IRL through S-80. This summer the ACOE  has chosen not to do this, so we are getting C-44 basin water released into the SLR/IRL so the water looks gross. In the ACOE’s July 11th, 2014, public periodic scientist call email statement, explaining their choices, it reads:

“The Water Control Plan deliberately allow some flexibility to consider real time and forecasted conditions and decisions made within the guidance provided by the Water Control Plan…for the specific decision not to flow water from the C-44 basin into Lake Okechobee since 12 June 2014, the conditions that we took into consideration were rising lake levels, water supply, remaining duration of the wet season and proximity to the low sub band….the 8 July report from the South Florida Water Management District evaluates the condition of St Lucie Estuary and states “salinity at US1 is within the preferred range for oysters in the mid estuary.”

Photo of  SLR/IRL off Sewall's Point yesterday, 7-15-14. (Thank you Ed Lippisch)
Photo of SLR/IRL off Sewall’s Point yesterday, 7-15-14. (Thank you Ed Lippisch)

Hmmm? Obviously the SFWMD’s salinity report was not that of Mark Perry’s at Florida Oceanographic…Let’s read and take a look.

Mark Perry feels the ACOE should be back flowing the C-44 water into the lake. He says:

“According to the Water Control Plan for the Lake the Corps should be opening S-308 and back flowing this local basin runoff into the lake when the lake is below 14 feet and the C-44 is above 14.5 feet but they have chosen to make steady releases from the C-44 basin through S-80 into the St Lucie at near 1000 cfs since June 14. Not so good outlook for the St Lucie Oysters…”

Please view his chart below that shows what has happened to salinity levels since the C-44 has been flowing into the SLR/IRL. (Mind you C-23, and C-24 are also dumping their basin runoff water, but C-44’s basin area is larger.)

Salinity is going below safe levels for oysters since the C-44 has been opened.
Salinity is going below safe levels for oysters since the C-44 basin at S-80 has been opened.

On the other hand, friend of Mark Perry, Kevin Henderson, long time advocate for the SLR/IRL and founding member of the St Lucie River Initiative, feels the ACOE is perhaps trying a strategy that will help the St Lucie in the “future.” Kevin states:

“I firmly disagree that the Corps should always run C-44 drainage west until the Lake reaches 14.5. That is the pattern that gets us the most continuous lake and C-44  drainage into the fall, and the the patten that kills oysters…It is not basin runoff that kills the estuary, it’s months of continuous discharges at rates that never let salinity recover. This is why I advocate sending C-44 drainage west only when local salinity could recover for a while, then send it east again and do not let Lake O get high enough to wreck us with longer term discharges…”

I think he’s saying, the ACOE, by not consistantly filling the lake up with C-44 basin water during summer, may be avoiding long term runoff into the SRL/ILR in the future come fall…

Hmmm?

Both Mark and Kevin have a point.

My non-scientific perspective?

I think the ACOE was so taken aback by the wrath of the general public last year, the River Warriors, the River Kidz, the River Movement, the Stuart News/media, as well as some politicians, that they will do “almost anything” not to release water from Lake Okeechobee into the St Lucie River/Indian River Lagoon if they don’t have to.

By letting the C-44 basin water go into the river and not the lake, if a hurricane comes, there is just that much more room in the lake to hold the water so they don’t have to dump here and listen to us scream….

_____________________________________


ACOE Jacksonville/Lake O: (http://w3.saj.usace.army.mil/h2o/reports.htm)


Human Eradication of Mosquitoes, San Francisco, and the Destruction of the Indian River Lagoon

Mosquitos were a great nuisance to early pioneers and were often swarming by the thousands. (Public internet photo, 2014)
Mosquitos were a great nuisance to early Florida pioneers, often swarming by the thousands. Mosquito impoundments  created to control their breeding have destroyed over 40,000 acres of important salt marsh habitat along the IRL. (Public internet photo, 2014.)

So there Ed and I were, in San Francisco, for my 50th birthday, and although we had a fantastic trip, everything I looked at that had to do with water, I saw through my “Indian River Lagoon” muck colored sunglasses…

Map showing former tidal marsh area of San Francisco Bay; restored marsh; and beach with water quality warning., (Photos Thurlow-Lippisch, 2014.)

Photos: Water quality sign San Francisco Bay; restored tidal marsh at Chrissy Field; map showing former natural tidal marsh area of San Francisco Bay compared to today.”  (Photos Thurlow-Lippisch, 2014.)

IMG_6031

IMG_6038

On our first day, we decided to rent bicycles and ride over the Golden Gate Bridge as my sister Jenny and her husband Mike had recently done the same. It was great fun, and once I got my legs moving, we first explored a nearby area that is being restored and redeveloped around Chrissy Air Field.

There were educational signs discussing the importance of salt marsh habitat and a map showing how much marsh had been lost in the development of the San Francisco Bay area. The main focus was on the “restored” marsh in front of us that had been a dump for the military and filled in with sediment  from the bottom of the bay.

From the 1800s through around 1960 marshes were considered “unhealthy.”  But in time it was realized that marshes contributed greatly to environmental health and were critical for good water quality, wildlife habitat, and linked to clean drinking water.

Reading the signs I said to Ed: “Wow! Look Ed,  see that NOTICE sign for the bay’s water quality and bacteria levels.? Just like home!” Ed smirked, more interested in the old airfield that still took up a good portion of Chrissy Marsh.

So we rode our bikes over the Golden Gate Bridge and as I was struggling to breathe and not collide with on coming bicyclists, I thought about salt marshes in my own home town, and how they were destroyed not by a dump, filled in to become an air field, but mostly by mosquito impoundments.

Ed and my bicycle ride over the Golden Gate Bridge, 2014.

Ed and my bicycle ride over the Golden Gate Bridge, 2014.

IMG_6054 IMG_6060 IMG_6062

Before and after the turn of the 19th century, Florida was full of mosquitos and even in the 1960s when I was living in Stuart, they were ferocious. I remember being at the bus stop in in middle school and running in place the entire time so they couldn’t bite my legs. There were positives as well, like the social event of riding my bike with my friends behind the mosquito truck with its billowing cloud of pesticide spray that came to visit every few evenings during the summer. 🙂

Today it is well accepted in scientific circles that the most extensive impacts of Florida’s salt marshes have been associated with mosquito control programs which continue to be in great demand  in Florida today. Some of the highest densities of  mosquitoes ever recorded in the continental US occurred right here in south Florida before mosquito control.

To alleviate this issue and encourage development in Florida, salt marsh impoundments were constructed as a government management technique to decrease mosquito populations by continually flooding impounded areas of marsh. Around 1930, thousands acres of wetland marshes along the Indian River Lagoon were flooded to keep misquotes from hatching as salt marsh mosquitoes lay their eggs just above the edge of the water level in these areas. By flooding the impounded marshes, mosquito managers could flood the impoundments and drown the eggs.

Smithsonian/IRL: (http://www.sms.si.edu/IRLSpec/Impoundments.htm)

Today there are 192 impoundments along Florida’s east coast. A large percentage of these impoundments are in IRL as the IRL takes up 40 % of Florida’s east coast.  These impoundments  are separated from the lagoon by dikes built  around a designated area so it can be filled with water via a pump systems. Over 40,000 acres…

mosquito

Filling these areas with water has had a  huge ramifications on wildlife in the lagoon as the dikes cut off juvenile fish and other critters from their needed protective mangrove/seagrass areas and habitat. Over time, this habit disconnect and loss has led to the extinction the dusky seaside sparrow in the 1987 and much lower and less healthy fish populations.

Also, in some cases the impoundments did not work, or were not well managed, and became breeding grounds for mosquitoes. Drowned native vegetation suffered, especially noticeable is the loss of the giant black mangroves, whose breathing, tubular root systems were drowned killing these ancient trees and leaving them as sentinels of death within the system.

Things have gotten better. As the destruction of salt marshlands and the negative effects on the IRL became more apparent, in the 1980s and 90s some mosquito managers started altering their practices by managing chosen sites with the RIM or “Rotational Impoundment Management Plan.” The RIM program is a seasonal rather than yearly control method, promotes flushing of impounded areas, uses fewer pesticides, focuses on water quality improvements and the promotes restoration of native vegetation.

These improved management strategies have helped lessen the isolation of fish species from their habitat; have allotted benefits to animals,  trees, and vegetation; and improved water quality for tiny and important marsh critters, the base of the food chain.  Nonetheless, the “tidal  exchanges” of the impoundments are limited and not what nature intended.

While fighting for the IRL, we must remember to fight on all fronts and continued improvements of mosquito impoundments should not  be forgotten!

So in conclusion, I loved visiting California. There were too many people but great beautiful, protected National Parks.

I am really enjoying  being home, especially in my own bed. And right away,  on the first night back, I had a wildlife visitor welcoming me home, the familiar sound in the darkness of a mosquito buzzing around my ear!

___________________________________________________

IFAS/UF/ Mosquito Management/RIM: (http://fmel.ifas.ufl.edu/marsh/05_strategies.shtml)

Florida Gulf Coast University/Florida Coastal Salt Marshes: (http://library.fgcu.edu/caloo/csaltm.pdf)